


Introduction
With the advancement of nanotechnology, the use of nanomaterials is rapidly increasing in a multitude of fields (electronics, cosmetics, biotechnology, material science, etc.) [1]. In particular, silver nanoparticles (AgNPs) are widely used in consumer products such as electronics, household, nursery products and textiles because of their unique antibacterial activity [2,3]. According to the report by the Woodrow Wilson International Center for Scholars [4], AgNPs are the most commonly used nanomaterials. As the use of consumer products containing AgNPs becomes widespread, AgNPs will eventually be released into the environment. For example, upon washing textiles embedded with AgNPs, the AgNPs can be released into water [5,6]. Also, it was found that the AgNPs from paints used for outdoor applications can be released into the surrounding environment by rain events [7]. Potential introduction of AgNPs into the environment has motivated intensive study on the potential toxicity of AgNPs on the ecosystem [2,8-10]. However, relatively little is known for the fate and transport of AgNPs in the environment, which is equally essential to their risk assessments [11,12].
Environmental fate and transport of nanoparticles can be significantly influenced by aggregation in water and adsorption onto the soil matrix [13,14]. Aggregation of nanoparticles, causing an increase of particle size, can typically lead to sedimentation and thereby decrease of nanoparticle concentration in water [15] and can have a significant effect on their chemical reactivities (or toxicity) [16,17]. In addition, nanoparticles can be adsorbed (or deposited) onto solid surfaces, which can reduce the transport and bioavailability of nanoparticles [15]. Therefore, a thorough understanding of aggregation and soil adsorption behaviors involved in the fate and transport of nanoparticles is an essential step for accurate prediction of their potential risks to human health and the environment.
In general, it is known that aggregation and soil adsorption behaviors of nanoparticles depend on their physicochemical properties and solution chemistry [11,14,18]. Several studies have investigated the effects of the types of AgNPs (i.e., coating types) as well as solution chemistry (i.e., salt type and concentration) on their aggregation behaviors [11,19]. However, there is relatively a lack of research on soil adsorption of AgNPs. In particular, little is known about the influence of environmental parameters on simultaneous particle aggregation and soil adsorption. In addition, it is not clear whether the currently available guidelines for the soil adsorption testing of chemicals (e.g., Organization for Economic Cooperation and Development (OECD) Test Guideline 106 [20]) are applicable to nanoparticles or not.
The purpose of this study is to assess how environmental parameters such as ionic strength and natural organic matter (NOM) can influence the aggregation and soil adsorption of citrate-coated AgNPs. The aggregation and soil adsorption of AgNPs were tested using time-resolved dynamic light scattering (TR-DLS) and batch adsorption method, respectively, at sodium nitrate (NaNO3) solutions and in both the presence and absence of humic acid.
Materials and Methods
Materials
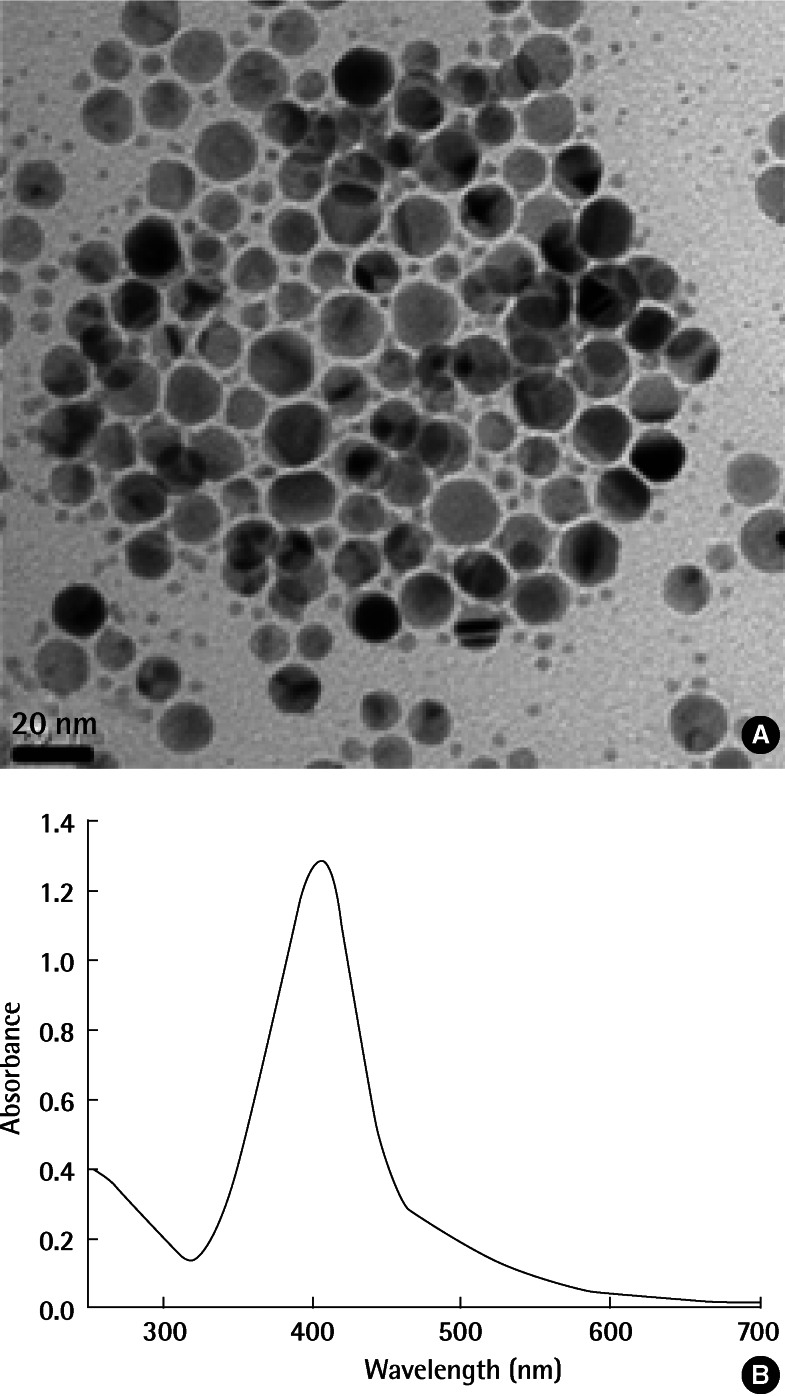
Citrate-coated AgNPs were obtained from ABC Nanotech (Daejeon, Korea) and used without further purification. According to the vendor-supplied specification, the arithmetic mean particle diameter was 13.3 nm. Transmission electron microscopy (TEM) (Tecnai G2 F30 S-Twin, Eindhoven, Netherlands) imaging of the AgNPs showed that these nanoparticles are in reasonable agreement with the manufacturer's specifications (Figure 1A). Ultraviolet-visible (UV/Vis) absorbance spectrum (Lambda 25 UV/Vis spectrometer; PerkinElmer Life and Analytical Sciences, New York, NY, USA) of the AgNPs showed a maximum peak at 405 nm, which agrees with previously published results (Figure 1B) [21].
NaNO3 (99%, Sigma-Aldrich, Missouri, MO, USA) and humic acid (Sigma-Aldrich) were used to evaluate the influence of ionic strength and NOM, respectively. All aqueous samples were prepared using high performance liquid chromatography (HPLC)-quality distilled water (B&J HPLC Certified Solvent).
Soil used for adsorption studies was sampled from a rice paddy field in Daejeon, Korea. The soil was air-dried for 7 days, after which it was crushed in a mortar and passed through a 2 mm sieve and kept at room temperature before use. Table 1 shows the physicochemical properties of soil used in this study.
Aggregation Kinetics
The aggregation kinetics of AgNPs in various solution conditions were characterized by monitoring the hydrodynamic diameters (Dh) as a function of time through TR-DLS. In order to evaluate the effect of ionic strength on aggregation, 0.1 mL of the AgNPs stock suspension (100 mg/L) was transferred to a disposable cuvette (Kartell, Milan, Italy) and the appropriate amount of NaNO3 and distilled water were added to achieve the desired electrolyte concentration. The final volume of the suspension was 1 mL with a final AgNPs concentration of 10 mg/L. The resulting solution was gently shaken. Then the Dh of the AgNPs was measured at 25℃ for 90 minutes at intervals of 15 seconds using the ZetaSizer Nano ZS (Malvern Instruments Inc., Worcestershire, UK).
For the aggregation experiments with humic acid, 0.1 mL of the AgNPs suspension precontacted with humic acid solution was transferred to a disposable cuvette and the appropriate amount of stock NaNO3 and distilled water were added to achieve the desired electrolyte concentration. The final concentration of humic
acid and AgNPs were 50 mg/L and 10 mg/L, respectively.
The initial aggregation rate (k) of AgNPs can be determined by fitting the initial linear increase [11] using equation 1:
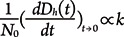
where N0 is the initial AgNPs concentration. In this study, since all samples have the same particle concentration (i.e., 10 mg/L), the attachment efficiency (α, the inverse of the particle stability ratio W) was calculated by normalizing the initial rate of increase in Dh(t) of a given electrolyte concentration by the initial rate of increase in Dh(t) under favorable (fast) aggregation conditions (i.e., diffusion-limited conditions) where the rate is independent of electrolyte concentration [11] using equation 2:
The zeta potentials of the AgNPs were measured in folded capillary cells at 25℃ using the same instrument (i.e., ZetaSizer Nano ZS). Three measurements were carried out for each sample.
Batch Adsorption Experiments
Batch soil adsorption experiments were carried out according to the method similar to that described by the OECD Test Guideline 106 [20]. For experimental condition varying ionic strength, NaNO3 was used as a substitute for calcium chloride in order to minimize the possibility of AgCl precipitation (Ksp=1.77×10⁻¹⁰ [22]) and the enhanced aggregation of AgNPs in the presence of divalent cation (Ca2+) [23].
The soil samples (1.25 g) and 47.5 mL of NaNO3 background solution were transferred to 50 mL Falcon test tubes and were equilibrated by shaking overnight before the day of the adsorption experiment to reach the equilibrium of background solution and dried soil. Afterwards, a certain volume of the stock solution of AgNPs was added to achieve the final desired concentrations. The tubes were sealed and shaken by using an orbital shaker (JSOS-700; JS Research Inc., Gongju, Korea) at 200 rpm. All adsorption experiments were performed in the dark condition at 25±1℃. After shaking until equilibrium, the supernatants were collected by a centrifuge at 3,000 rpm for 20 minutes (Centrifuge 5810R; Eppendorf, New York, NY, USA). The supernatant was treated with nitric acid, and the concentration of total silver was measured using ICP-OES (OPTIMA ICP-OES 7000; Perkin-Elmer, Norwalk, CT, USA). Each experiment was done at least three times. The control experiments were performed in the same manner without soil.
The adsorption coefficient (Kd) was calculated using the linear adsorption isotherm model and Kd value was the ratio between the concentration of the AgNPs in the soil phase ( ) and in the aqueous solution (
 ), when adsorption equilibrium (eq) was reached:
) and in the aqueous solution (), when adsorption equilibrium (eq) was reached:
The results of the adsorption experiments were also analyzed using the Freundlich adsorption isotherm model:

where KF is the Freundlich adsorption coefficient and 1/n is Freundlich exponent.
Results
Aggregation Experiment
Effects of Ionic Strength
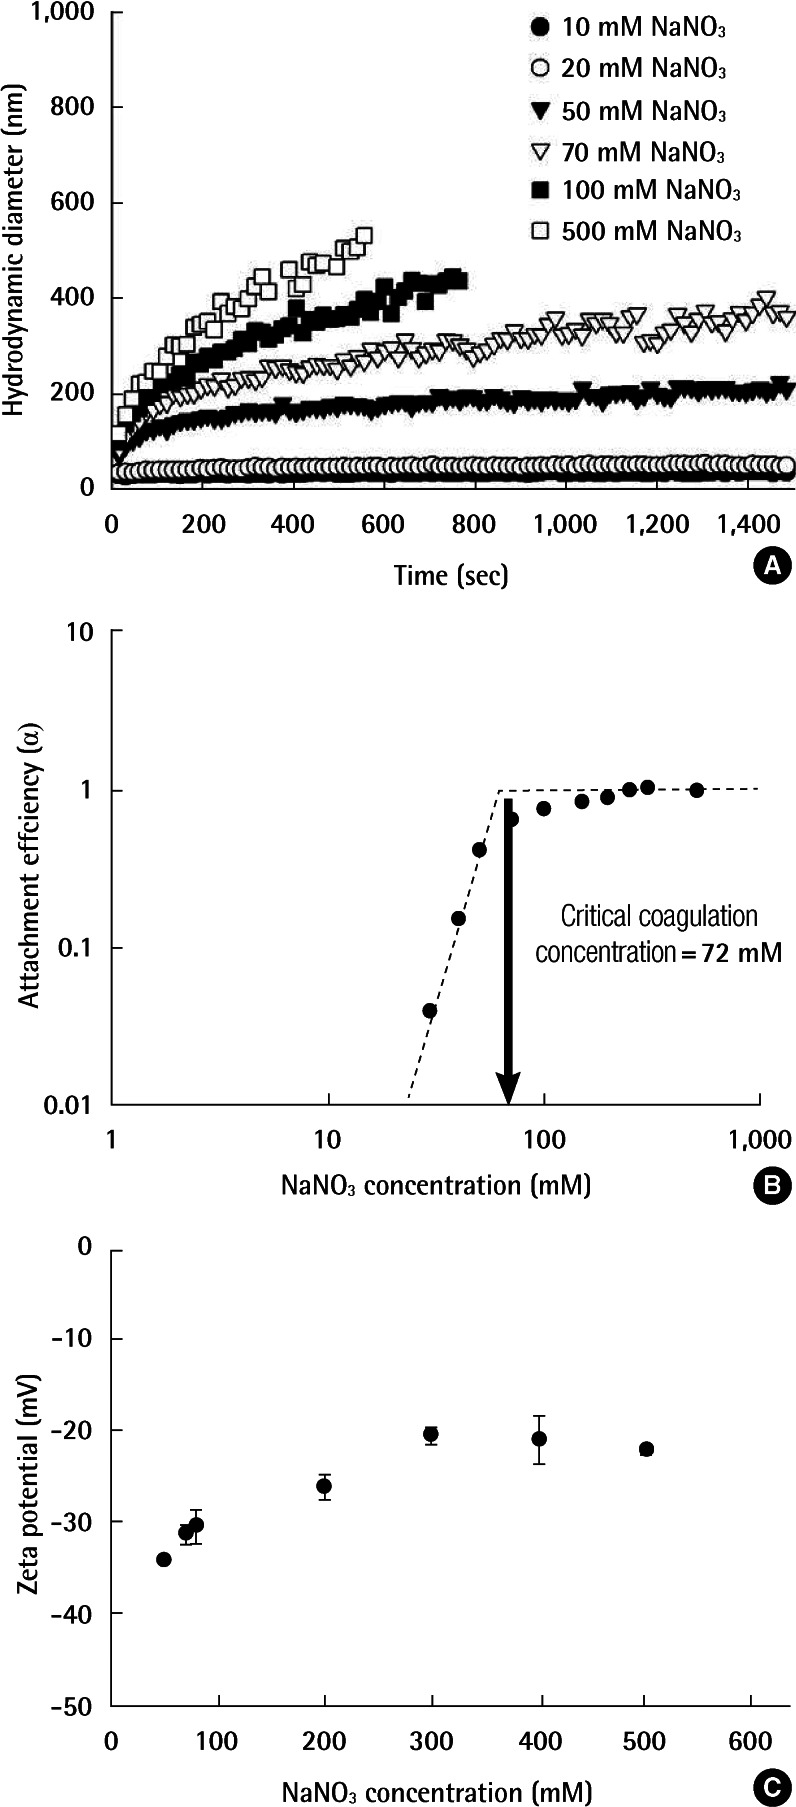
Representative aggregation profiles as measured by TR-DLS at various NaNO3 concentrations are presented in Figure 2A. At NaNO3 concentrations below 20 mM, the size of AgNPs did not change and remained very stable through the measured duration. Above the 20 mM NaNO3, the aggregation rate increased with increasing NaNO3 concentration. At approximately 100 mM NaNO3, the aggregation rate of AgNPs was maximum and further increases in the NaNO3 concentration had no appreciable effect.
The attachment efficiencies (α) at varying NaNO3 concentrations calculated using Equation 2 are shown in Figure 2B. There were two distinct aggregation regimes, which follows the Derjaguin-Landau-Verwey-Overbeek (DLVO) interaction of typical colloidal particles [11,18,24]. According to the DLVO theory, the stability of colloidal particles is determined by the combination of van der Waals attraction and electrostatic repulsion between two particles. As a result, at low ionic strength, the electrostatic repulsion interferes with aggregation (i.e., a reaction-limited regime [α<1]). At high ionic strength, the energy barrier from electrostatic repulsion is completely eliminated. This condition is called a diffusion-limited regime (α=1), and the aggregation rate is maximized without any further dependence on ionic strength. The electrolyte concentration at the boundary between the two regimes is commonly defined as the critical coagulation concentration (CCC) [11]. As shown in Figure 2, the CCC value of AgNPs was 72 mM NaNO3.
The zeta potentials of AgNPs as a function of NaNO3 concentration are illustrated in Figure 2C. AgNPs were negatively charged over the range of NaNO3 concentration studied and the surface charges became less negative with increasing NaNO3 concentration due to charge screening, which are consistent with the aggregation results.
Effects of NOM
To study the effects of NOM on the aggregation behavior, the aggregation kinetics of AgNPs in 50 mM NaNO3 solution were compared in the presence and absence of humic acid (Figure 3A). In the absence of humic acid, AgNPs in 50 mM NaNO3 continued to aggregate; however, in the presence of humic acid (50 mg/L), the size of AgNPs did not change and remained very stable over the experiment period.
The zeta potentials of the AgNPs measured in the presence of humic acid are shown in Figure 3B. As the humic acid concentration increased, the magnitude of negative surface charge increased as well, which is most likely because the negatively charged humic acid binds to the AgNPs. This result was consistent with the increased stability of AgNPs in the presence of humic acid.
Soil Adsorption Experiment
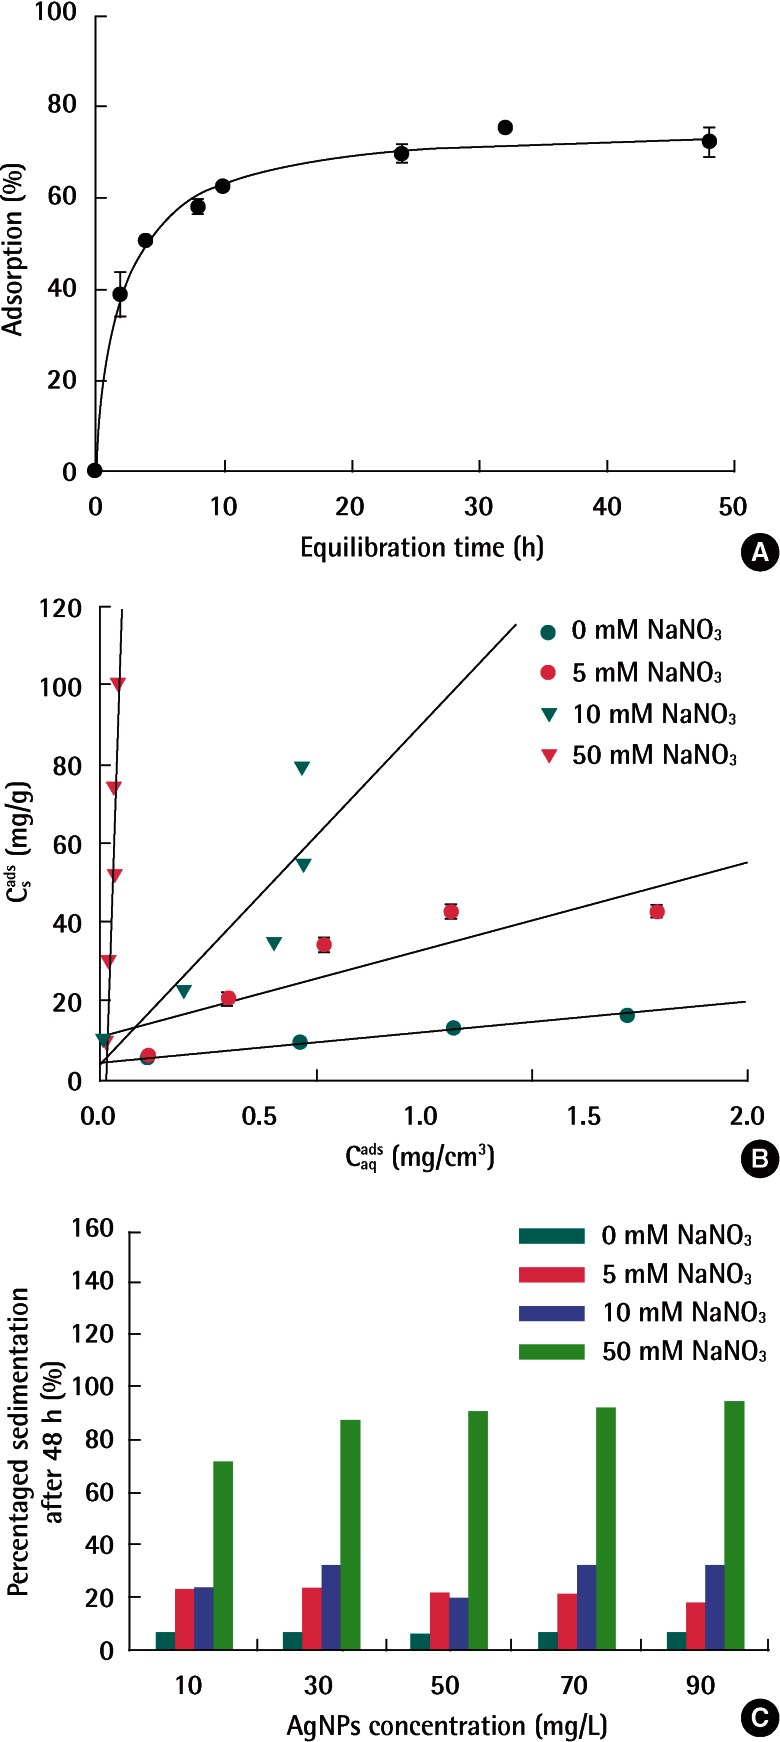
Figure 4A shows the adsorption kinetics of AgNPs (50 mg/L) on soil at 10 mM NaNO3. The adsorption equilibrium was reached in approximately 24 hours. Based upon this, 48 hours contact time was determined as the equilibrium time for adsorption experiments in this study.
Effects of Ionic Strength
In order to minimize the aggregation of AgNPs prior to soil adsorption, the effects of ionic strength on soil adsorption were evaluated in NaNO3 concentrations below 50 mM, a reaction-limited regime in the aggregation tests. Figure 4B presents the adsorption isotherms of AgNPs as a function of NaNO3 concentration. The adsorption of AgNPs on soil increased as the ionic strength increased. The fitted linear and Freundlich isotherm parameters are shown in Table 2. The Freundlich adsorption isotherm appeared to be a better fit than linear adsorption isotherm. Figure 4C shows the control experiments with only AgNPs in NaNO3 solution without soil in order to check the stability of AgNPs in each NaNO3 solution. With increasing the ionic strength, the percentage of AgNPs sedimentation increased as well. In particular, at the highest NaNO3 concentrations (i.e., 50 mM), the amount of the settled AgNPs ranged from 70% to 90% and the settled amount increased depending on the initial concentration of AgNPs. The results are consistent with the results of aggregation experiments, which suggests that adsorption and sedimentation by aggregation took place simultaneously during adsorption tests. In this respect, the corrected adsorption coefficients of AgNPs were also presented by excluding the amount of settled AgNPs obtained from each control experiment in Table 2. Even if we compare the corrected Kd values, it was obvious that the adsorption of AgNPs increased with the ionic strength. The high adsorption with increasing ionic strength can be attributed to their lower negative surface potential.
Effects of NOM
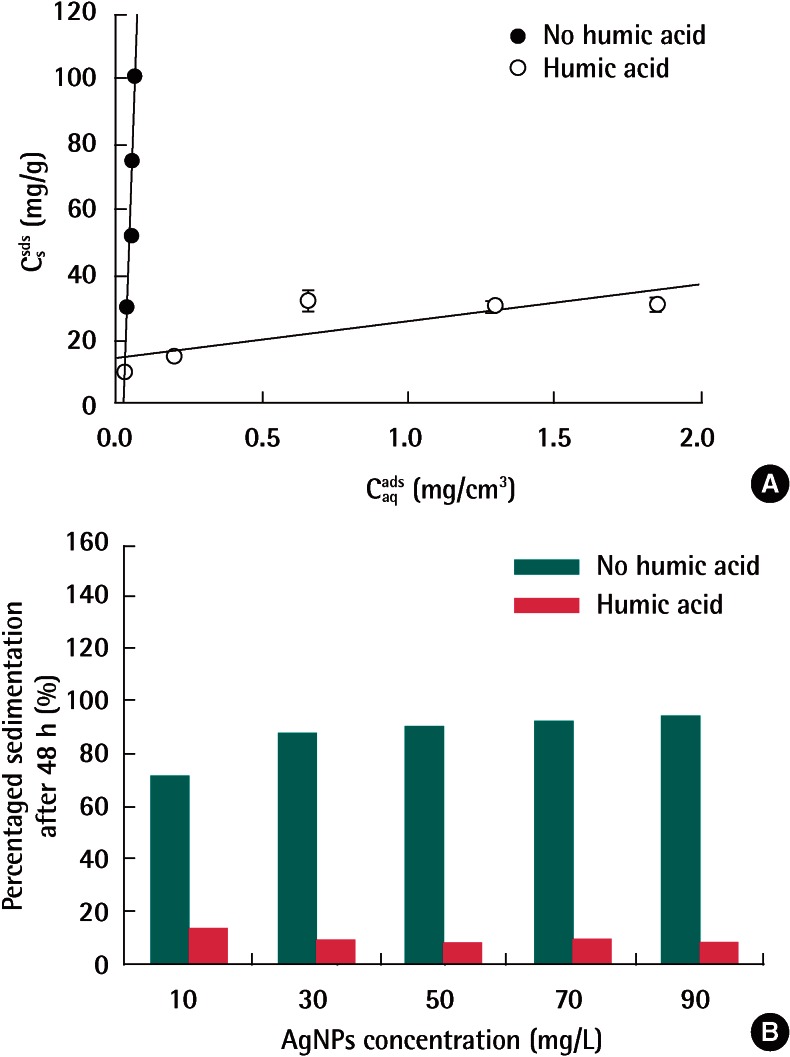
The effects of humic acid on AgNPs adsorption are presented in Figure 5A. The adsorption of AgNPs on soil significantly decreased in the presence of humic acid. For example, the linear Kd decreased from 2400 (without humic acid) to 11 (with humic acid) (Table 2). Figure 5B also shows the control experiments without soil. As consistent with the aggregation experiments, humic acid stabilized AgNPs and thus decreased the sedimentation. As can be seen Figure 3B, the binding of humic acid to AgNPs increased the magnitude of negative surface charge of AgNPs, which increased the electrostatic repulsion between AgNPs particles as well as AgNPs and soil matrix. In addition, the structure of the humic acid bound to the AgNPs surface was known to increase the stability of the particles by steric hindrance [24].
Discussion
The focus of this study was on the effects that environmental variables such as ionic strength and NOM may have on the aggregation and soil adsorption of AgNPs. The results of our experiments showed that both aggregation and soil adsorption increased with increasing ionic strength. The presence of NOM had an opposite effect: both aggregation and soil adsorption decreased in the presence of humic acid.
The results provide a basis for predicting the mobility of AgNPs in the natural environment. When AgNPs are released into the aquatic environment exhibiting high ionic strength, AgNPs will aggregate and accumulate in sediments or soils rather than remain in suspension. Additionally, AgNPs released into NOM-rich environments will likely remain stable in water, and thus exhibit high mobility as compared to environments poor in NOM. The study also provides information necessary for development of test guidelines related to the safety of nanomaterials as well as their environmental risk assessment.