Artificial neural network machine learning prediction of the smoking behavior and health risks perception of Indonesian health professionals
Article information

Abstract
Health professionals (HPs) can play an important role in influencing the smoking behavior of their patients and the implementation of smoke-free workplace policies. In some countries physicians and dentists may not have a no-smoking policy in place. Breathing in other people’s tobacco smoke (second-hand smokers) increase the risk of smoking related diseases. Environmental Tobacco smoke ETS causes a similar range of diseases to active smoking, including various cancers, heart disease, stroke, and respiratory diseases. Little is known about the smoking-related attitudes and clinical practices of HPs in Indonesia. Evidence suggests that high smoking rates remain among male HPs; however, the risk perceptions and attitudes to smoking among Indonesian HPs have not been investigated using prediction model artificial neural networks. For this reason, we developed and validated an artificial neural network (ANN) to identify HPs with smoking behavior. The study population consisted of 240 HPs, including 108 (45%) physicians, and 132 (55%) dentists, with more female (n=159) than male participants (n=81) for both professions. Participants were randomly divided into two sets, the training (192) and test (48) sets. The input variables included gender, profession (doctor or dentist), knowledge regarding smoking-related diseases and awareness of smoking provided to their patients, smoke-free policy in place at their workplace, and smoking status. ANN was constructed with data from the training and selection sets and validated in the test set. The performance of ANN was simultaneously evaluated by discrimination and calibration. After the training, we completed the process using the test dataset with a multilayer perceptron network, determined by 36 input variables. Our results suggested that our final ANN concurrently had good precision (89%), accuracy (81%), sensitivity (85%), and area under the curve (AUC; 70%). ANN can be used as a promising tool for the prediction of smoking status based on health risk perceptions of HPs in Indonesia.
Introduction
In many countries, smoking rates are high among HPs themselves, even when they have a deep influence on their societies [1]. HPs such as physicians, dentists, nurses, midwives, nutritionists, and others are particularly influential in cigarette smoking behaviors such as prevention and cessation [2]. A smoking doctor is worth USD 100,000 to tobacco companies because the bad example they set enables and encourages normal smokers, who perceive that smoking cannot be as dangerous as they have been told [2].
Health advice from physicians and dentists is very important because of their close relationship and frequent contact with patients during consultations. Brief advice (as part of a minimal intervention) by doctors has been shown to significantly increase the chances of quitting (relative risk (RR) 1.66, 95% confidence interval (CI) 1.42–1.94 compared to no advice) [3]. However, in many countries, smoking prevalence is high among HPs, which may create a barrier to providing adequate smoking cessation support [3]. In addition, smoking in workplace results ETS. Passive smokers inhale smoke breathed in and out by smokers, and breath some from burning tips of cigarettes. ETS causes a similar range of diseases to active smoking including cancers, heart disease, stroke and respiratory disease [4, 5].
Risk perceptions concern how individuals think and feel about the risks they face, the subjective judgments about the likelihood of negative or positive occurrences. Risk perceptions are important determinants of protective behavior, it is highly dependent on critical thinking. The human brain can recognize information patterns originating from the five senses, and this ability is obtained through a complex learning process. Artificial neural networks (ANN) are created to digitally mimic this, following the human learning process by imitating the nervous system architecture and then applying it using computer software [6]. They are currently used for complex analyses in various fields, ranging from medicine to engineering, and these networks can be used to design the next generation of computers [6].
ANN has a black box approaching method, meaning that what is happening inside the process cannot be seen clearly from the outside. The data goes into the box and the results come out without us knowing exactly the process that makes it like that. The model is formed by complex mathematical calculus that is difficult to understand: however, this does not prevent the implementation of neural networks in many scientific practices because of their ability to capture the operation characteristics with a good degree of accuracy [7].
The human brain has billions of cells called neurons, these neurons work together to receive stimulation from the five senses, and the brain processes the information input and determines a response reaction [8]. The human brain has approximately 86 billion neurons and a complex neural network, capable of storing enormous information and knowledge on a scale that experts still cannot measure precisely [9].
Each neuron contains three important components, namely the dendrites, the nucleus, and the axon. The dendrites receive stimulation in the form of signals from outside and are sent to the cell nucleus or processing nucleus. The nucleus receives a large number of signals, which will continue to accumulate until reaching a limit, during which the nucleus will produce an output signal that flows through the axon to the tip. At the end of the axon, the signal is chemically processed so that it can reach the next neuron. In the end, the signal will continue to flow through other neurons [10].
Neurons in the human brain network are imitated by ANN in a form called a perceptron. An artificial neuron (referred to as a node in the context of ANN) has a set of data input receiving layers (running as dendrites in a biological network), each of which will be given a certain importance weight for the information received [7, 11].
Mathematically, a perceptron has input data represented by the variable X (can be more than one) and the output function variable Y. Because of their large number, all nodes in the network must be measured following a special structure, the most common is a multi-layer perceptron (MLP), or a percept with many layers, where one layer has several nodes with similar functions. In general, there are three kinds of layers, namely, the input, output, and hidden layers, the latter performs processing between the two [12].
Smoking risk is commonly defined as a multiplicative combination of the probability of a hazardous event occurring, and the severity of the resulting negative consequences (e.g., lung cancer) [13]. Little is known about the smoking-related attitudes and practices of HPs in Indonesia, but available evidence tentatively suggests that there are still high smoking rates among male physicians [14]. Given the important role of HPs in relation to smoking cessation, this study aimed to predict the smoking status of HPs in Indonesia based on their attitudes and clinical practice.
This study aimed to predict Indonesian health professionals smoking status using machine learning (ML) algorithms based on their knowledge and attitudes about the harms of smoking cigarettes, the effects of smoking, and worksite practice.
Materials and Methods
The survey was hosted on Bristol online surveys [15] and included 40 questions that took approximately 10 min to complete. General demographic items covered age, sex, workplace location, occupation (physician or dentist), and smoking status. Health risk perceptions were assessed using questionnaires adapted from the World Health Organization Health Professionals’ Tobacco Survey 2004 [16], with the addition of several questions to gather information about knowledge about and attitudes toward the harms of smoking cigarettes, effects of smoking, and worksite practice.
Study population
Invitations to complete the online survey were sent to 1454 dentists and physicians, members of the Unity Dentist Indonesia and Indonesia Medical Association, from seven different cities/provinces in Indonesia: Jakarta, Bandung, Palembang, Balikpapan, Cirebon, Aceh, and Bali. A total of 240 physicians and dentists responded.
Data preparation
The primary data from 1454 HPs was filtered and duplicates were excluded. During the data transformation step, we identified the outlier’s using visualization and calculation, we chose the cap technique for this data set. We used median imputation for missing data as this is the most appropriate to apply for this type of dataset, we transformed text variables into numerical, scaled datasets, and normalized the variables. The next step was to perform correlation statistics and construct visualization heat maps for each variable to produce histograms and scatter plots. Finally, to see the rank of the feature or variable that produced the best prediction model, we conducted recursive feature elimination (RFE) and obtained 36 features, from which we removed the features that had a very small correlation, as detailed below.
Feature selection
Our dataset had 40 features. Considering that not all features in the model were useful for developing the model as these were irrelevant features, which can considerably decrease the accuracy, we choose features that give us the best prediction model. We conducted feature selection or variable selection. RFE is popular because it is easy to configure and use and because it is effective at selecting those features (columns) in a training dataset that are more or most relevant in predicting the target variable [17]. We used the “scikit-learn” function to conduct the RFE after we dropped the variables that had a low rank and adopted high-rank features, which showed as 1 or true.
Machine learning algorithms
To compare machine learning algorithms, the study population was split into a ‘training’ group, in which the smoking status algorithms was derived, and a ‘test’ dataset was applied and tested. The ‘training’ dataset was derived from a random sampling of 80% of the extracted survey data, and the validation set data comprised the remaining 20%. Artificial Neural Network (ANN) was selected based on the characteristics of the machine learning model and nature of the research questions.
To analyze the data, an MLP was utilized, which is a supervised learning method that requires a label in the training dataset, from which we do iterative training on the data five times. The number of nodes in the input layer depended on the features to be used as input for the model-making. In this study, we had 36 input features implying 36 input nodes. For the output mode, we adjusted to the expected output of the model; in this case, we had non-smoker and smoker or the smoking status of the doctor/dentist. As for the hidden layer, there were no special rules applied, as the amount depends on the complexity of the desired learning process [6]. Therefore, there were no specific rules for determining how many hidden layers we needed. Thus, we repeated the process between incoming signals from outside and the final prediction up to three times to get the best results.
The development of risk algorithms in the training and test datasets was completed using Python 3.7 (Python Software Foundation, Wilmington, DE, USA). The ANN was designed using an MLP Classifier (hidden layer size= 3, maximum iterations = 5).
Ethical approval
The study was approved by the National Institute of Health and Research Development (NIHRD), Ministry of Health, Republic of Indonesia (approval code: LB 02.01/2/KE.165/2017).
Results and Discussion
Results
Participant characteristics
Out of the 240 respondents, 108 (45%) were physicians, and the remaining 132 (55%) were dentists, with more female (n=159) than male participants (n=81) for both professions. Approximately 20% of the physicians and dentists were current smokers: 25 (23.1%) physicians and 22(16.7%) dentists.
In this study, we used a binary classification model in the form of predictions of health professional smoking status based on gender, profession (physician or dentist), their knowledge regarding smoking-related diseases and awareness of their smoking status to their patients. By using these features, we can predict the status of the health professional (smoker or non-smoker). We used a dataset that is sufficiently large to represent dentists from seven major cities in Indonesia, then we normalized the data using scikit-learn, which allows sklearn-preprocessing to normalize the data, referred to as feature scaling. With a mathematical method, we compressed all the features so that they can become uniform in range, which is around zero. We normalized the training and test datasets using our range point of −9 to 3. Then we determined the value of the hidden layer and maximum iteration. It is worth noting that we did not carry out special formulations to determine the number of hidden layers and iterations in this study. Instead, we started with random numbers, three nodes in the hidden layer and five maximum iterations and then used sklearn. The metrics used to output the important statistics of our model. We conducted multilinear regression to understand the correlation between smoking status with the included features and removed those that had very small correlations. The correlation between the smoking status of HPs and included-excluded features after normalization data is shown in Fig.1.
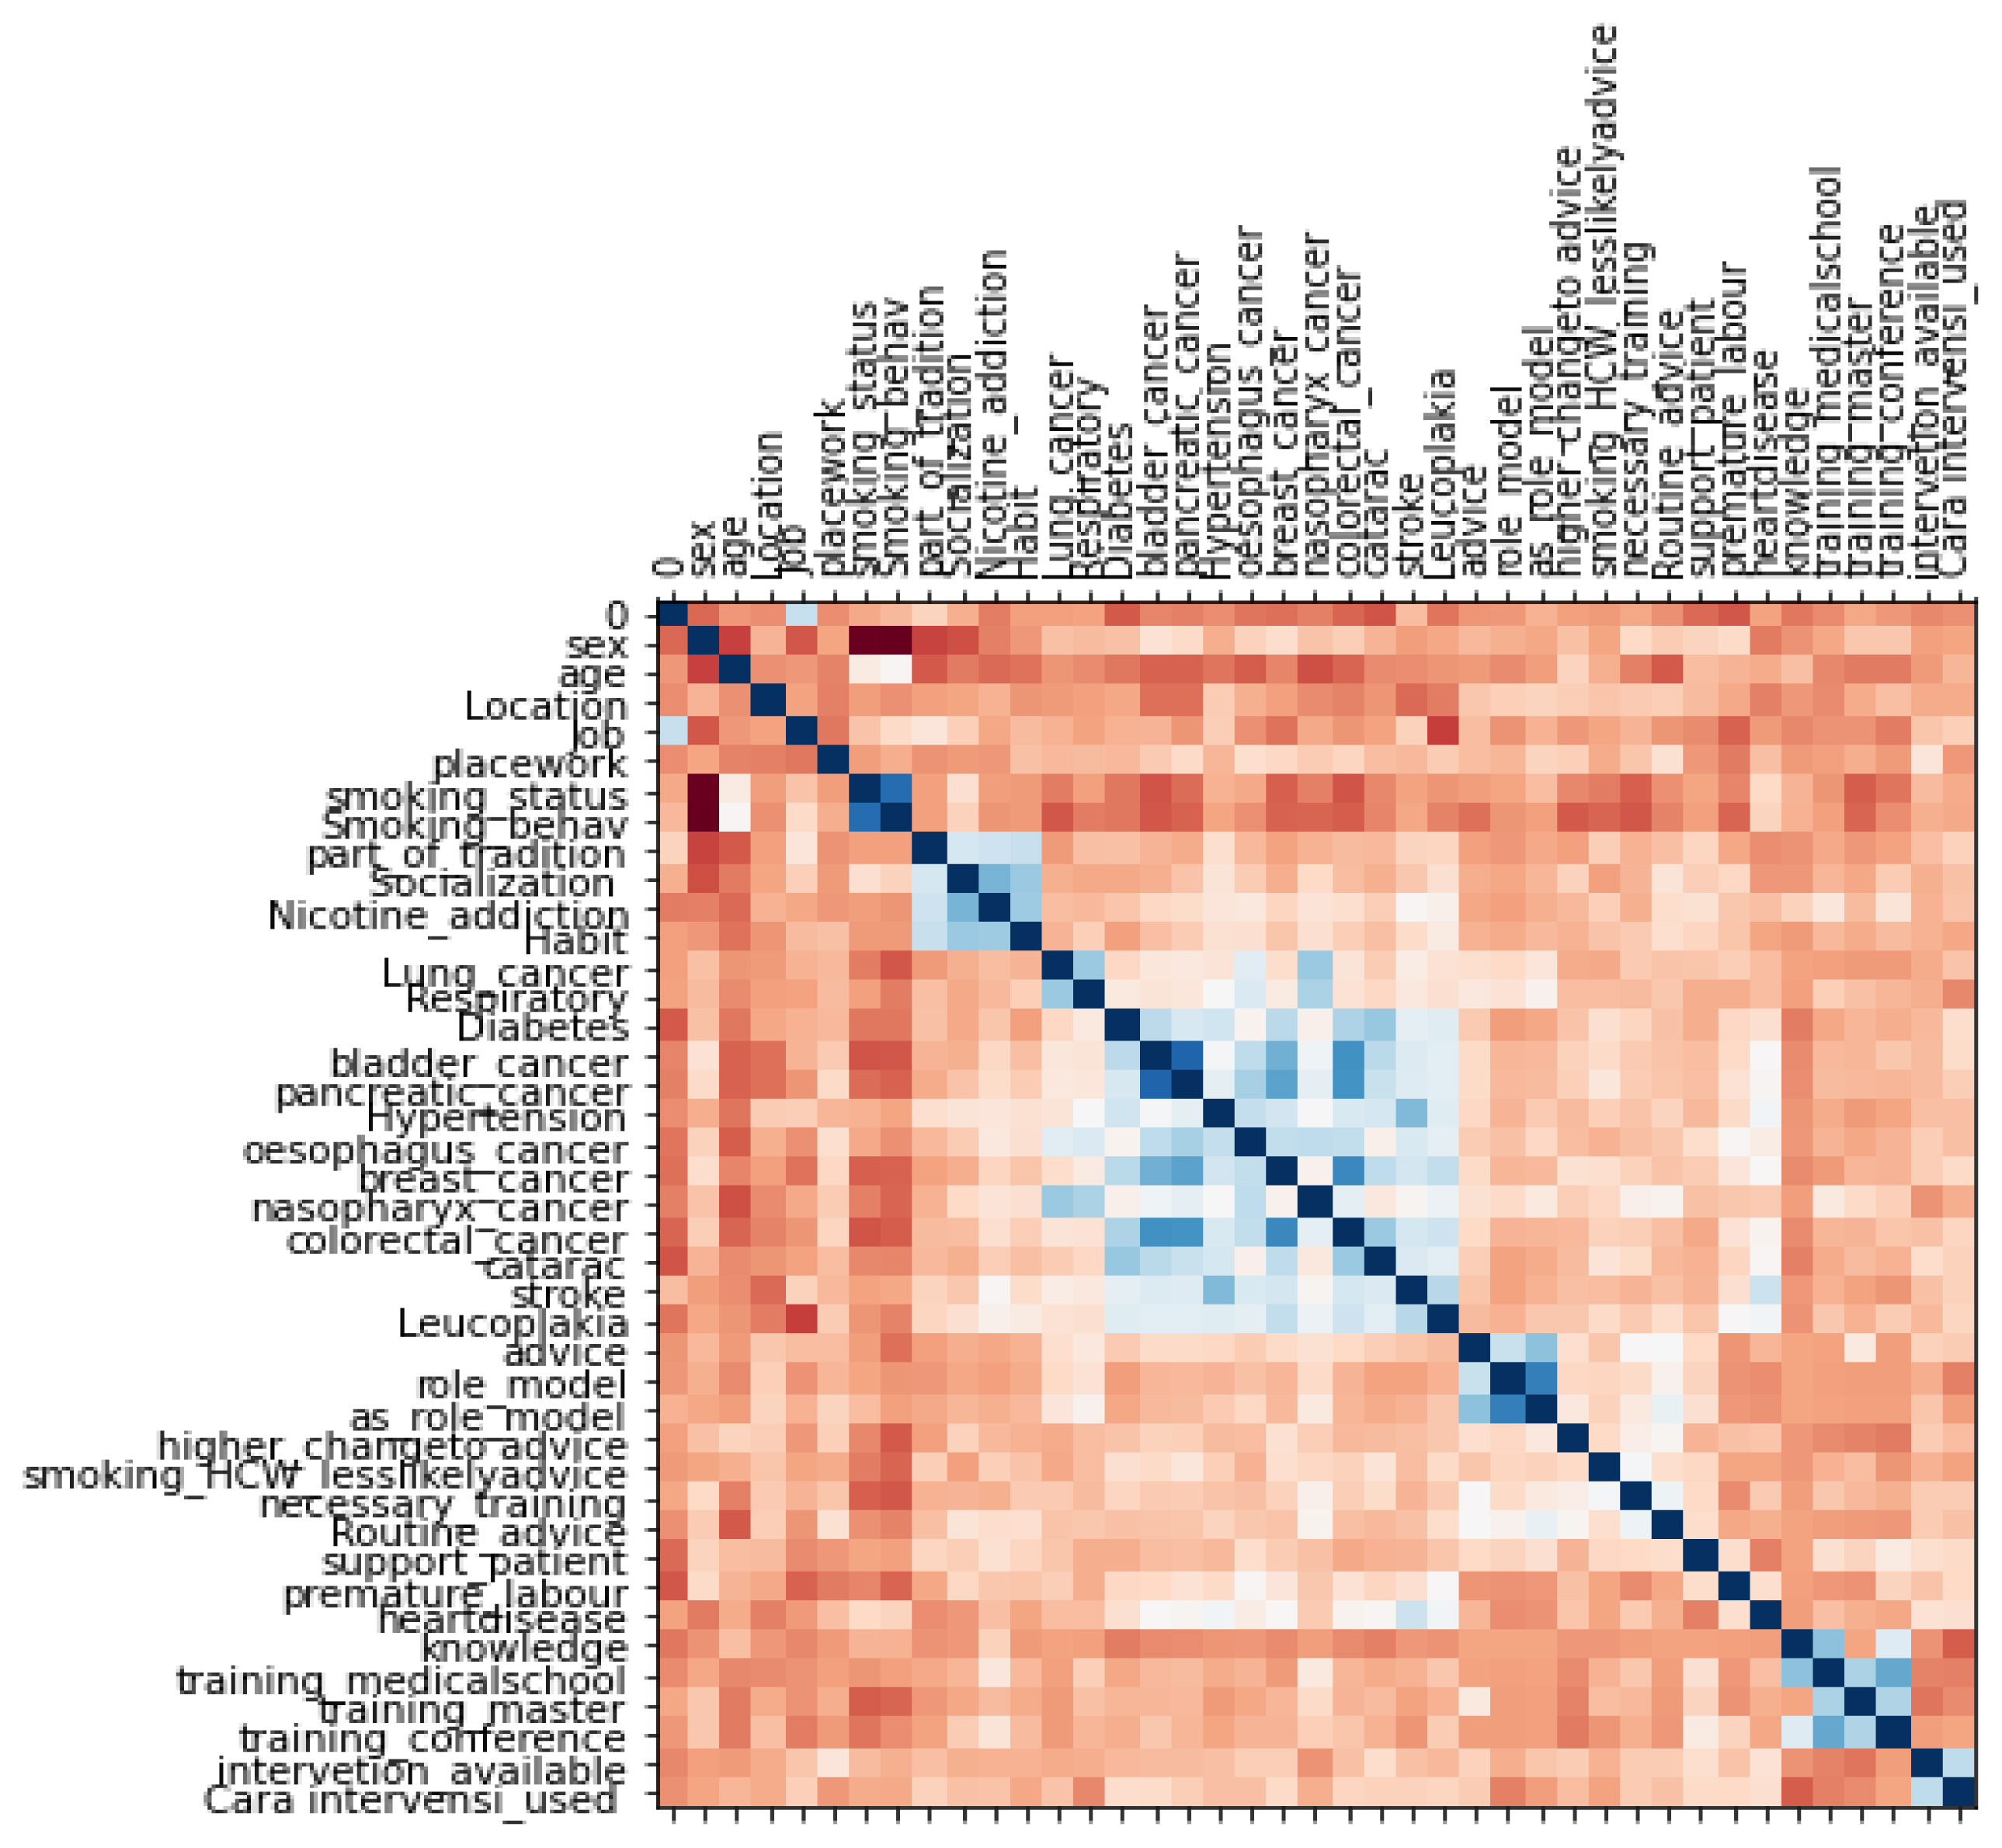
Multilinear regression of smoking status and included-excluded features. Correlation between the smoking status of health professionals (HPs) and the included-excluded features after normalization of the data. The heatmap provides a graphical representation of the correlation matrix with different variables. High correlation is represented as blue and low correlation as dark orange.
Risk factor variables
The 36 risk variables and 1 output variable were used to derive a risk prediction model. Variables were obtained from the survey with guidelines from the World Health Organization Health Professionals’ Tobacco Survey 2004 [16]. Three variables were drop from data set because of having very low ranks (smoking increase risk of pancreatic cancer, smoking increased risk of breast cancer, and doctors and dentist have enough knowledge of smoking cessation).
The nodes input used to predict output (smoking status) are as follows:
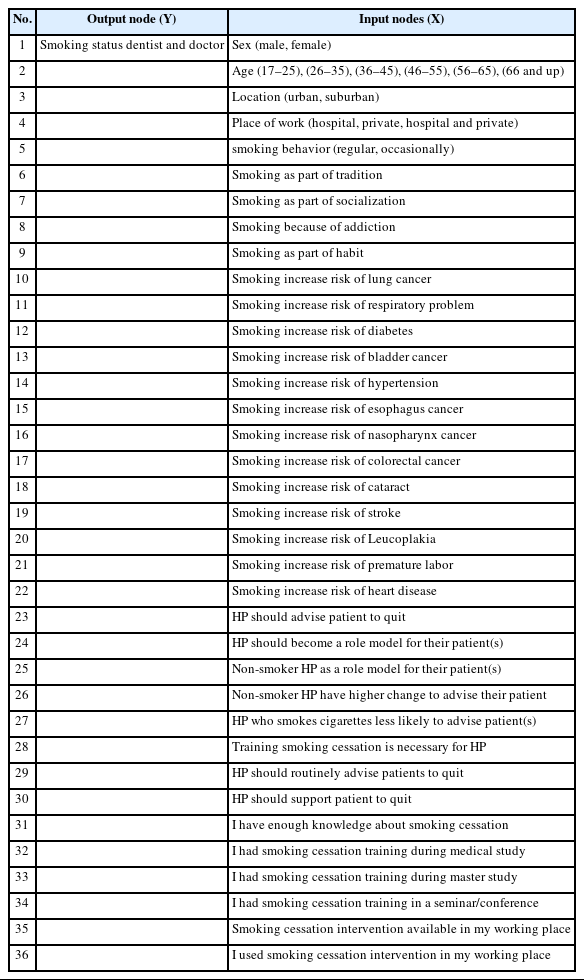
Input and output node

Accuracy of the predicted smokers (1) and non-smokers (2)
As there were some missing values from dataset, we used a common approach to dealing with missing values in machine learning algorithms, namely, the median imputation.
Prediction, sensitivity, and accuracy
We measured the work performance of the model created by measuring the amount of data that were successfully predicted positively compared to all data that were positively predicted, including both true and false positives. In this case, we made predictions of the 36 features and whether after entering the model these features were produced true output in accordance with reality or whether the participant status was smoker or non-smoker.
We also measured the sensitivity or recall of the model; the number that were successfully predicted as positive compared to all positive data. The sensitivity in this study illustrates how many models have missed predicting the smoking status of participants who should have been predicted to be smokers or non-smokers.
In addition to the two above, we also measured the work performance of our model using the under-the-curve area (AUC) c-statistic; a value close to 1 means the model is close to perfect while AUC c-statistic close to 0.5 means not a good model.
We show that the accuracy values for smoking status, smokers (class 1), and non-smokers (class 2) are 0.93 and 0.57, while the accuracy for both smokers and non-smokers output is 0.88. This model is more accurate to predict the smoker status of HPs using smokers as output.
In this study, the performance of the ANN is very good compared to guessing which results are only 50%. Our results demonstrate that our final ANN has good precision (89%), accuracy (81%), sensitivity (85%), and area under curve AUC (70%).
Discussion
In this study, HPS with non-smoking status have a strong correlation to their awareness of smoking as a cause of disease, as well as their awareness toward smoking behavior. Understanding the smoking status of HPs is very important as they have lower support for tobacco control compared to non-smokers, thus will have two negative effects, both for themselves and their patients. Furthermore, HPs that have no smoking regulation in place imply that smoking in the workplace results in costs to patients, non-smoking HPs, and health services due to the environmental tobacco smoke effect [18].
Artificial neural networks seek to simulate the human brain approach for various purposes. In this study we tried to predict the smoking status of health professionals (HPs) based on features related to attitudes and behavior, mimicking biological brain networks that utilize ANN neuron cells using perceptron to get the learning process [6]. In this study, the performance of ANN is good compared to guessing which results are only 50%. Our results suggested that our final ANN concurrently has good precision (89%), accuracy (81%), sensitivity (85%), and area under the curve AUC (70%).
In terms of the characteristics of ANN machine learning, which involves data where the input and output are easy to understand to solve the problem, the relationship between attitudes, knowledge, and behavior of HPs toward their smoking habits is predictable in relation to one another. However, because of the advantage of machine learning, which is better than ordinary statistics due to the nature of machine learning can deeply examine data while including more features; hence, the use of ANN in this study is considered very appropriate.
In this study HPs with a non-smoking status have a strong correlation to their awareness of smoking as a cause of disease, as well as their awareness of smoking behavior. Understanding health professional smoking status is very important as HPs who smoke have lower support for tobacco control compared to non-smokers and will have two negative effects both for themselves and their patients [18].
Strengths
To our knowledge, this is the first investigation applying machine learning to health risks perceptions of HPs regarding the use of cigarettes to the smoking status. The model showed high precision, accuracy, and area sensitivity, demonstrating better prediction of the smoking status of HPs.
Limitations
It is worth noting the limitations of this study. This is a pilot study for which we can develop a deeper and wider analysis in future studies by involving more features and more HP participants.
The limitations of the ANN method is the non-transparent nature or black box method design, therefore we perform multilinear regression analysis and RFE before carrying out the evaluation using ANN machine learning, excluding the features that do not have a significant correlation. Those that had a significant correlation were included in the analysis to get better results.
Conclusions
Understanding smoking status of health professionals (HPs) is very important as those who smoked have a lower support for tobacco control compared to non-smokers. ETS will have negative effects for themselves and their patients, non-smokers who work in the hospital, and the wider community. ANN can be used as a promising tool for the prediction of smoking status based on health risk perceptions of HPs in Indonesia. Our results suggested that our final ANN concurrently have good precision (89%), accuracy (81%), sensitivity (85%), and area under curve AUC (70%).
Acknowledgement
I would like to thank Professor Sarah Lewis and Dr. Tessa Langley who provided valuable insights into this project.
Notes
Authors have no conflict of interest to declare.
CRediT author statement
DN: Conceptualization, Methodology, Writing, Investigation, Software, Formal analysis OO: Original draft preparation, Data Curation, Validation, Review & Editing LH: Project administration, Data curation, Validation, Review & Editing