A 2-day cardiopulmonary exercise test in chronic fatigue syndrome patients who were exposed to humidifier disinfectants
Article information

Abstract
Some survivors of humidifier disinfectants (HDs) complain of chronic, inexplicable fatigue, and post-exertional malaise (PEM). Two-day cardiopulmonary exercise tests (CPETs) performed 24 hours apart (2-day CPET protocol) are increasingly employed to evaluate PEM and related disabilities among individuals with chronic fatigue syndrome (CFS). The purpose of this study was to assess the reproducibility of CPET variables in individuals who had been exposed to HD and to show that 2-day CPET is an objective means of differentiating between fatigue conditions in people with CFS symptoms who have been exposed to HDs. Twenty-nine HD survivors with CFS symptoms were enrolled in this study. To document and assess PEM in CFS, a 2-day CPET was conducted to measure baseline functional capacity (CPET1) and provoke PEM. Twenty-four hours later, a second CPET assessed changes in related variables, focusing on PEM effects on functional capacity. This CPET also measured changes in energy production and physiological function, objectively documenting PEM effects. In the 2-day CPET, the peak oxygen consumption (VO2peak), VO2 at ventilatory threshold (VO2@VT), time to reach VO2peak, and time to reach VO2@VT were significantly decreased (p<0.001). The peak O2 pulse and O2 pulse at VT also decreased significantly (p<0.001). A 6-minute walk test revealed significantly decreased distance (p<0.01). This is the first study to conduct a 2-day consecutive CPET in previously exposed HD participants with CFS symptoms. Our results confirm previous work that demonstrated abnormal responses to PEM in CFS patients. Therefore, a 2-day CPET is an objective measure to differentiate fatigue conditions in people with CFS symptoms who have been exposed to HDs.
Introduction
From 1994 to 2011, humidifier disinfectants (HDs), known to contain various harmful chemicals were used in Korea to prevent microbial growth in humidifier water tanks [1]. Approximately four million people have been exposed to HDs. Following an epidemic outbreak of interstitial lung disease characterized by spontaneous air leakage, rapid progression, and high mortality, HD inhalation was eventually identified as a major respiratory toxicant in 2011 [1,2]. Although fatal lung damage was initially reported, further investigations revealed that the damage was not limited to the lungs; systemic damage also occurred [3,4]. Among individuals with exposure to HDs, although a lung disease was not evident, some complained of chronic fatigue and post-exertional malaise (PEM) compared to healthy individuals. This condition presents a significant challenge for individuals to acquire and maintain employment, including normal activities of daily living.
Chronic fatigue syndrome (CFS) is a multi-system illness that can lead to striking fibrillation. Currently, CFS diagnosis is based on symptom profiling and PEM is a typical symptom [5]. The presence of post-exertion symptoms in CFS suggests that cardiopulmonary exercise testing (CPET) can be adopted to stimulate PEM in CFS patients. A 2-day CPET assesses exercise capacity and recovery through two exercises 24 hours apart. On the first day, CPET is used as a standardized stressor to induce PEM, and individuals with CFS are anticipated to exhibit PEM symptoms, which may interfere with their ability to reproduce the same or better results 24 hours later [6–9]. Precisely, peak oxygen consumption (VO2peak), which indicates aerobic capacity, was not reproducible in the second CPET. It is well documented that VO2peak is highly reliable (test-retest difference ≤7%) and reproducible [10,11]. Thus, CFS patients’ failure to reproduce VO2peak within the well-established normative variation of ≤7% indicates the effects of PEM on physical activity tolerance and physical function. To date, a few studies have used a 2-day CPET protocol to reveal abnormal exercise responses, including assessments of VO2peak and other CPET variables in CFS patients [6–9,12–15]. Based on previous 2-day CPET studies in CFS patients, we hypothesized that individuals who had been exposed to HD with CFS would fail to reproduce normal physiological indices during a second CPET. Therefore, the purpose of this study was to assess the reproducibility of CPET variables in individuals who had been exposed to HD and to show that 2-day CPET is an objective means of differentiating between fatigue conditions in people with CFS symptoms who have been exposed to HDs.
Methods
Participants
Twenty-nine participants with a history of HD exposure and reported CFS symptoms were recruited from specialist clinics and support groups in South Korea. All participants were aged 18–65 years. CFS was diagnosed based on the Fukuda criteria [16]. For the 2-day CPET, participants whose cardiovascular status was determined to be “high-risk” were excluded, based on official guidelines for cardiovascular disease risk assessment [17]. Participants with comorbidities or orthopedic limitations that would affect their ability to complete a maximum treadmill test were excluded. The experimental procedures were approved by the Inha University Hospital Research Ethics Committee (IRB No: INHA 2021-04-029) and all participants provided written informed consent.
Procedures
Participants were instructed to rest well before performing the first CPET, which measured their baseline parameters. A second CPET was performed 24 hours after the first to measure the individual’s response to exercise in the post-exertional state. It was performed using a modified Bruce protocol on a treadmill. All participants were given frequent verbal encouragements during the test to elicit maximal effort [18]. Ratings of perceived exertion (RPE) were recorded during the exercise test using Borg’s 6–20 RPE scale [19]. The ventilatory threshold (VT) is the exercise intensity at which metabolism begins to switch from aerobic to anaerobic energy expenditure. The ventilatory or anaerobic threshold was identified from the expired gases using the V-slope method [20]. Oxygen consumption at the ventilatory threshold (VO2@VT), VO2peak, and other physiological variables were measured during both CPETs. The times required to reach VO2peak and VO2@VT were also recorded. Heart rate was monitored (Polar, Finland) and blood pressure was measured every 3 min. The participants were informed that the CPET would be terminated whenever they decided to stop. Other termination criteria, regardless of participant decision, were an excessive increase in systolic blood pressure (≥250 mmHg), ≥2 mm ST-segment depression, or significant ventricular ectopy.
The six-minute walk test (6MWT) was performed indoors, along a long, flat, straight corridor by a trained technician according to the American Thoracic Society guidelines [21].
Statistical analysis
Patient characteristics and continuous data are summarized as mean±standard deviation. Physiological and work variables at maximum and VT intensities were compared between CPETs using paired t-tests for VO2, heart rate, and minute ventilation (Ve), and between variables derived from these measures. Statistical significance was set at p<0.05. All analyses were performed using IBM SPSS Statistics version 20.
Results and Discussion
Nineteen male and 10 female HD survivors participated in this study. The participants’ age range was 22–62 years, with a mean age of 35.93±3.04 years and body-mass index (BMI) of 24.82±0.78 (Table 1).
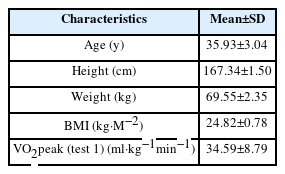
Participant’s characteristics N=29 (mean±SD).
The test-retest changes in physiological and work variables are shown in Table 2. It represents significant differences in certain parameters between Test-1 and Test-2 (p<0.001 or p<0.05). For instance, VO2peak decreased from 34.59
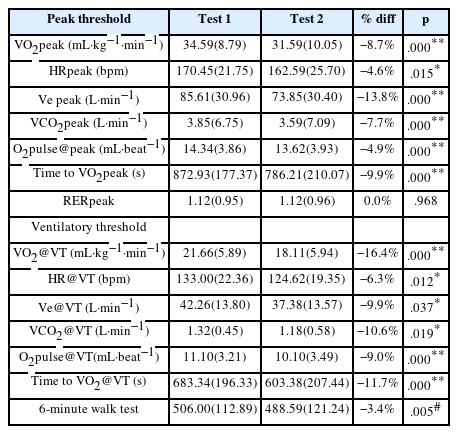
Physiological and work variables for test 1 and 2 at peak and ventilatory threshold (VT) intensities, N=29 (mean±SD).
To ensure that the peak exercise data reflect the maximal effort, participants must achieve valid indicators of maximal effort. The maximal effort is indicated by a respiratory exchange ratio (RER) ≥1.1 [17]. In this study, the RER at maximal effort (RERpeak) was ≥1.1 and did not differ between tests, indicating that the participants’ effort was very strong during both CPETs. All measures at maximal intensity decreased in Test-2, including VO2peak, HRpeak, peak minute ventilation (Ve peak), and peak CO2 production (VCO2peak). O2pulse@peak, a surrogate indicator of cardiac output, was derived as VO2/HR. Similar to the values of the VO2peak and HRpeak, the O2pulse@peak value also decreased, indicating reduced oxygen delivery in Test-2. Similarly, at the ventilatory threshold intensity, all variables decreased during Test-2. The results of the 6 MWT showed decreased distance on the second day from 506.00s to 488.59s (Table 2).
Consistent with previous research, [6–9,12–15] participants with CFS were unable to reproduce their Test-1 physiological and work variables in Test-2. The decreased Test-2 variables could be used diagnostically as an objective indicator of an abnormal post-exertion response and, possibly, even as a biomarker for the condition [7].
To date, a few studies have demonstrated an abnormal post-exertional response in the 2-day CPET variables in patients with CFS [6–9,12–15]; however, they are not consistent regarding which physiological variables fail to change in CFS patients between the two tests. Most likely, the test-retest changes in VO2peak and VO2@VT that we observed were consistently reported to decrease in patients in the majority of previous studies wherein the 2-day CPET was conducted [6–9,12–15], although the magnitude of VO2peak and VO2@VT decrement varied between these studies. The test-retest VO2peak and VO2@VT decrements in this study were considerably greater than the <7% variability, which has been reported consistently in healthy individuals [10,11]. Our data revealed a substantial decrease of 16.4% in the test-retest VO2@VT. This is consistent with the results of previous studies by VanNess et al. [6] (~26%), Keller et al. [9] (~16%), and Van Campen et al. [12,13] (~22%). Because our examination was performed on a treadmill using a modified Bruce protocol rather than a cycler ergometer as in previous studies, the slight difference could be attributed to the different test methods.
VO2@VT is an important index of the ability to perform continuous work, as activity levels above the ventilatory or anaerobic threshold cause rapid, unsustainable fatigue. The anaerobic threshold corresponds to the exercise intensity level at which anaerobic energy generation is sufficient to cause a non-linear decrease in the muscle and blood pH, and an increase in lactate and carbon dioxide concentrations [22]. The ventilatory stimulus of carbon dioxide in expired ventilation causes a response similar to that of blood lactate. In this study, a reduction in VO2@VT over serial exercise tests indicated an underlying limitation in the exercise capacity to meet daily energy demands via aerobic energy production.
In some previous studies, the workload measured at VT decreased; however, in this study, we could not measure the workload because we used a treadmill rather than a cycle ergometer. Nevertheless, the results of our study are meaningful because this is the first study to analyze a 2-day CPET protocol using a treadmill.
Oxidative stress and membrane-disrupting actions of polyhexamethylene guanidine phosphate (PHMG-p), which is one of the main toxic components in HDs, have been detected in smooth muscle cells, nerve tissues, and peripheral blood mononuclear cells [23–25]. Considering the spread of harmful chemicals of HDs from the lungs to the entire body, the toxic effects of PHMG-p are mainly attributable to mitochondrial dysfunction in various cell types [24,25]. Although the detailed mechanisms and etiology underlying CFS remain unclear, some evidence suggests that metabolic dysfunction caused by mitochondrial abnormalities could play a role [26–28]. Though we didn’t evaluate the mechanism of CFS in this study, mitochondrial dysfunction which was provoked by toxic materials in HDs could be a possible cause of CFS symptoms. Larger studies to evaluate the mechanism of CFS in HDs survivors are warranted.
In this study, we measured the time required to reach VO2peak and VO2@VT. They were significantly lower in Test-2 than those in Test-1. The decrements may be due to the impaired exercise capacity and consequent early attainment of the post-exertional anaerobic threshold in patients with CFS. To the best of our knowledge, this is the first study to assess the time to reach these parameters; thus, further studies with a larger sample size are warranted to evaluate its significance. The probable mechanism for these phenomena could be explained by an allegedly impaired oxidative phosphorylation and a defect in mitochondria which allows early reach of the lactic acid threshold or anaerobic threshold during CPET [26–29].
We also observed a statistically significant test-retest decrease in peak O2 pulse of 4.9%, indicating a compromised oxygen delivery in CFS participants following PEM induction. O2 pulse, a surrogate measure for stroke volume and arteriovenous oxygen content difference, is an important index of cardiac function [30]. It is also a stable and reproducible measure over time in young athletes [31] and adult non-athletes [32]. Previous studies by Vermeulen et al. [8] and Keller et al. [9] found a significant decrease in maximal O2pulse and O2pulse at VT in patients with CFS. Additionally, they reported a lower arteriovenous oxygen content difference (determined non-invasively based on VO2 and cardiac output) and attributed these findings to lower muscular O2 extraction during exercise in CFS [33]. While it is unknown how alterations in oxygen delivery/utilization occur during a subsequent CPET in CFS patients, these results do suggest that the decrease in maximal O2pulse may partly explain the mitochondrial abnormalities suspected in CFS.
The 2015 report, prepared by the National Academy of Medicine, indicates that the 2-day CPET protocol can be used as an objective method to evaluate decreased function in patients with CFS [34]. Although the 2-day CPET protocol is not required for CFS diagnosis [11–13], it is regarded as an objective means of determining abnormal PEM and it possibly acts as a biomarker for CFS conditions [7].
The present study had several limitations. First, we did not include a group of sedentary controls for comparison. Second, a larger sample size should have been recruited for a more robust statistical analysis. Third, many participants experienced a relapse of fatigue because of exercise testing; therefore, in some patients with CFS, a 2-day CPET might cause a long-lasting relapse in symptoms, which may be unethical. Fourth, further biomechanical studies are warranted to elucidate the mechanisms underlying CFS.
This is the first study to conduct a 2-day consecutive CPET in participants who have been exposed to HDs with CFS symptoms. The results of this study confirm a 2-day CPET is a valid means of differentiating between fatigue conditions in people with CFS symptoms who have been exposed to HDs.
Acknowledgement
This study was supported by the Inha university research grant. This study was supported by the Ministry of Education of the Republic of Korea and the National Research Foundation of Korea (NRF-2019S1A5C2A03082727).
Notes
Disclosure
All authors have no potential conflicts of interest to disclose.
CRediT author statement
JHL: Conceptualization, Methodology, Writing - Review & Editing; HN: Data Curation, Investigation; HEJ: Formal analysis; KLJ: Funding acquisition; HCK: Software; KLJ: Validation, Visualization, Writing-Original draft Preparation, Writing-Review & Editing.