Use of DNA adduct and histopathological defects as indications for bio-persistence potency of zinc oxide nanoparticles in gastropod, Monacha cartusiana (Mǜller) after short-term exposure
Article information

Abstract
The cytotoxic effects of metallic nanoparticles (MNPs) might be revealed in genomic and histopathological defects. Therefore current study aimed to assess the bio-persistence and adverse effects potency of zinc oxide nanoparticles (ZnONPs) in the gastropod, Monacha cartusiana. Gastropods were exposed to 74 μg/mL for 14 d then the DNA adduct and histopathological defect profiles were assessed. The results demonstrated significant decline in the estimated genomic template stability (GTS%) in haemolymph and digestive gland ranging from 10.0 to 42.9% in treated animals compared to controls. In the treated and recovered snails, randomly amplified polymorphic (RAPD)-DNA showed the appearance and/or disappearance of DNA bands, indicating DNA damage due to the cytotoxicity of ZnONPs on gastropods. Significant defects in microvilli (MV), nucleus (N), mitochondria (M), and execratory glands (EXG) were noticed in the treated individuals with respect to controls. The remaining live animals were subjected to a recovery period (14 d, without treatment) and slight recovery profiles were reported for both measures compared to the control group. The recovery pattern was recognized in the nucleus/cytoplasm ratio with 0.186 and 0.428 in the treated and recovered groups concerning their control (0.176). The studied parameters reported herein might be reliable tools to assess accumulation and bio-persistence patterns of NPs in the organisms for short-term exposure indicating the cytotoxic and genotoxic effects. Also, gastropods may provide simple models for evaluating the ecotoxicological effects of nanomaterials.
Introduction
Nanotechnology has attained an exceptional position, especially in biotechnology, which has an unlimited character to support life superiority [1]. Metallic nanoparticles (MNPs), such as zinc oxide nanoparticles (ZnONPs), are useful in a variety of agricultural (pesticide manufacturing and antimicrobial agents), industrial, and medical applications (including sun protection creams and ointments to treat skin disorders and bioimaging [2–6]. Moreover, NMs could interfere with the aquatic ecosystems triggering a prospective risk to the aquatic creatures. As a result, legalizing the safe limits of NMs for both occupational and environmental models is crucial. Also, it is vital to develop effective and sensitive analytical methods for the environmental monitoring of NMs [7,8]. A diversity of bioindicators might be used to study the potential toxicity of NMs. For example, ZnONPs showed ecotoxicological effects on zooplankton [9], phytoplankton [10], amphibians [11], fish [12], reptiles [13], mammals [14,15], snails [16] and plants [17]. Specifically, the exposure of guppy (Poecilia reticulata) to zinc sulfate (at 10, 50, and 100 μg/L) and ZnONPs increased DNA damage after 48 h and antioxidant enzymes after 21 d, suggesting that NMs including the ZnNPs' have genotoxic impacts [18]. It could incidentally stimulate oxidative damage through the production of reactive oxygen species (ROS).
Oxidative stress (OXS) is a useful indicator for determining the ecotoxicity of ZnONPs against various organisms [21–23]. The OXS is the primary mechanism proposed to illustrate NM's toxicity [24]. ROS levels in haemocytes have been used to quantify OXS in terrestrial environments [25] and marine [26]. Additionally, the generation of ROS might induce DNA breakage [27], protein carbonylation [28], lipid peroxidation [26,29], reaction with oxidative organelles, e.g., mitochondria [30], and apoptosis [31].
The genotoxicity was evaluated by examining variations in DNA profiles independent of band shifts and intensity [32,33] and the gain and loss of bands [34,35]. According to several studies, DNA fingerprints could be used as a functional biomarker assay in toxicology. Therefore, several aquatic and terrestrial models were employed to screen xenobiotic toxicity, owing to their ability to bioaccumulate metals, adapt to numerous environments, and ease of rearing in diverse climatic conditions. Similarly, the gastropods were used as biomarkers for DNA damage. Genotoxicity and cytotoxicity were induced by different substances including NMs (ZnNPs) in different species of gastropods, e.g., Nerita chanaeleon [36], Morula granulata [37], Lymnaea luteola [38], and M. cartusiana [39]. Consequently, it was an excellent bioindicator class [40]. Therefore, the current study aimed to look at DNA adducts and histopathological changes in the land snail (M. cartusiana) caused by short-term exposure to sub-lethal levels of ZnONPs.
Materials and Methods
Preparation of zinc oxide nanoparticles (ZnONPs)
The ZnONPs were produced in an alcoholic medium through the condensation and hydrolysis of zinc acetate dehydrates at low-temperature conditions by potassium hydroxide. The precipitate was formed and distributed in a combination of methanol and chloroform, cleaned with deionized water, and dried at 100 °C for 15 min [41].
Characterization of ZnONPs
The size and shape of ZnO powder's aliquot deposited on a copper grid were investigated using the JOEL Scanning Electron Microscopy (SEM, JSM5300). To determine the purity of the prepared NPs, an X-ray Oxford detector unit (model 6647, England) was used in conjunction with the SEM (JOEL, JSM5300) and Oxford detector unit of X-ray (model 6647, England). A double beam UV-VIS spectrophotometer (HEIλOS α v 4.6 Serial No 111518 Thermo Spectronic) was used to analyze the ZnONPs suspension's optical absorption at room temperature in the range of 200 to 800 nm.
Experimental design
Examined land snail
The snail, M. cartusiana (Müller), was chosen as the subject of the experiments. Healthy individuals weighing 2.5 ±0.7 g were obtained from Delta Egypt's clover farms. Every 100 individuals were kept in an aerated wooden cage with dimensions of 40×40×40 cm for 14 d under laboratory conditions (25±2 °C; 12:12 h light/dark and 63±2% relative humidity). Animals were fed leaves of lettuce ad libitum.
Toxicity test
The animals were categorized into three replicates, each of 20 individuals. As a control group, land snails were fed lettuce leaves (toxicant free). Treated animals were fed lettuce leaves that were soaked in 74 μg/mL for two weeks, representing 0.1 of the LC50 value reported by Abdel-Halim et al. [16]. They were monitored daily. Some of the living animals were collected for toxicological analyses. A 40 mm needle connected with a sterilized 10 mL syringe was cautiously inserted below the shell from the hemocoel beside the right side of the skull to collect the haemolymph. The fluid was collected in anticoagulant vials and kept at −20 °C until it was analyzed. The digestive glands were separated from the animals and kept at −20 °C until being analyzed.
Recovery experiment
Following the toxicity experiment, the live animals have nourished with lettuce leaves (toxicant-free) for 14 d and animals were monitored daily. Then samples were taken in the manner above-mentioned.
Fragmentation of DNA
Extraction of DNA
A 50 mg of the digestive glands or 100 μL of the haemolymph fluid were aliquoted and mixed with 940 μL of lysis buffer [100 mM EDTA, pH 8.0; 200 mM Tris-HCl, pH 8.0; 250 mM NaCl), 30 μl proteinase K (10 mg/mL) and 30 μL 20% SDS]. In a water bath, the contents were kept at 48 °C for 45–50 min. Phenol, chloroform, and isoamyl were added with a ratio of 25:24:1 (v/v), gently inverted for 10 min and centrifuged at 9200×g for 10 min. Supernatants were transferred into new 1.5 mL Eppendorf tubes. After that, DNA was precipitated by adding equivalent volumes of isopropanol to 0.2 volume of 10 M ammonium acetate, tenderly inverting several times, and centrifuging at 13200 g for 10 min. The pellet was quickly cleaned in 500 μL of 70% ethanol, air-dried, and re-suspended in 200 μL of sterilized water/TE buffer [42].
The purity factor (A260/A280 nm) was quantified spectrophotometrically after assuring the complete solubility of DNA. Its reliability was confirmed by loading 10 μL of the prepared DNA (2 μL extracted DNA, 2 μL dye, and 6 μL sterilized water) on a 0.7 percent agarose gel and staining with ethidium bromide and the quantity and quality compared to 0.2 μL of DNA standard marker.
ISSR conditions and preparations
The PCR amplification was performed using six Inter Simple Sequence Repeats (ISSRs) primers to differentiate and fingerprint six samples: (1) control haemolymph, (2) control tissue, (3) treatment haemolymph, (4) treatment tissue, (5) recovered individuals' haemolymph, and (6) recovered individual tissue (Table 1). A total volume (25 μL) was used for the amplification, including 2 μL DNA, 2 μL primer, 2.5 μL 10X buffer, 2.5 μL MgCl2 (50 mM), 2.5 μL dNTPs (4 mM), and 0.2 μL (5 units/μL) Taq DNA polymerase (Promega Germany). It was carried out using an automated thermal cycler with the following PCR conditions: one cycle at 94 °C for 5 min, followed by 40 cycles [1 min at 94 °C, 75 seconds of temperature annealing for each primer as itemized in Table 1 and 2 min at 72 °C], and finally a final extension for 10 min at 72 °C. Gel electrophoresis in a 1 percent (w/v) agarose gel in TBE buffer at 120 V for 30 min separated the PCR products. The bands were then noticed with ethidium bromide staining and photographed with a gel documentation system (Bio-Rad Gel Doc., 2000).
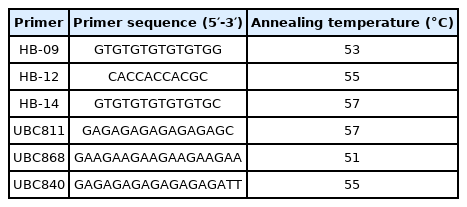
List of used ISSR primers, their sequences, and annealing temperatures.
Treatments' phylogenetic relationships
To calculate the pairwise difference matrix among the treatments, the Gene-Profiler-Eval computer application was performed to record variations in separated bands with each primer of ISSRs markers. Nei Li's coefficient, which is included in the Multivariate Statistical Package (MVSP) Version 3.1 computer program, was used to perform genetic comparisons based on ISSR fingerprints among treatments. The Unweighted Pair Group Method with Arithmetic Means (UPGMA) used Nei Li's similarity coefficient to cluster the data matrix [43].
Genomic template stability
The following formula was used to estimate genomic template stability (GTS percent):
where; a represents the average number of polymorphic bands discovered in each treated sample and n represents the total number of bands in control. Compared to the control profile, polymorphism in the RAPD profile comprises the disappearance of a regular band and the introduction of a new band [44].
Examination of the ultrastructure
The individuals from both treatments and control groups were dissected, and the digestive glands were taken. Small fragments were fixed as quickly as possible with 2 mL of 2.5% glutaraldehyde diluted in 0.1 M phosphate buffer, pH 7.2, and kept at 4 °C until the analysis. The fixed tissues were rinsed in a phosphate buffer solution of 0.1 M, pH 7.2. After that, it was washed with buffer for 2 min before being submerged in 1% osmium tetraoxide (OsO4) for 1–2 h at 4 °C. The samples were dehydrated for 5 min with an increasing concentration of acetone (25, 50, 75, and 100%). The tissues were infiltrated with propylene oxide after being dehydrated in 100% acetone. The specimen was embedded in Epon Araldite for 48 h at room temperature. Capsulated samples were sectioned at 20–30 nm thickness using an Ultratome machine. The sections were obtained on metal mesh (grids) and stained with toluidine blue for orientation. The grids were dyed for 5 min with 4% uranyl acetate and then rinsed with pure water. After rinsing, the grids were stained for 5 min with 1% lead acetate, rinsed again in water, and stored in a grid box until they were examined [45]. The grids were viewed using a Transmission Electron Microscope (TEM) (JOEL 1400 Plus, Japan) to understand the cell changes. As necessary, a sequence of bright–field imaging was used.
Statistical analysis
All data were presented as mean ± standard deviation (SD), underwent analysis of variance (ANOVA), and means were assessed to significance using the least significant difference (LSD) method at a probability of 0.05 [46]. Furthermore, according to the fisher distribution, line regression with * and ** is significant with 5% and 1% probability levels for DNA gel pictures, respectively (Statist XL v 2.1, 2003). The principal component analysis (PCA) was used to examine multilinear regression between ZnONPs-treated and recovered snails and DNA fingerprints in the haemolymph and digestive tract [47]. To determine the diversity of histopathological investigation between treatments and the control, box plot graph analysis was made using SPSS-Version 16.
Results
Nanoparticles characterization
The UV-VIS absorbance showed an absorption band at nearly 360 nm (Figure 1a). The ZnONPs exhibited nearly spherical shapes with sizes ranging from 22 to 45 nm (Figure 1b). In addition, the elemental analysis using EDA pattern was plotted in Figure 1c exhibited domination of Zn (96.0%) of the total content of minerals in the sample.

Characterized patterns of ZnONPs: (a) UV-VIS spectrum of ZnONPs suspension; (b) SEM image at 35.000X; (c) XAD pattern of ZN ions percent in the prepared NPs.
Genomic DNA diversity
Different profiles were obtained when the genomic DNA of M. cartusiana animals that were exposed to 74 μg/mL of ZnONPs (Figure 2). These profiles among genetic diversities of M. cartusiana were noticed using Nei Li's coefficient embedded in the MVSP program, where a pairwise difference matrix was stated (Figure 3). Six primers were employed to amplify genomic DNA successfully. The RAPD fingerprints with varied bands ranging from 200 to 1000 bp were obtained, regulated by the state of treated and recovered animals and the used primer.
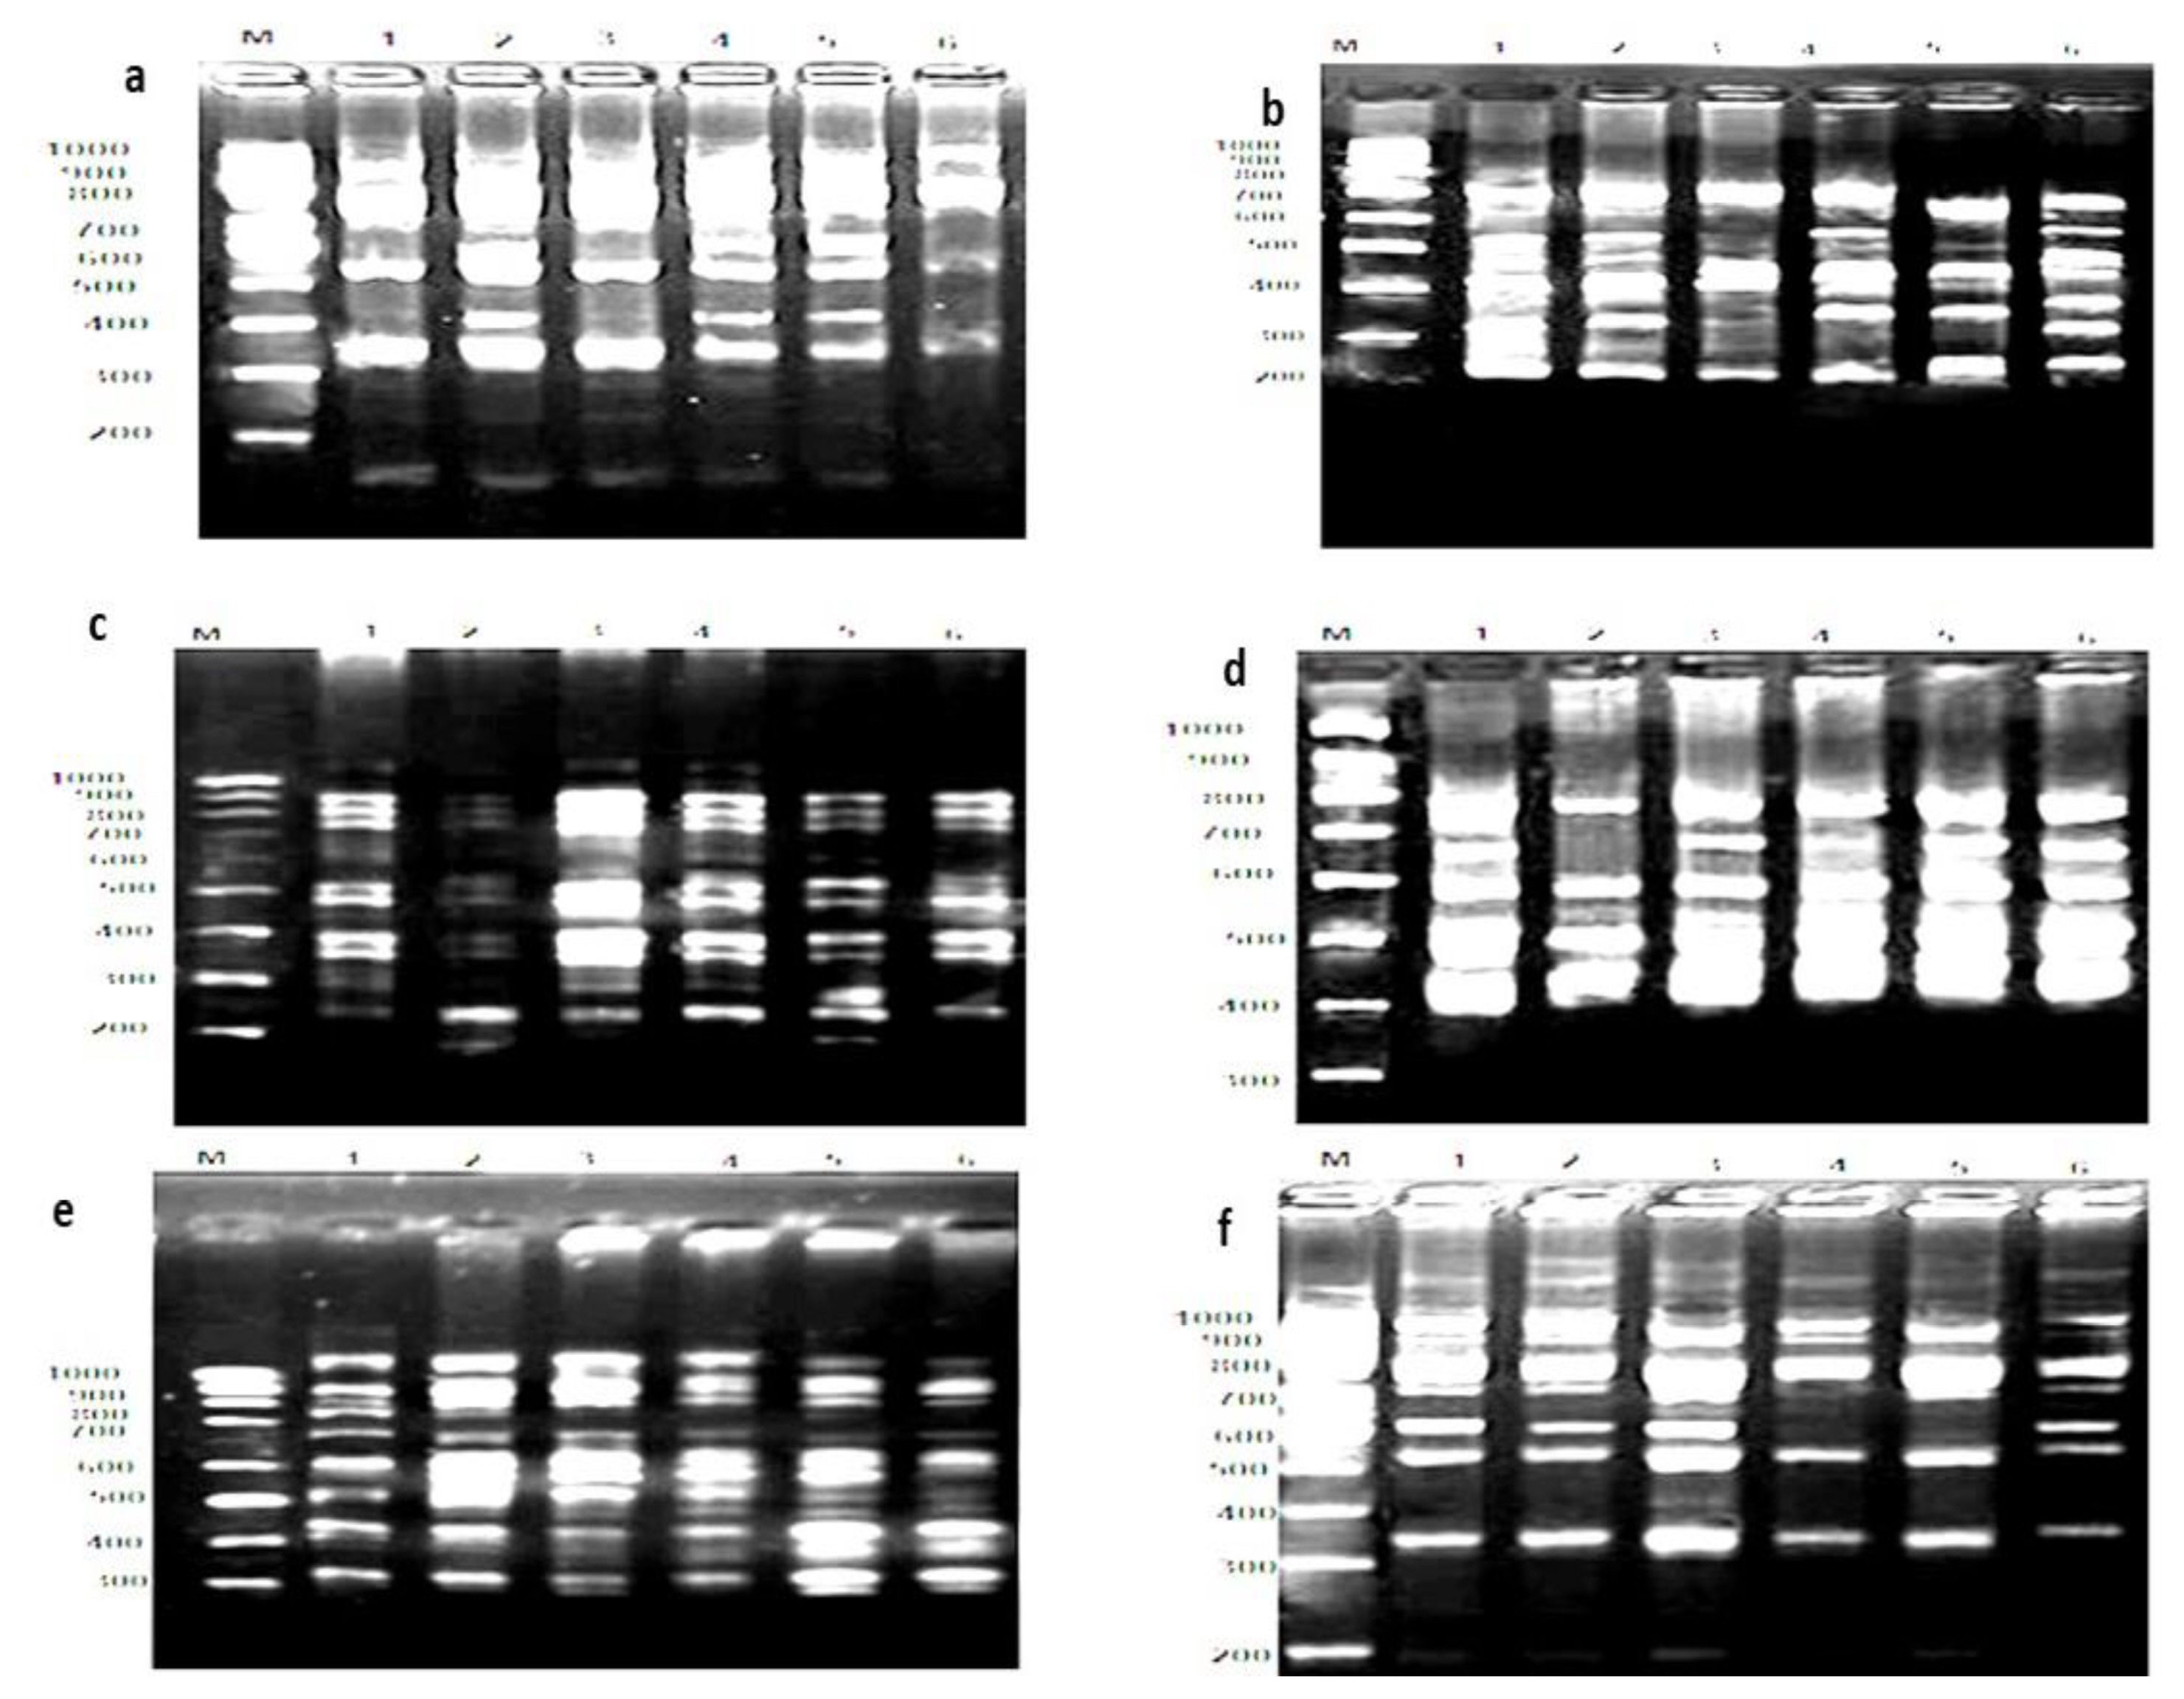
Agarose gel electrophoresis of poly chain reaction (RAPD-PCR) products using primers: (a) HB-14; (b) HB-09; (c) HB-12; (d) UBC811; (e) UBC868, (f) UBC840 to amplify snail, Monacha cartusiana (Mǖller): Lan (M) DNA ladder, (1) control haemo., (2) control digestive glands, (3) treatment haemo., (4) treatment digestive glands, (5) recovered haemo., and (6) recovered digestive glands after treatment of ZnONPs (74 μg/mL) for 14 d, following by recovery for the same time.
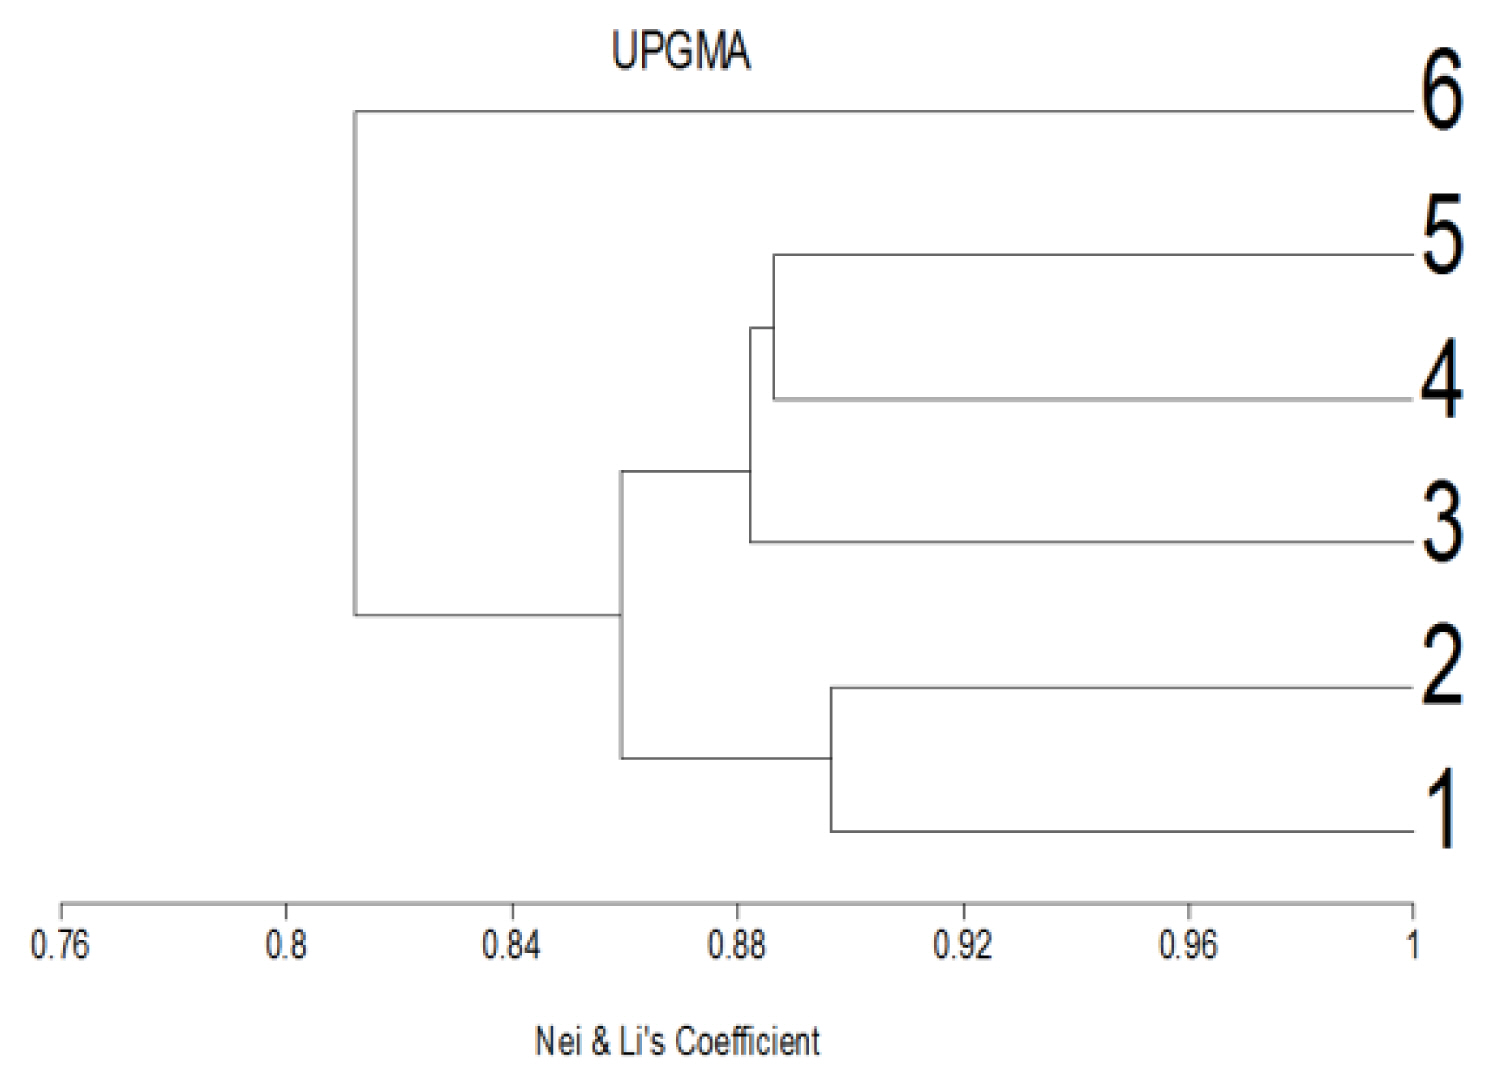
Variation among genetic diversities among snail, Monacha cartusiana (Mǖller) exposed to ZnONPs using similarities coefficients and dendrogram tree.
The results in Figure 4 show the relationship between treated haemolymph and digestive g. with recovery ratios. It was found that recovered haemolymph positively high associated with treated haemolymph and partially associated with treated digestive g. In the same way, recovered digestive g. positively associated with treated digestive gland. The HB-14 primer produced 5–6 bands with sizes ranging from 300 to 1000 bp (Figure 2a) with significant declined GST 20.0% (r2=0.796*) (p<0.05) for the treated haemolymph and increased to the same value in the recovered individuals (r2=−1.377*), respect to control (Figure 4). Also, it was declined to 14.3% for the treated digestive glands (r2=0.185) and significantly declined to 42.9% for the recovered individuals (r2=0.957*). In case of the primer HB-09, the number of bands ranged from 5 to 7 bands with sizes from 200 to 700 bp in the digestive glands and haemolymph samples with GST values 50.0 (r2=0.818*) and 25.0% (r2=0.413) in haemolymph and 28.0 (r2=0.55*) and 00.0% in digestive glands for the treatment and recovery, respectively (Figure 2b). The increased pattern was recognized in the generated bands for primer HB-12. The number of bands ranged from 8–10 with sizes ranging from 200 to 1000 bp (Figure 2c) with GST values 12.5 (r2=0.407) and 25.0% (r2=0.521*) greater than haemolymph's of control animals. HB-12 declined to 11.1% (r2=0.167) for the treatment of digestive glands, followed by increased GST in the recovered individuals.
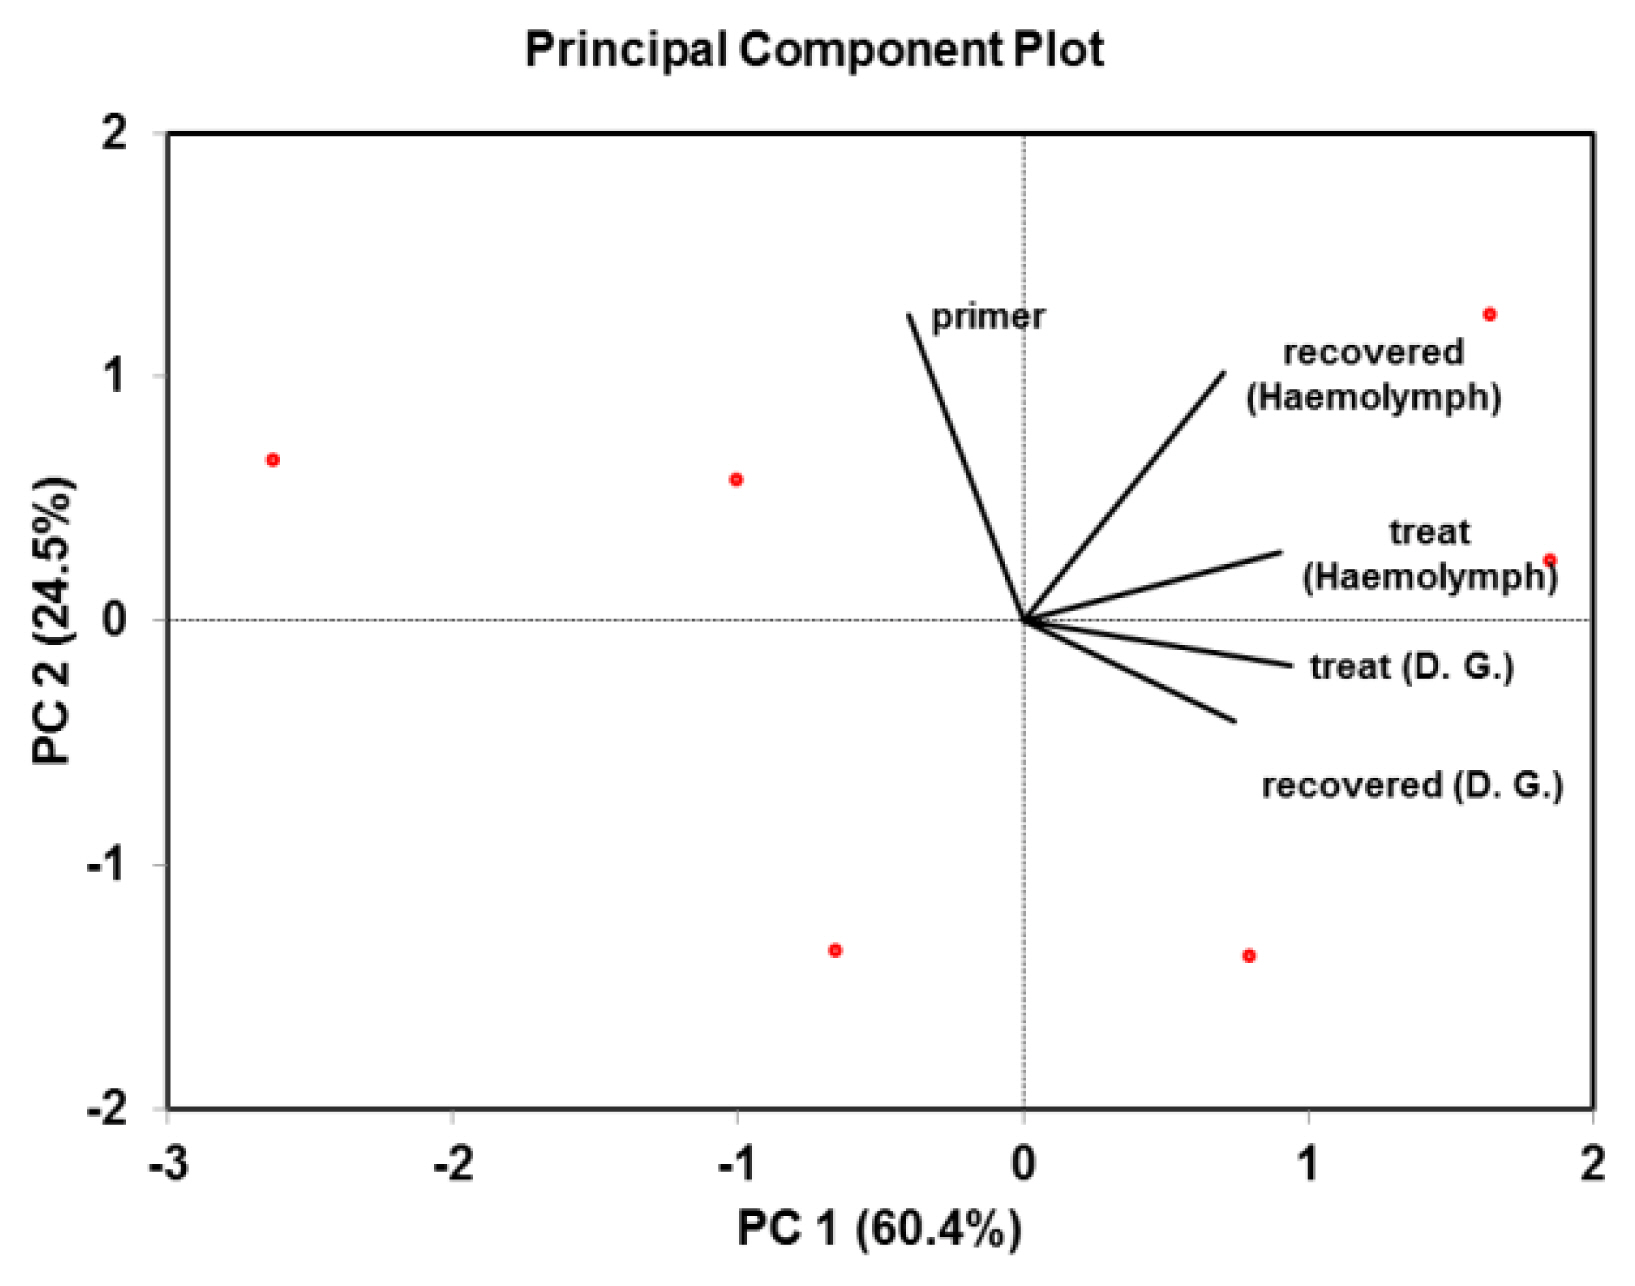
Correlation matrix of ZnONPs-treated and recovered snail, Monacha cartusiana (Mǖller) and their DNA fingerprints generated from RAPD-PCR. Linear correlation between these variables was obtained after Pearson's test (p<0.05).
The primer UBC811 revealed a slight generation of bands. The number of bands was 4–7 bands in the size of 400–800 bp (Figure 2d) with increased GST% (16.6%) (r2= −0.266) compared to control in haemolymph and a significant decline to 40.0% in the digestive glands (r2= 0.655*), respect to control. However, significant abundant bands were generated with the primer UBC868 (Figure 2e). The number of bands was 10–12 in size of 300–1000 bp, with GST having values similar in haemolymph and increased in the recovered animals to 10.0% (r2=−0.107). Also, the GST value increased to 10.0% in the treated digestive glands and declined to a steady state (0 level) in the recovered samples. Finally, slight generation was obtained using the primer UBC840, resulting in the range of 5–7 bands with sizes of 300–1000 bp (Figure 2f). Declines in GST% were conducted in the treated and recovered haemolymph with 28.6% (r2=−0.240) but increased to 33.4% (r2=0.663*) in the treated and recovered digestive glands.
The calculated similarity coefficient among groups of individuals ranged from 0.76 to 0.89 (Figure 3). The greatest value (0.89) was observed in the control's haemolymph and digestive glands samples and between the digestive glands of the control and its treatment. A similar finding with a value (0.88) was recorded between the treatment for both haemolymph and digestive gland, with respect to the recovered haemolymph, and between the treated haemolymph and digestive g. (0.88). The least value (0.76) was noticed between the treated digestive gland and its recovered counterpart sample.
Ultrastructural investigations
The electron microscope images of the digestive gland sections from control snails (untreated) showed a firm structure of the organ at 4000X (Figures 5A and 6A). It was noticed that the completed microvilli (MV) had a regular brush border and surface area of 13.27 μm2. The cells were characterized by the nucleus (N) with a regular nuclear membrane, mitochondria (M), execratory vacuoles (EXV), execratory gland (EXG), digestive cells (DC), Golgi bodies (G), and smooth endoplasmic reticulum (SER). However, in the tissue of ZnONPs-treated snail (74.0 μg/mL) (Figures 5B and 6B) at the same magnification, it was noticed a disturbed brush border of MV arising surface area with a mean value of 2.96 μm2 (4.49-folds) lower than the control. Also, ZnONPs caused a destructed cell membrane, rough endoplasmic reticulum (RER), destructed and irregular execratory glands (EXG), execratory vacuoles (EXV), nucleus (N) containing eccentric nuclei (Nu), migrated and aggregated chromatin, irregular and dilated nuclear membrane, and vacuoles (V). On the other hand, sections of the digestive glands of the recovered individuals for 14 d displayed a regular brush border of MV with a mean surface area of 7.66 μm2, representing 1.73-folds of the control sections at the same magnification power (Figures 5C and 6C). It was noticed significant forming of digestive cells (DC), regular cellular membranes with diluted intercellular spaces, mitochondria (M), smooth endoplasmic reticulum (SER), numerous shapes of the nucleus (N), concentric chromatin, lipid droplets (L), and slight firming of Golgi bodies (G) (Figure 6C).

Electron micrographs illustrate [A] section of digestive g. of control snail, Monacha cartusiana (Mǜller). It was noticed that completed microvilli (MV) with regular tubules, extensively distributed mitochondria (M), Golgi bodies (G), smooth endoplasmic reticulum (SER) and execratory cells (EXC) (head arrow); [B] section in digestive gland of ZnONPs-treated snail, H. aspersa for 14 d. It was noticed disturbed brush border of microvilli (MV), lack of mitochondria (M), irregular nuclear membrane (head arrow), nucleus (N), irregular execratory gland (EXG), and execratory vacuoles (EXV), and [C] section in digestive glands of recovered snail for 14 d after treatment with ZnONPs for the same period. It was noticed recovered regular brush border of microvilli (MV), mitochondria (M), digestive cells (DC) (head arrow), execratory gland (EXG), execratory vacuoles (EXV), smooth endoplasmic reticulum (SER), and Golgi bodies (G) [Glutaraldehyde-OsO4 fixed uranyl acetate lead citrate-stained preparation 4000X].

Electron micrographs illustrate [A] section of digestive glands (control) of snail, Monacha cartusiana (Mǜller) showing nucleus (N), regular nuclear membrane (head arrow), mitochondria (M), execratory vacuoles (EXV), execratory gland (EXG) (arrow), digestive cells (DC) and Golgi bodies (G); [B] section in digestive gland of ZnONPs-treated snail, H. aspersa for 14 d showing destructed cell membrane (arrow), rough endoplasmic reticulum (RER), destructed and irregular execratory glands (EXG), execratory vacuoles (EXV), eccentric nuclei (Nu) with irregular and dilated nuclear membrane (head arrow), nucleus (N) and vacuoles (V) and [C] section in digestive gland of recovered individuals for 14 d showing significant forming of digestive cells (DC) (head arrow), regular cellular membranes (arrow), diluted intercellular spaces, mitochondria (M), smooth endoplasmic reticulum (SER), Nemours shapes of nucleus (N) with irregular nuclear membrane, lipid droplets (L) and slight Golgi bodies (G) [Glutaraldehyde-OsO4 fixed uranyl acetate lead citrate stained preparation 4000X].
In magnified sections at 10000X, normal mitochondria (M) with lamellar cristae, Golgi bodies (G), and smooth endoplasmic reticulum (SER) were noticed in the control section (Figure 7A). In ZnONPs-treated snails, NPs accumulation in the lysosome was noticed. Also, a lack of mitochondria (M) and rough endoplasmic reticulum (SER) were identified (Figure 7B). On the other hand, the sections of the digestive glands of the recovered individuals showed mitochondria (M) forming with concentric cristae and disrupted mitochondrial membrane. Nucleus (N) with migration and chromatin aggregation is likely to be detectable in the nucleus (Figure 7C).
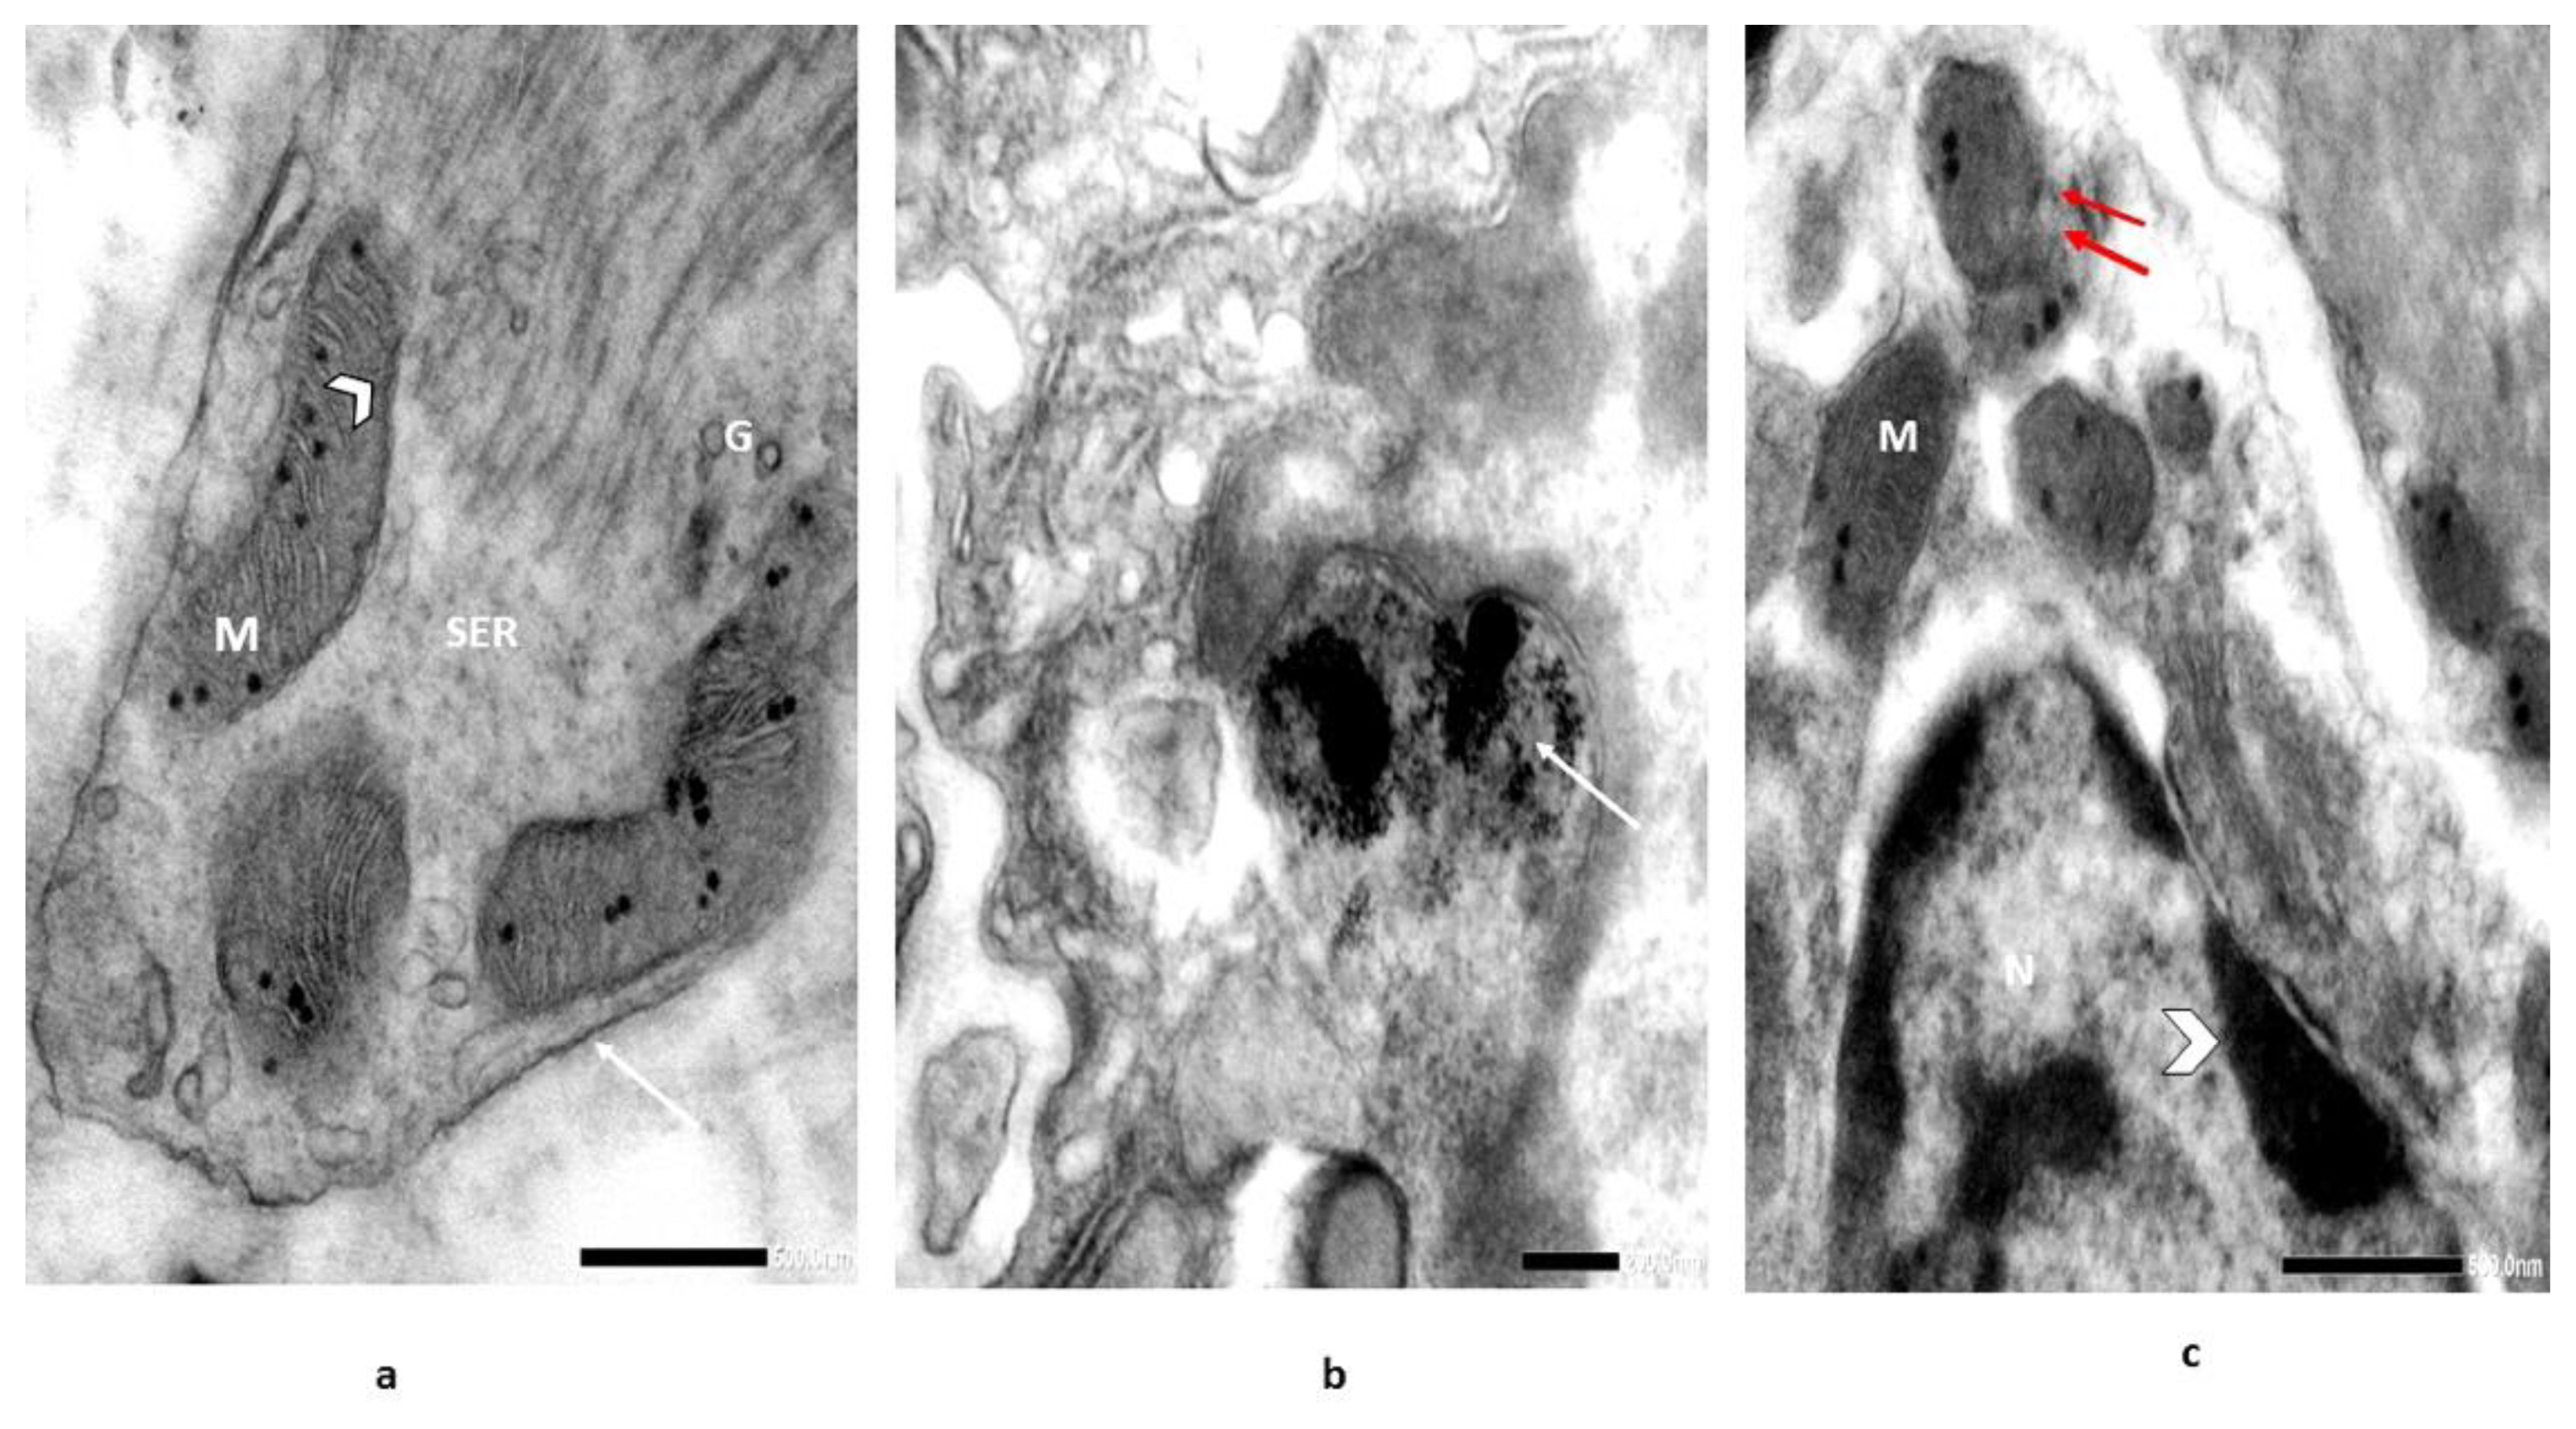
Electron micrographs illustrate [A] section of digestive g. of snail, Monacha cartusiana (Mǜller) (control) showing normal mitochondria (M) with lamellar cristae (head arrow), smooth endoplasmic reticulum (SER), cell wall (arrow), and Golgi bodies (G); [B] magnified field to obtain NPs precipitation in the lysosome (arrow), lack of mitochondria (M) and rough endoplasmic reticulum (RER), and [C] section in the digestive gland of recovered individuals showing forming of mitochondria (M) with concentric cristae and disrupted mitochondrial membranes (double arrow) and nucleus (N) with migration & aggregation of chromatin is likely to be detectable in the nucleus (head arrow) [Glutaraldehyde-OsO4 fixed uranyl acetate lead citrate stained preparation 10000X].
The mitochondrial defects in the treated snails appeared as a slight decrease in surface area (mean; 0.161 μm2) (0.95-folds) compared to control. A significant decrease in the surface area of mitochondria of recovered individuals was noticed (mean; 0.107 μm2) (1.43-folds) (Figure 8). Also, the integrated density of mitochondria declined with 2.86-folds in the treated group, followed by 3.21-folds in the recovered one, with respect to their controls. A similar pattern was noticed in the mitochondria/cytoplasm ratio, where the treated individuals exhibited significant declines (0.0121), followed by (0.0127) in the recovered ones. On the other hand, a significant increase in surface area of the nucleus (N) with a mean of 2.333 μm2 (4.11-folds) was noticed compared to control. The recovered individuals exhibited the mean surface area value of the nucleus of 3.489 μm2 (6.14-folds). The same pattern was recognized in the nucleus/cytoplasm ratio with values of 0.186 and 0.428 in the treated and recovered groups with respect to their control (0.176).
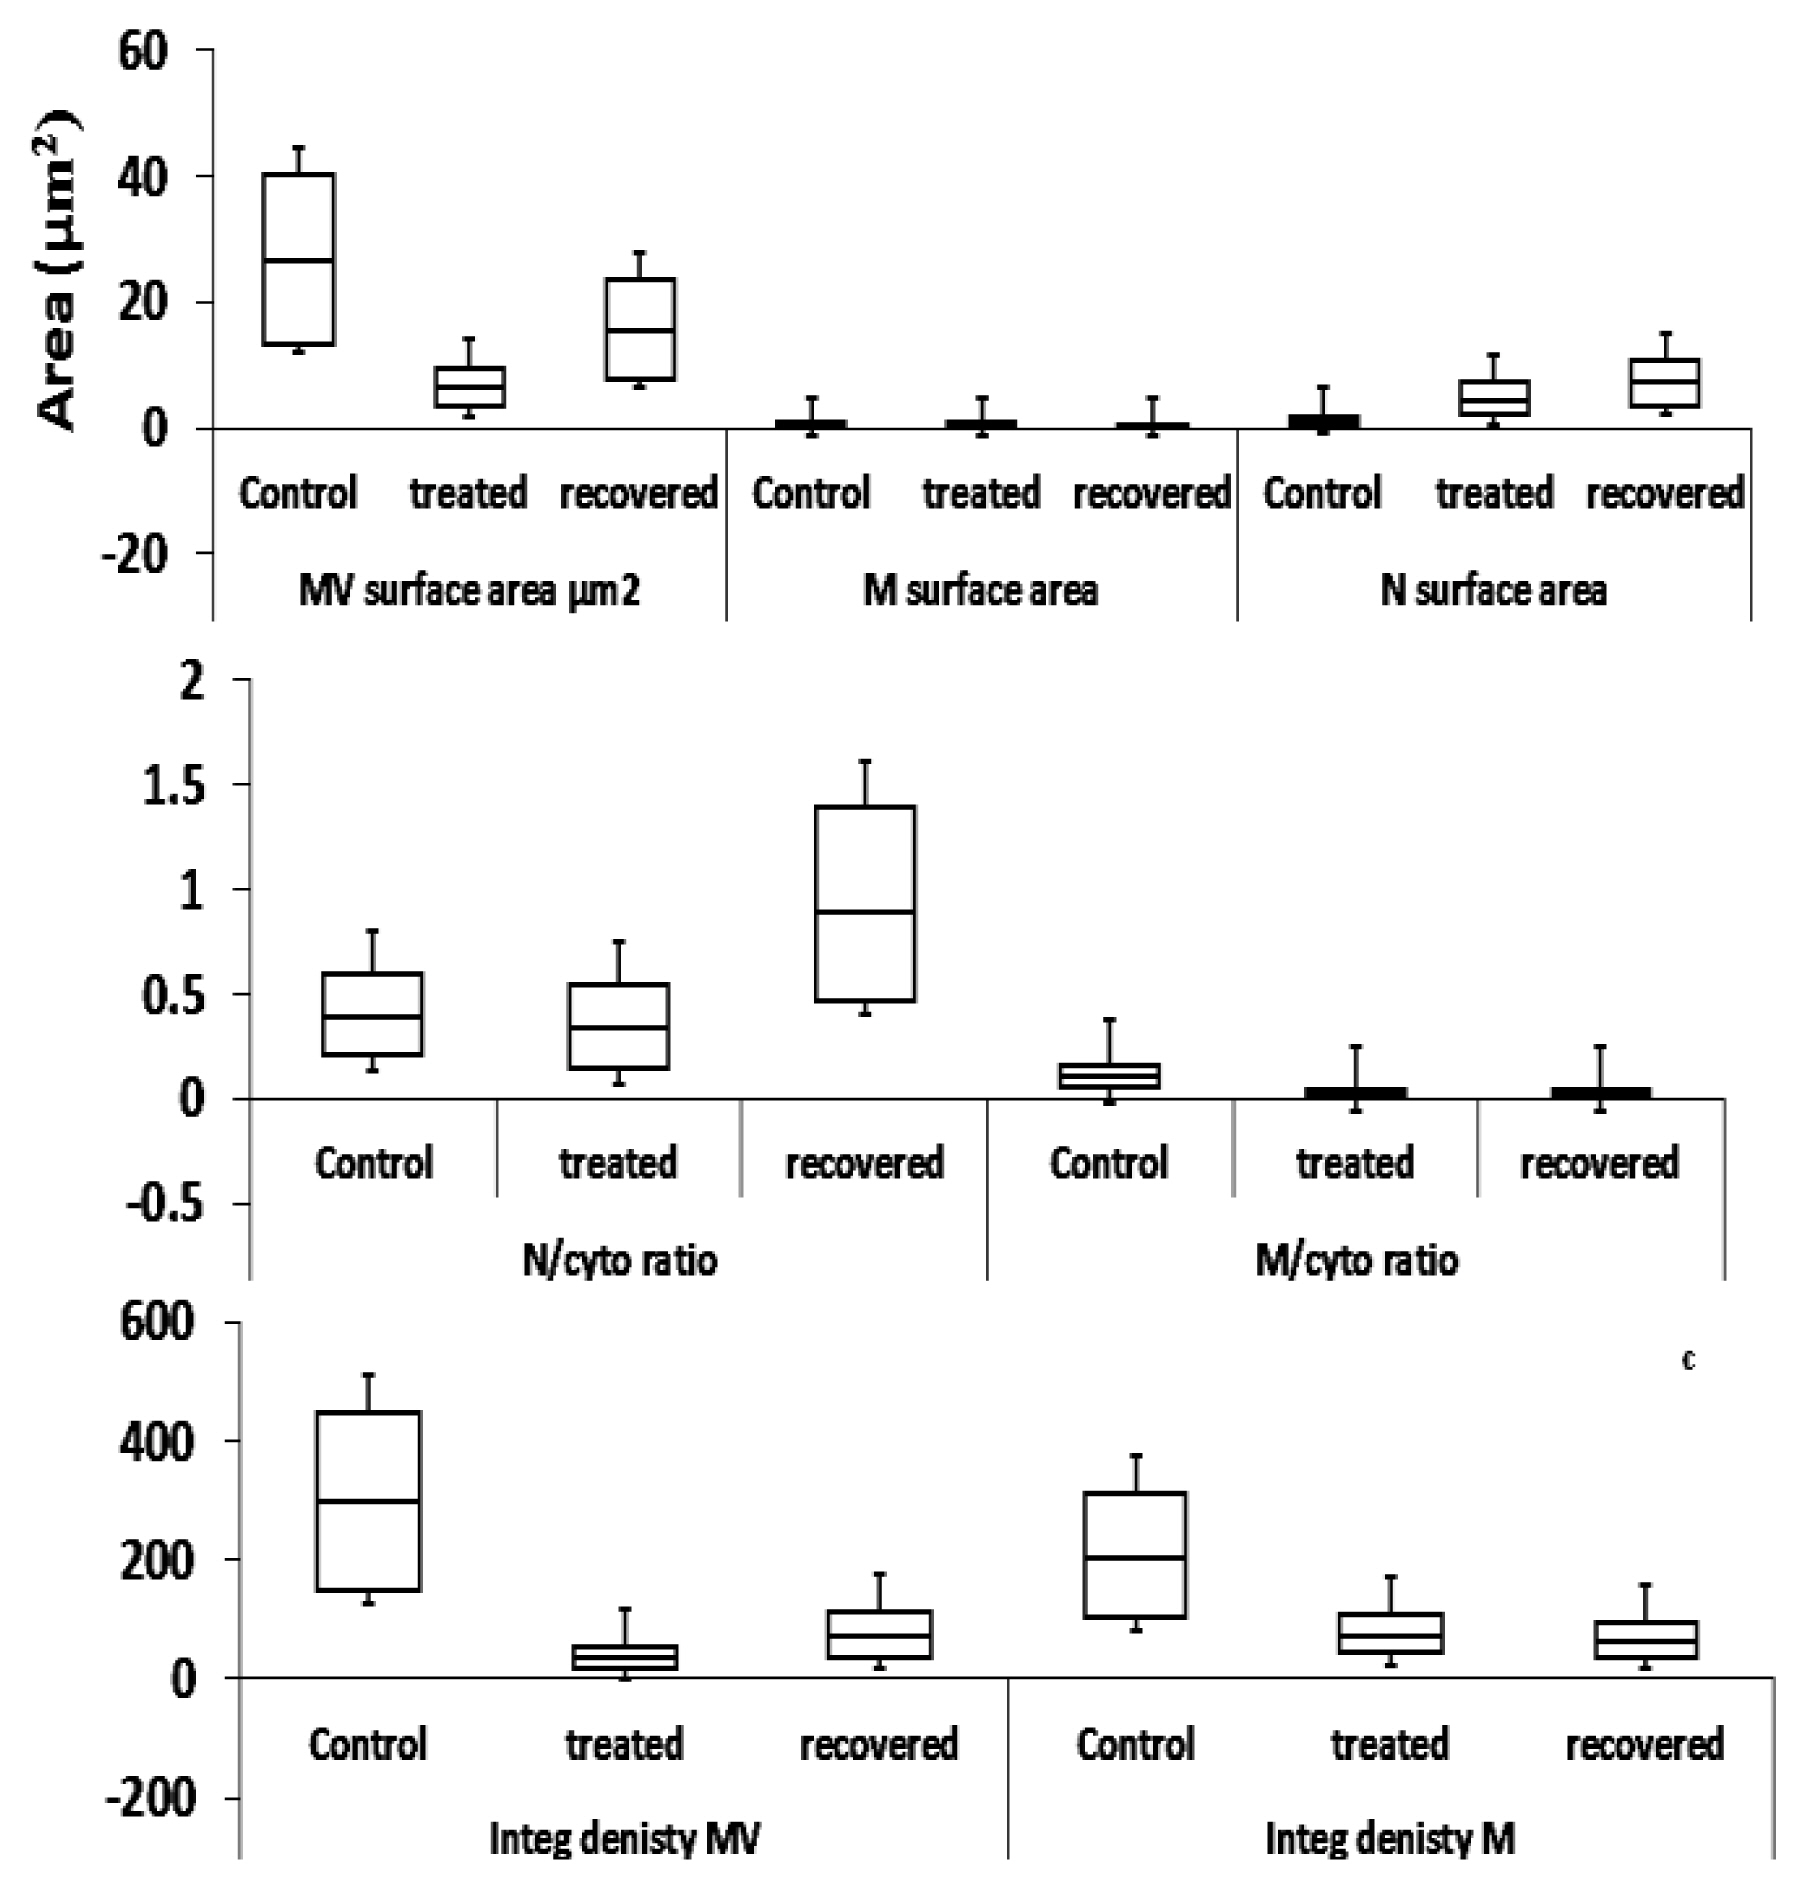
Estimation of images of snail, Monacha cartusiana (Mǖller) sections for (a) surface area (μm2), (b) nucleus/cytoplasm and mitochondria/cytoplasm ratios, and (c) integrated density of microvilli and mitochondria in control, ZnONPs-treated snails (74 μg/mL) for 14 d and recovered snails, respectively.
Discussion
The obtained data showed genotoxicity (DNA adduct) and cytotoxicity of ZnONPs in studied animals. Also, based on reported results, the M. cartusiana could provide a reliable model to study the impacts of such NMs on non-target organisms. As documented previously in the literature, OXS is the primary mechanism of action for NPs and ultrafine particles. The findings herein showed damage in cell components: organelles and nucleic acids ending in organ dysfunction and/or apoptosis [48,49]. Such modifications in the structural and functional integrity of adjusted biomolecules across the process of OXS of NMs might initiate a range of downstream functional consequences associated with cellular damage and organ dysfunction [50]. The toxicity of ZnONPs is regulated by the released rate of ions in the solution (indirect effect). Ions (Zn2+) may be augmented with the increasing concentrations of NMs, where ZnONPs toxicity and bioavailability were controlled by the release of Zn2+ [21,51]. Also, ZnONPs might interact with the tissues and organelles (direct effect) [2,52], which were reported in current study.
Genomic alterations
Variations in ISSR-PCR patterns stimulated by chemicals can be interpreted due to differences in the stability of genomic DNA template. The present findings reported different patterns of polymorphism for the six studied primers in the amplification of DNA bands in samples from the treated and recovered snails, either as loss and/or gain [53]. Exposure to ZnONPs could provoke genetic diseases owing to their reported genotoxicity in the current study. Other studies reported similar results on amphibians [54] and fish [18]. Also, other organisms were employed to investigate the genotoxicity of NPs. For example, exposing tadpoles, Pleurodeles waltl, to CeO2NPs (1 and 10 mg/L) for 12 d showed an increase in micronucleus (MN) [55]. Also, when zebrafish were imperiled by ZnONPs and zinc ions (1–100 mg/L) for 144 h showed modification of gene expression related to oxidizing enzymes and increased DNA damage [12]. Similarly, AgNPs at 55 mg/L induced genomic damage by DNA breaks and OXS in Labeo rohita after 14d exposure [56]. ZnONPs at 0.1, 1.0, and 10 mg/L exhibited DNA damage in tadpoles (Lithobates cutesbeianus) compared to the control group. It was revealed that the 10 mg/L had provoked a high incidence of MNs in erythrocytes and nucleated cells, indicating probable mutagenic and genotoxic consequences of ZnONPs for amphibians [57]. Other studies have also shown that NPs might cause mitochondria damage, DNA adducts, and DNA oxidation [58]. DNA damage was associated with the excessive generation of ROS, which might cause the deterioration of DNA [59]. In parallel, the digestive glands are a vital organ in detoxifying, absorbing, and metabolizing toxicants. Toxicants were carried out via haemolymph to the digestive glands [60]. As a result, it might be useful to utilize this organ to assess biochemical responses to nanomaterials.
Histopathological defects
Snail, H. aspersa exposed to different concentrations of ZnONPs had altered digestive glands through increased secretory cells, vacuolation, and hemocytic infiltration [61]. Also, Ali et al. [62] documented an increase in the excretory cells and flattened digestive glands in AgNPs-treated snail, Eobania vermiculata. Sawasdec et al. [63] reported damage to tubule, vacuoles, enlarged tubule lumen, and destructiveness of digestive glands in copper and lithium-treated snail, Marisa cornuarietis. Moreover, dilation and vacuolation in the crayfish hepatopancreas were induced after exposure to CuONPs [64]. TiO2NPs caused histopathological differences in the red swamp crayfish organs, where the 25 mg/L dose triggered minor changes in hepatopancreatic tubules, such as the emergence of colored pyknotic nuclei and epithelial cell lysis in certain tubules. However, at high concentrations (250 mg/L) of TiO2NPs, epithelial cells lysed, cellular atrophy occurred, and significant vacuolation occurred [64]. Also, TiO2NPs caused significant deterioration of the cellular organelles, including ruptured microvilli, distorted mitochondria, vacuolated cytoplasm, pyknotic nuclei, and fragmented endoplasmic reticulum [65]. Therefore, the interaction of NMs with enzymes might cause OXS and the production of ROS, which could lead to cell necrosis [66,67]. ZnONPs initiated histopathological alterations in bivalves' DG and gills of C. aegptiaca [68,69]. The pathological reactions to ZnONPs were cell hypertrophy and hyperplasia; the organs demonstrated gradual alterations in glandular activity. In addition, the lamellae of the gills were uneven, and the filaments were swollen [70].
The measurement of mitochondrial swelling can be explained by the activation of membrane permeability in the amended mitochondria. This discovery involves necrosis or death of apoptotic cells as a function of the involved mitochondria number [71]. Hödl et al. [72] state that these tissues can bind Zn2+, and others trigger high levels of metallothioneins. Zinc ions toxicity is intensified, leading to OXS, lipofuscin accumulation, and membrane damage. This result is in accordance with the existing data in the recovered animals, where they could not be completely recovered. Biopersistent potency of ZnONPs displayed this concept through outcome profiles of DNA adducts in the haemolymph and digestive g. and the histopathological defects in sections of digestive glands.
Conclusions
The present findings showed that ZnONPs were bio-persistent in the biological system of snail M. cartusiana, and the treated animals couldn't completely be recovered after 14 d. This was clear in the reported patterns of DNA adducts and histopathological defects data. Such changes may represent the outcome of NMs' stress in organisms. Moreover, the present study showed the utility of land snail M. cartusiana as a bioindicator for NPs toxicity.
Notes
Funding
The authors declare that no funds, grants, or other support were received during the preparation of this manuscript.
The authors have no relevant financial or non-financial interests to disclose.
CRediT author statement
KYAH: Supervision, Writing-Reviewing & Editing; SRO: Conceplualization, Methodology; AMKN: Conceplualization, Methodology; AK: Data Curation, Writing-Orginal draft Preparation; HMED: Visualization, Investigation.