Repeated-dose 90-day oral toxicity study of GST in Sprague-Dawley rats
Article information

Abstract
TiO2 have been studied on inhalation and skin exposure due to the properties of the materials’ use (cosmetics, paints and other products) and the additional safety information on other intake routes for the potential risk assessment is limited. Therefore, the aim of this study was to obtain safety data for new TiO2 powder, GST produced through sludge recycling of the sewage treatment plant through repeated-dose toxicity in Sprague-Dawley (SD) rats in according to the OECD test guideline (TG 408). Based on the results of the dose-range finding study (28-day repeated toxicity), GST was orally administered to rats at doses of 0, 500, 1000, and 2000 mg/kg B.W/day for 90-day and reversibility of effects of 2000 mg/kg bw/day was assessed after 4 weeks. In clinical signs, compound-colored stool was observed in all animals of treatment group (low: day 14 or 15, middle: day 8, high: day 8) and continuously observed up to the end of administration or day 1 of recovery period (high dose group). Also, the test substance retention in gastro-intestinal tract was observed in all animals of treatment group in gross finding at necropsy and foreign materials in lumen of these organs (stomach, duodenum, ileum, cecum, colon, rectum) likely indicative for the presence of test material in histopathological examination. In addition, no test substance-related adverse effects were noted in the detailed clinical observations, sensory reactivity/functional assessments, body weight, food consumption, urinary analysis, ophthalmological examination, hematological/biochemical parameters, organ weights, histopathological findings. Therefore, the present results show that the NOAEL (no observed adverse effect level) of new TiO2 powder, GST was considered to be 2000 mg/kg B.W/day in rats after repeated oral administration for 90-day under the present study conditions and no target organs were identified.
Introduction
Currently, TiO2 (Titanium Dioxide) one of the most frequently used nanomaterials (NP) and has been used commercially in cosmetics and skin care products, paints, plastics, paper, toothpicks and other prod [1]. Nanoscale TiO2 such as photocatalyst represents less than 2% of total consumption and presents physical properties and TiO2 photocatalyst has been used in field of dye-sensitized solar cells and UV protection agents [2]. One of the main differences between TiO2 nanoparticles (NPs) and conventional TiO2 is the much greater surface area of a given mass or volume of nanoparticles compared to an equivalent mass or volume of conventional TiO2 particles. This greater relative surface area of the TiO2 NPs affords a greater potential for properties such as catalytic activity and UV absorption at certain wavelengths. Such properties have led to the development or use of TiO2 NPs for a wide variety of applications, and also due to changes of dimension, TiO2 NPs may show different biological, chemical, optical, magnetic and structural properties and may induce differential toxicity [3]. Recently, the commercialization of TiO2 has caused an increase of exposure to human and four main routes of exposure are known for oral/dermal exposures, pulmonary absorption and injection are known for one of the most common forms of route to human and it may translate to systemic organs from the lung and gastrointestinal tract (GIT) [4,5]. However, the toxicity studies on TiO2 NPs have focused on inhalation and skin exposure and study on oral exposure has been limited. MacNicoll A et al. reported that oral ingestion of TiO2 (nanoparticles or larger particles) via food allows it to pass through the body unabsorbed because of particle agglomeration in gastro-intestinal tract and it was likely to be excreted in feces [6]. Also, some studies were carried out in line with OECD test guideline 407 (28-day study; single dose 24,000 mg/kg BW/day) and 408 (90-day study; 0, 100, 300 or 1000 mg/kg BW/day) using rutile particles with a mean size 173 nm or 145 nm. These studies showed that material-related finding (brown granular aggregates) were observed in the intestinal mucosa and the draining lymphoid tissue without cellular or tissue reaction. The two studies for TiO2 nanomaterials did not produce any adverse effects [7,8].
TiO2 material, which is covered in this paper, the new TiO2 material, GST (100% anatase) prepared from the precipitated sludge using TiCl4 used as a coagulant to remove total phosphorus in the wastewater was manufactured to have cost-competitive lower than price of commercial material (P-25, Evonik Corp., a flame-made multiphasic TiO2 nanoparticles containing anatase and rutile) with excellent photocatalytic function [9,10]. Seol et al. reported that the acute toxicity study was assessed for two TiO2 materials (GST, P-25) using a female rats in accordance with OECD test guideline (TG 402, 423) and it showed the lethal dose (LD50) was over 2000 mg/kg body weight (GHS category; “category 5 or unclassified”) [11–13]. And then study on oral repeated dose toxicity has been not reported for estimate of NOAEL (no-observed-adverse-effect level).
Therefore, the present study was performed to provide reproducible and reliable results for establishing safe levels and formulating risk assessments for new TiO2 catalyst, GST in rats following subchronic oral exposure in accordance with OECD test guideline (TG 408).
Materials and Methods
Test facility
This study was conducted in compliance with the principles of Good Laboratory Practice (GLP) at KTR (Korea Testing & Research Institute), Hwasun based on the Korea Good Laboratory Practice (KGLP) and OECD “Principle of Good Laboratory Practice, ENV/MC/CHEM (98)17 (as revised in 1997)”. The study protocol was reviewed and approved (IAC2020-2293) by the Institutional Animal Care and Use Committee (IACUC) of KTR Hwasun based on the Animal Protection Act [Enforcement Date: 2020-02-12] [No.16977 (2020-02-11, partial revision)] [14] and the Laboratory Animal Act [Enforcement Date: 2019-03-12] [No. 15944 (2018-12-11, partial revision)] [15]. The KTR Hwasun has been fully accredited by the association for assessment and accreditation of laboratory animal care (AAALAC). Also, this study was conducted in accordance with the OECD Guidelines for the Testing of Chemicals, Section 4, TG 408 “Repeated dose 90-day oral toxicity study in rodents” [16].
Animal husbandry and maintenance
For the repeated dose toxicity study (Study No. TGK-2020-000233), 55 Sprague-Dawley rats [5 weeks-old, Crl;CD(SD), SPF] of each sex were obtained from the ORIENT BIO Inc. (8, Hwaaksan-ro 124, Buk-myeon, Gapyeong-gun, Gyeonggi-do, Republic of Korea) and kept carefully following an acclimation period of 8(male) – 9(female) days to ensure their suitability for the study. These animals were kept within a well-ventilated and specific pathogen-free (SPF) facility with conditions set to a temperature of 22±3 °C (measured value: 20.7–22.9 °C), a humidity of 50±20% RH (measured value: 46.8–61.8%) with artificial lighting a 12-h light/12-h dark cycle (08:00 – 20:00/20:00 – 08:00) and 10–20 air changes per hr. For study, the healthy animals were used after examining conditions included body weight, clinical signs and then 50 rats/sex were randomly divided into four groups listed in Table 1. Animals were kept in stainless steel wire cages and allowed R/O (reverse osmosis) water via a water bottle and irradiation-sterilized pellet diet (Rodent Diet 20 5053, Labdiet, USA), ad libitum.
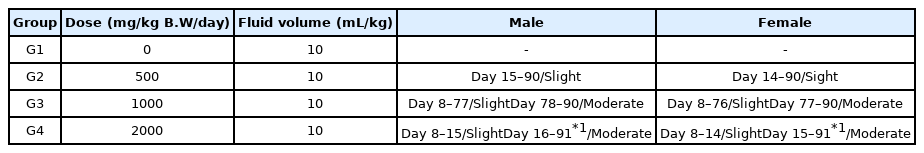
Groups for 90-day repeated oral toxicity study.
Test materials and preparation
The new TiO2 materials, GST (pale yellow powder, crystalline composition of 100% anatase) was provided by Bentec Frontier Co., Ltd (139, Nanosandan-ro, Nam-myeon, Jangseong-gun, Jeollanam-do, Republic of Korea). The characterization of GST was evaluated as Table 2 [zeta potential, particle size image (SEM), TEM (transmission electron microscopy) image, size distribution].

Evaluation for characterization of TiO2.
For dose selection, we considered the result of previously studied dose-range finding study (DRF) (Study No. TNK-2020-000258, 28-day repeated oral toxicity; 0, 500, 1000, 2000 mg/kg B.W/day) with no toxicological effects were found at any dose group. In clinical sign, compound-colored feces were observed at 1000, 2000 mg/kg B.W/day in both males and females on day 15 up to the end of administration (day 28). Based on the DRF study, the dose 2000 mg/kg B.W was selected as the high dose and two-fold intervals were used for the middle dose (1000 mg/kg B.W) and low dose (500 mg/kg B.W), respectively. The test substance was suspended in vehicle (sterile distilled water for injection, DAI HAN PHARM. CO., LTD.) for concentrations of 50, 100, and 200 mg/mL (administration volume: 10 mL/kg) based on the most recently measured body weight (1 ~ 2 times/week). And then, the preparations were administered once/day, 7 days/week for 90 days by oral gavage by stomach tube (Disposable flexible type, FUCHIGAMI). The control group was administered vehicle.
Test procedure
Properties of GST
The characterization of GST showed in Figures 1, 2 and 3, respectively. The zeta potential is the potential between droplet surface and dispersing liquid medium and can be used to estimate surface charge of the droplets in the dispersion medium. Also, it was known for indicator of the droplet stability, where values more positive than +30 mV and more negative than −30 mV indicate good stability against coalescence [17]. This oral route of exposure to nanoparticles would ensure that nanoparticles enter an environment yielding a wide range of pH values. A hypothetical model nanoparticle is known to exhibit the largest agglomerate size at the point where its zeta potential is 0 mV. GST and P-25 nanoparticles exhibited zeta potentials of −35.4±5.99 mV and 32.3±4.35 mV respectively Figure 1. Over the course of this experiment, both GST and P-25 TiO2 nanoparticles displayed the difference between positive and negative zeta potentials, which consequently affected their agglomeration state. The key difference between positive and negative zeta potential is that the positive zeta potential indicates that the dispersed particles in a suspension are positively charged whereas the negative zeta potential indicates that the dispersed particles in the suspension are negatively charged. The suspension stability is dependent upon physical characteristics of both the suspended nanoparticles and their suspension medium. One of the major factors involved in the agglomeration process is electrostatic stabilization. Altering the zeta potential to the point at which it exhibits zero net charge, decreases stabilization forces and promotes agglomeration. Cellular viability was influenced by a variety of factors including zeta potential and agglomeration state [18]. Also, the particle size value and distribution showed that GST was experimented to have materials of various sizes and also P-25 to have materials of various sizes due to agglomeration states Figures 2 and 3.
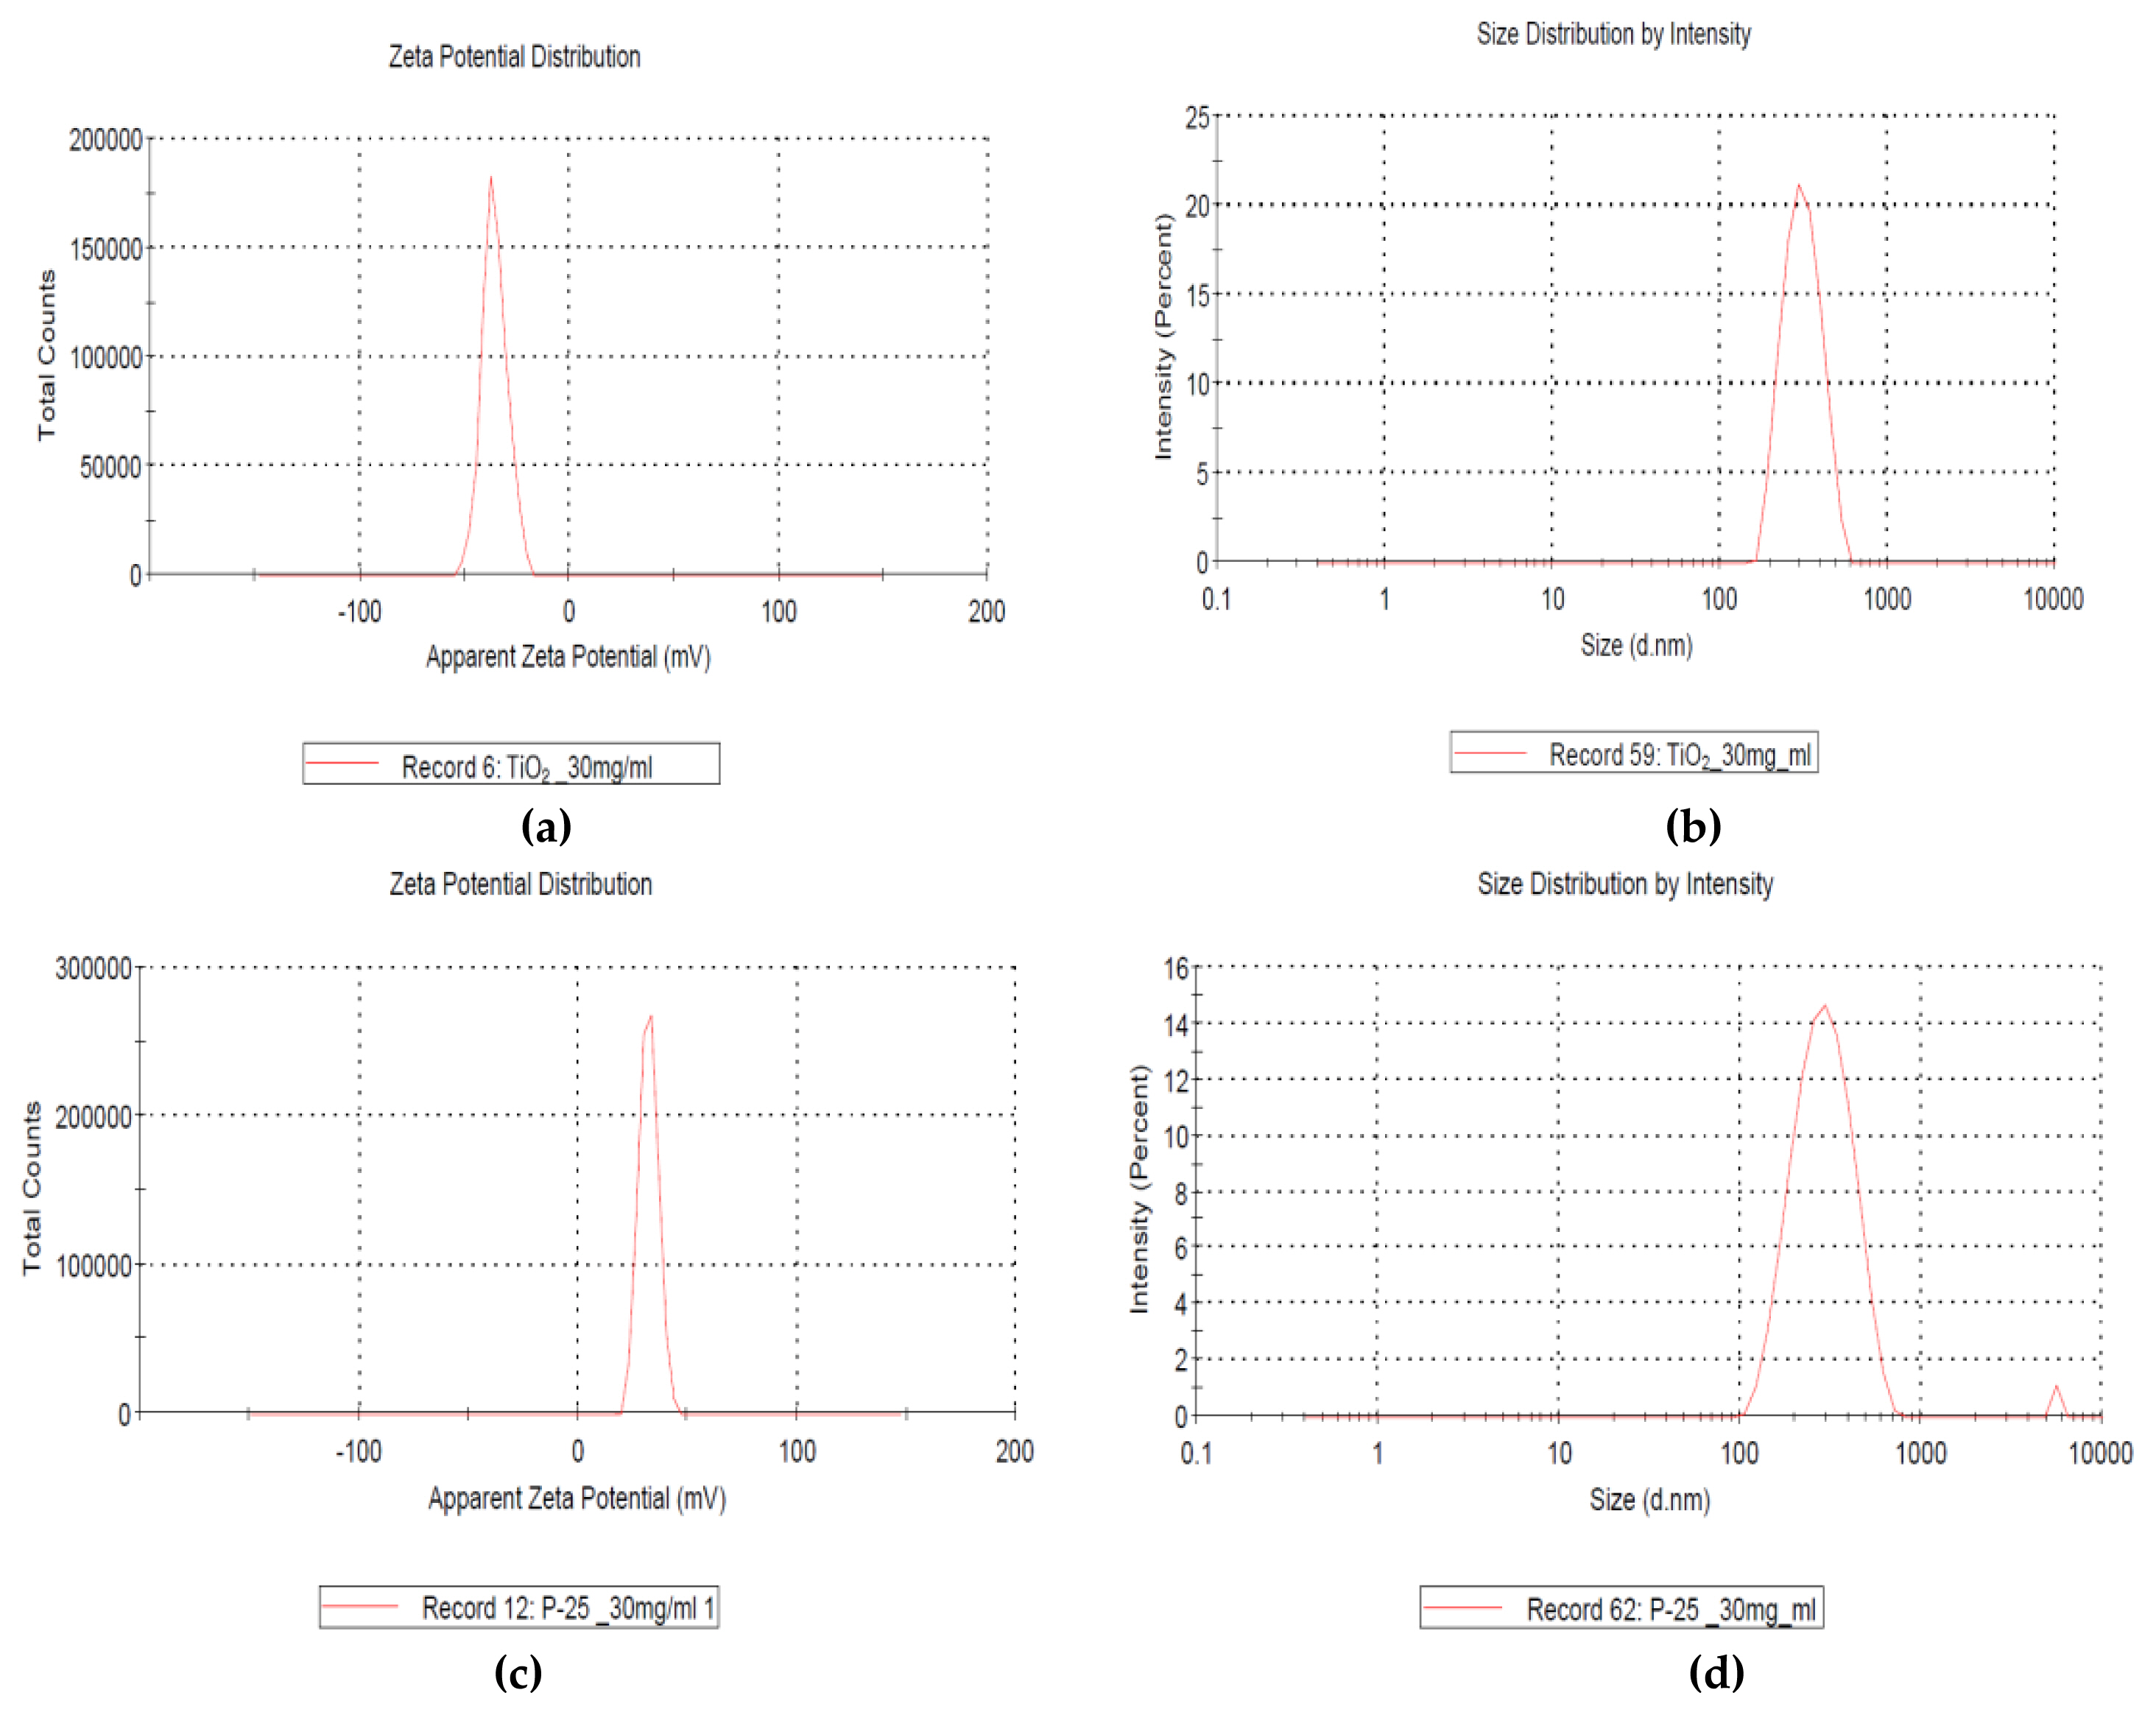
Characterization of TiO2 particles (GST, P-25 made by Evonik Corp., Germany.) analyzed by Korea TECH: (a) negative zeta potential (GST, −35.4±5.99 mV, 30 mg/mL); (b) size distribution by intensity (GST); (c) positive zeta potential (P-25, +32.3±4.35 mV, 30 mg/mL); (d) size distribution by intensity (P-25).
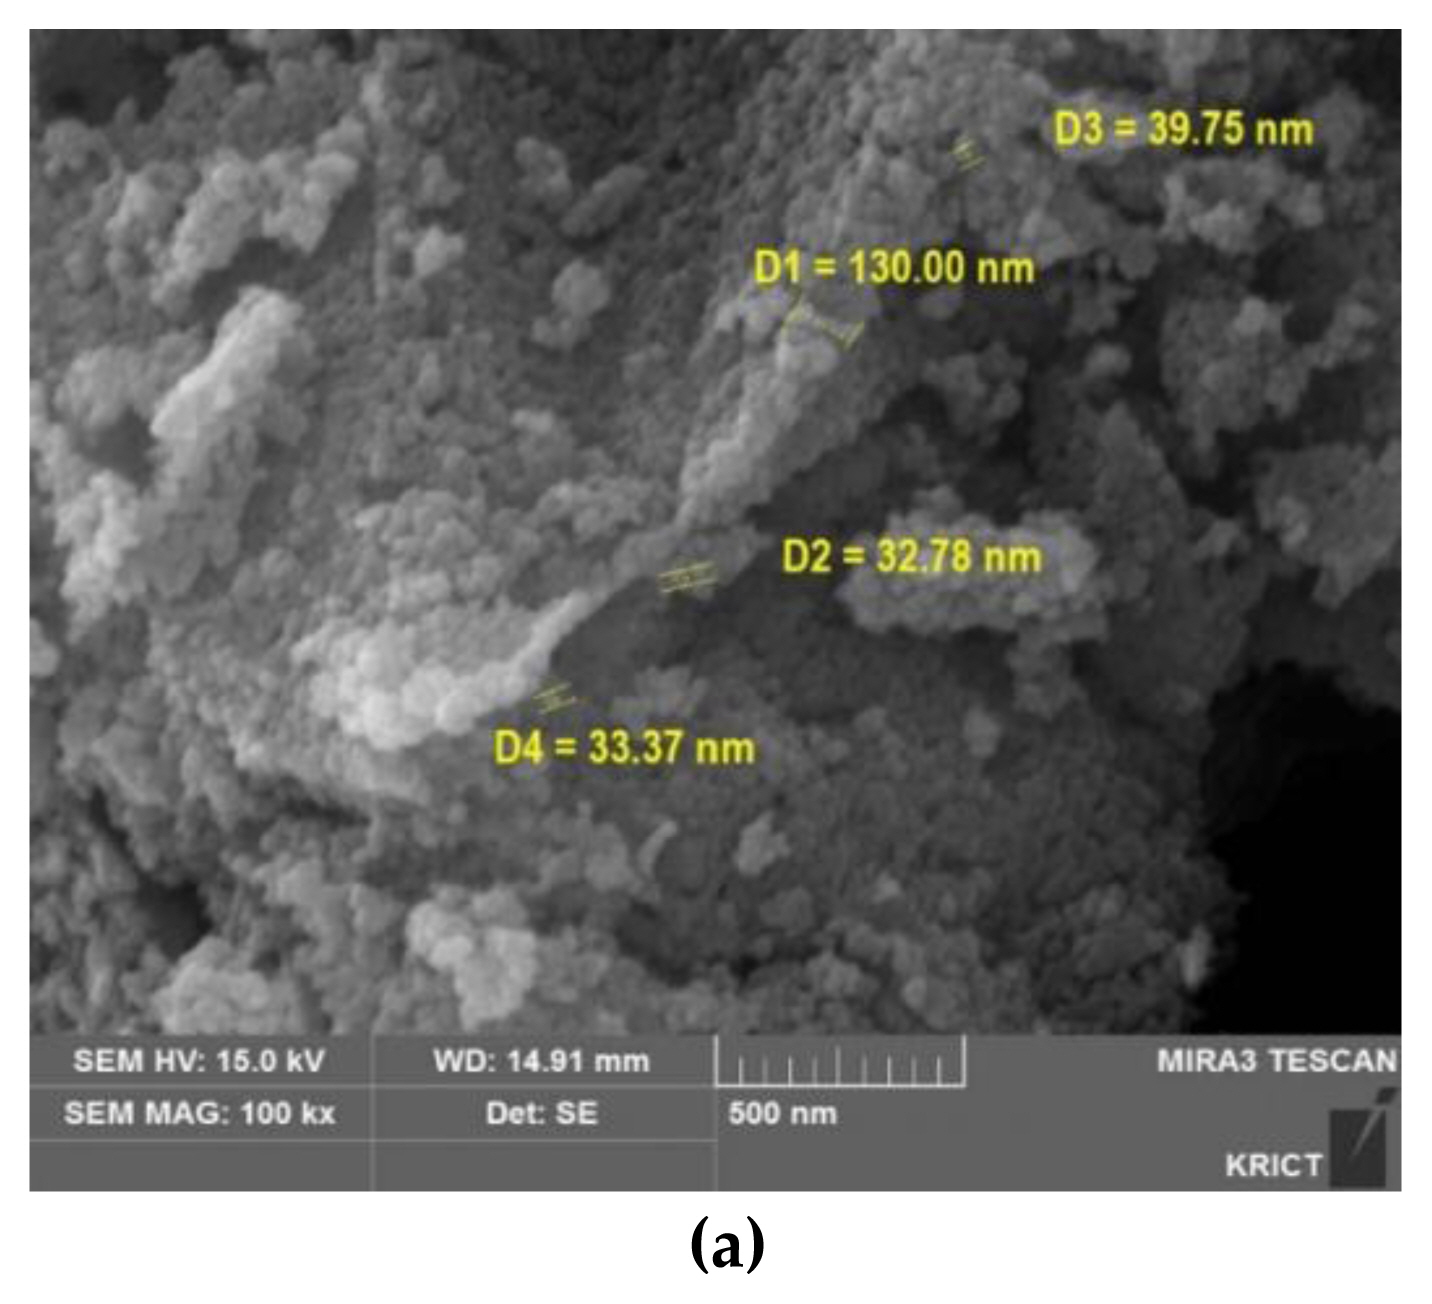
Characterization of TiO2 particles (GST): (a) SEM (scanning electron microscope) image analyzed by KRICT.
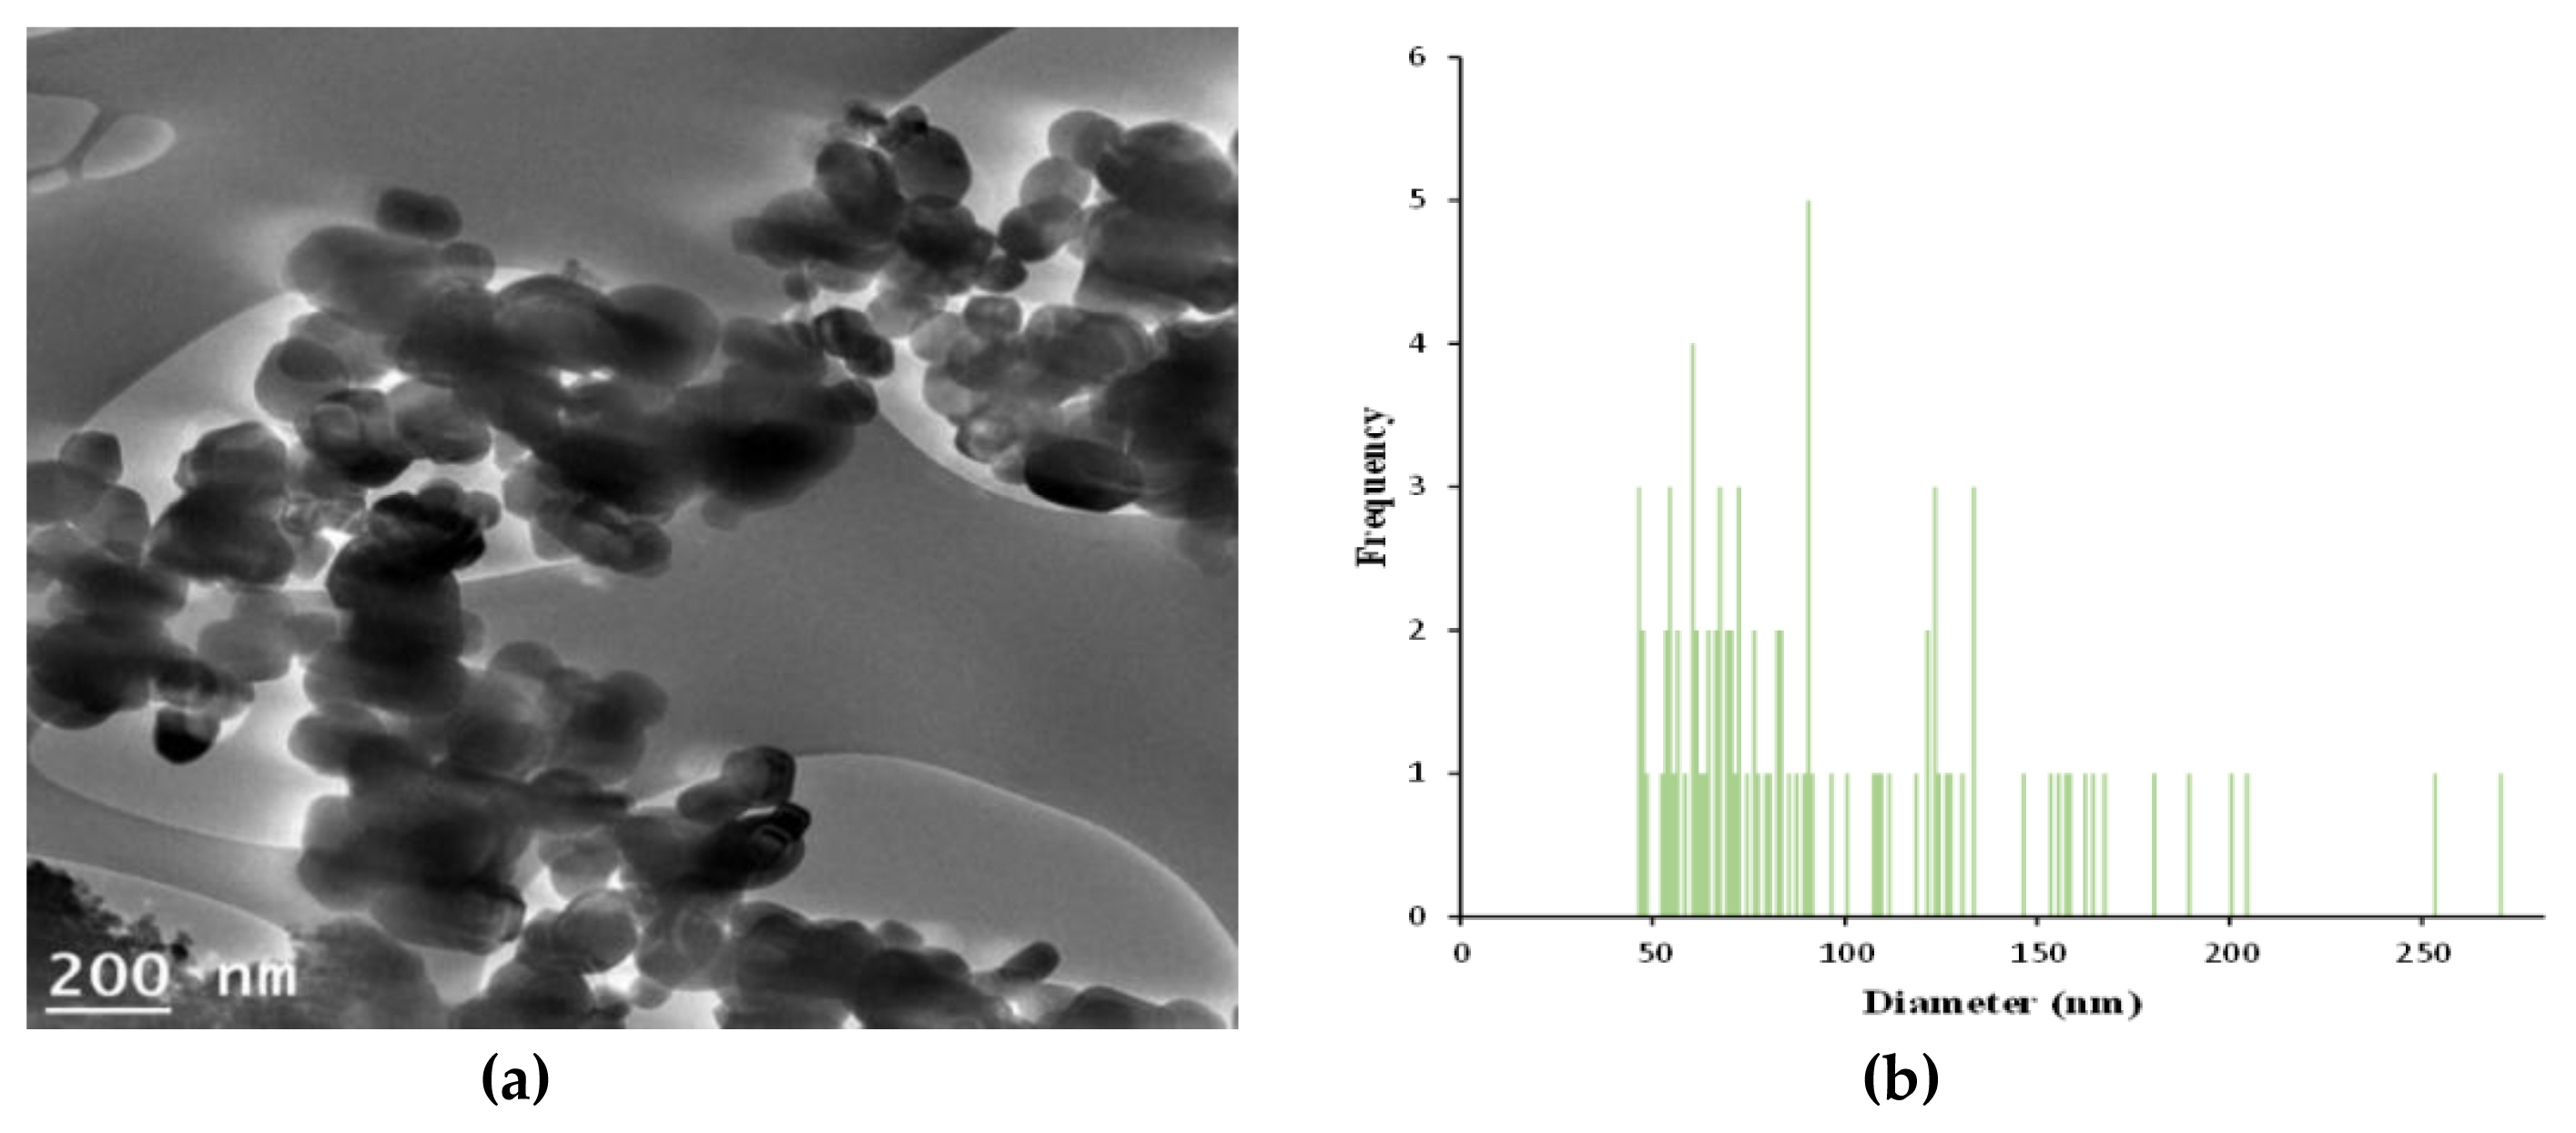
Characterization of TiO2 particles (GST): (a) A particles dispersed in 99.9% EtOH was deposited on a copper grid and analyzed using TEM (Transmission electron microscope) image by Korea Basic Science Institute; (b) Size distribution (95.8±46.3 nm, 46–270 nm,) of the imaged GST(image J software).
Clinical signs, body weight and food consumption
All animals were observed and recorded daily [treatment period; twice a day (before/after treatment), recovery period; once a day] throughout the experimental period (90-day treatment and 28-day recovery period) including treatment-related signs (mortality, general conditions, toxicity signs) and reversibility. The detailed clinical observation made in prior to the treatment and once a week thereafter. Also, the additional observations were performed; ophthalmic examination during the last week of treatment/recovery period by ophthalmoscope (Genesis, Kowa, Japan), sensory reactivity to stimuli (visual, auditory, touch/pain response, righting reflex) in week 12, functional observations including grip strength (1027 CSX, Columbus Instrument, USA) in week 12, motor activity by activity monitor (Opto-varimex-4, 8 channel activity anal set), Columbus Instrument, USA) and software (Opto-varimex-4 AutoTrack System 4.90) in week 11. Body weight including fasted body weight and food consumptions were measured once a week for experimental period. In the food consumptions, the date values were measured per cage (g/cage/day).
Urinalysis
Urine test was performed during the last week of the study (5 animals/sex/group) using urine collected from a metabolic cage (Tecniplast, Italy) as follows; general examination using urine collected for 3–4 hours (volume, urinary sediments, color), chemistry examination using urine collected overnight by urine stick (Multistix 10 SG, Siemens, Germany) and analyzer (Clinitek Advantus, Siemens, Germany); pH, specific gravity, protein, glucose, ketone bodies, bilirubin, urobilinogen, nitrite, occult blood and leukocyte.
Hematology, biochemistry and hormone analysis
All animals were fasted overnight before blood sampling. The blood samples were collected from the abdominal aorta under anesthesia and transferred to the tubes with anti-coagulant; CBC bottle (EDTA 2K, BD, USA) for hematological test using blood analyzer (ADVIA 2101i, Simens, Germany), Multi-channel microplate Reader (Synergy HT, BioTek) and vacutainer (9NC Sodium citrate, BD, USA) for coagulation test using blood coagulation analyzer (ACL ELITE PRO, Instrumentation Laboratory, U.S.A.), respectively. And then, the remaining samples were placed in tubes without an anticoagulant for biochemistry (TBA-120FR, TOSHIBA, Japan) and for hormone analysis (Immunite 2000xpi, Siemens, Germany). To get plasma for coagulation examination, blood samples were centrifuged for 10 minutes (3000 rpm, 4 °C) and the sera for biochemistry/hormone analysis were centrifuged in the same way after the tube were kept at room temperature.
Hematology; Red blood cell count (RBC), hemoglobin (HGB), hematocrit (HCT), mean corpuscular volume (MCV), mean corpuscular hemoglobin (MCH), mean corpuscular hemoglobin concentration (MCHC), Reticulocyte (Retic), platelet count (PLT), total leucocyte counts (WBC), differential count [neutrophils (Neut), lymphocytes (Lymph), monocytes (Mono), eosinophils (Eos), basophils (Baso)] and methemoglobin (Met-Hb)
Coagulation test: prothrombiN (PT), activated partial thromboplastin time (APTT)
Biochemistry: total protein (TP), albumin (ALB), A/G ratio (Albumin/Globulin), total bilirubin (T-BIL), alkaline phosphatase (ALP), aspartate aminotransferase (AST), alanine aminotransferase (ALT), gamma glutamyl-transpeptidase (GGT), creatinine (CRE), blood urea nitrogen (BUN), Urea, total cholesterol (T-CHO), triglycerides (TG), glucose (GLU), calcium (Ca), inorganic phosphorus (IP), creatine kinase (CK), cholinesterase (CHE), low-density lipoprotein (LDL), high-density lipoprotein (HDL), bile acid (TBA), sodium (Na), potassium (K) and chloride (Cl).
Hormone: Serum total thiroxine (T4), triodothyronine (T3), and throid stabilizing hormone (TSH)
Necropsy and histopathology
On the day scheduled for necropsy, all animals were anaesthetized with anesthetic drug (Ifran Liquid for Inhalation, Hana Pharm. Co., Ltd., Republic of Korea) and device (MatrxTM VIP 3000, MIDMARK, USA) followed by blood sampling. And then, gross examinations were performed on external surface, all internal organs of the cranial, thoracic, and abdominal cavities. Absolute and relative weights (organ weight to fasted body weight ratio,%) of organs were measured for including organs; liver, thymus, brain, pituitary gland, heart, spleen, uterus with cervix, kidneys (*), adrenal glands (*), thyroid gland (*), ovaries (*), prostate+seminal vesicles with coagulating glands, testes (*) and epididymides (*). The bilateral organs (*) were measured, respectively and then the measured weights were summed.
The organs were fixed in 10% neutral buffered formalin, bouin’s fixation (for testes/epididymides), davidson’s solution (for eyes with the harderian gland) as following organs; liver, kidney, adrenal glands, heart, lung (with bronchus), trachea, brain (with pituitary gland), spleen, ovary, testis, epididymis, prostate/seminal vesicles, ovary, uterus (vagina), urinary bladder, tongue, (para)thyroid gland, (small/large) intestine, pancreas, stomach, sternum/femur, skeletal muscle (sciatic nerve), (submandibular/mesenteric) lymph node, spinal cord skin (with mammary gland). All fixed tissues were processed for trimming, embedding in paraffin, section, and stained with hematoxylin & eosin (H&E). The slide specimens were microscopically examined using the image analyzing system (Leica, Germany) in high dose and control dose group.
Statistical analysis
Data were presented as means±standard deviation (S.D.) for each group. The body weight, food consumption, functional observations (grip strength, motor activity), organ weights and hematological/biochemical data were analyzed using SPSS (Ver 19.0, Chicago, IL, USA) program. In treatment group, the Leven’s test was performed to derive the homogeneity of variances and one way ANOVA test was performed to determine the significant differences between study groups. In the case of confirming significant difference, post-hoc test was proceeded according to the result of homogeneity (homogeneity; Scheffe test, heterogeneity; Dunnett’s T3 test). In recovery group, data were performed using independent t-test. p value<0.05 were considered statistically significant.
Results and Discussion
Clinical signs
During the experimental period, there were no abnormal clinical signs and mortality such as treatment-related moribund and dead animals in any of the treatment groups. Also, no significant differences were observed in other observations such as detailed clinical observation, ophthalmic examination, sensory reactivity to stimuli, functional observations including grip strength and motor activity by activity monitor.
However, the compound-colored feces were observed in all animals of treatment group. These signs were observed from on day 8 in middle and high dose group and on day 14 (female)-15 (male) in low dose group to the end of administration. In the degrees of signs, there were observed from slight to moderate in the middle and high dose group. This sign was observed up to on day 1 of recovery period and was not observed thereafter in the high dose group as follows Table 3. The color of the feces observed in daily was lighter in the high dose group than in the low and middle dose groups.
Summary of clinical signs (compound-colored feces) for 90-day treatment and 28-day recovery period
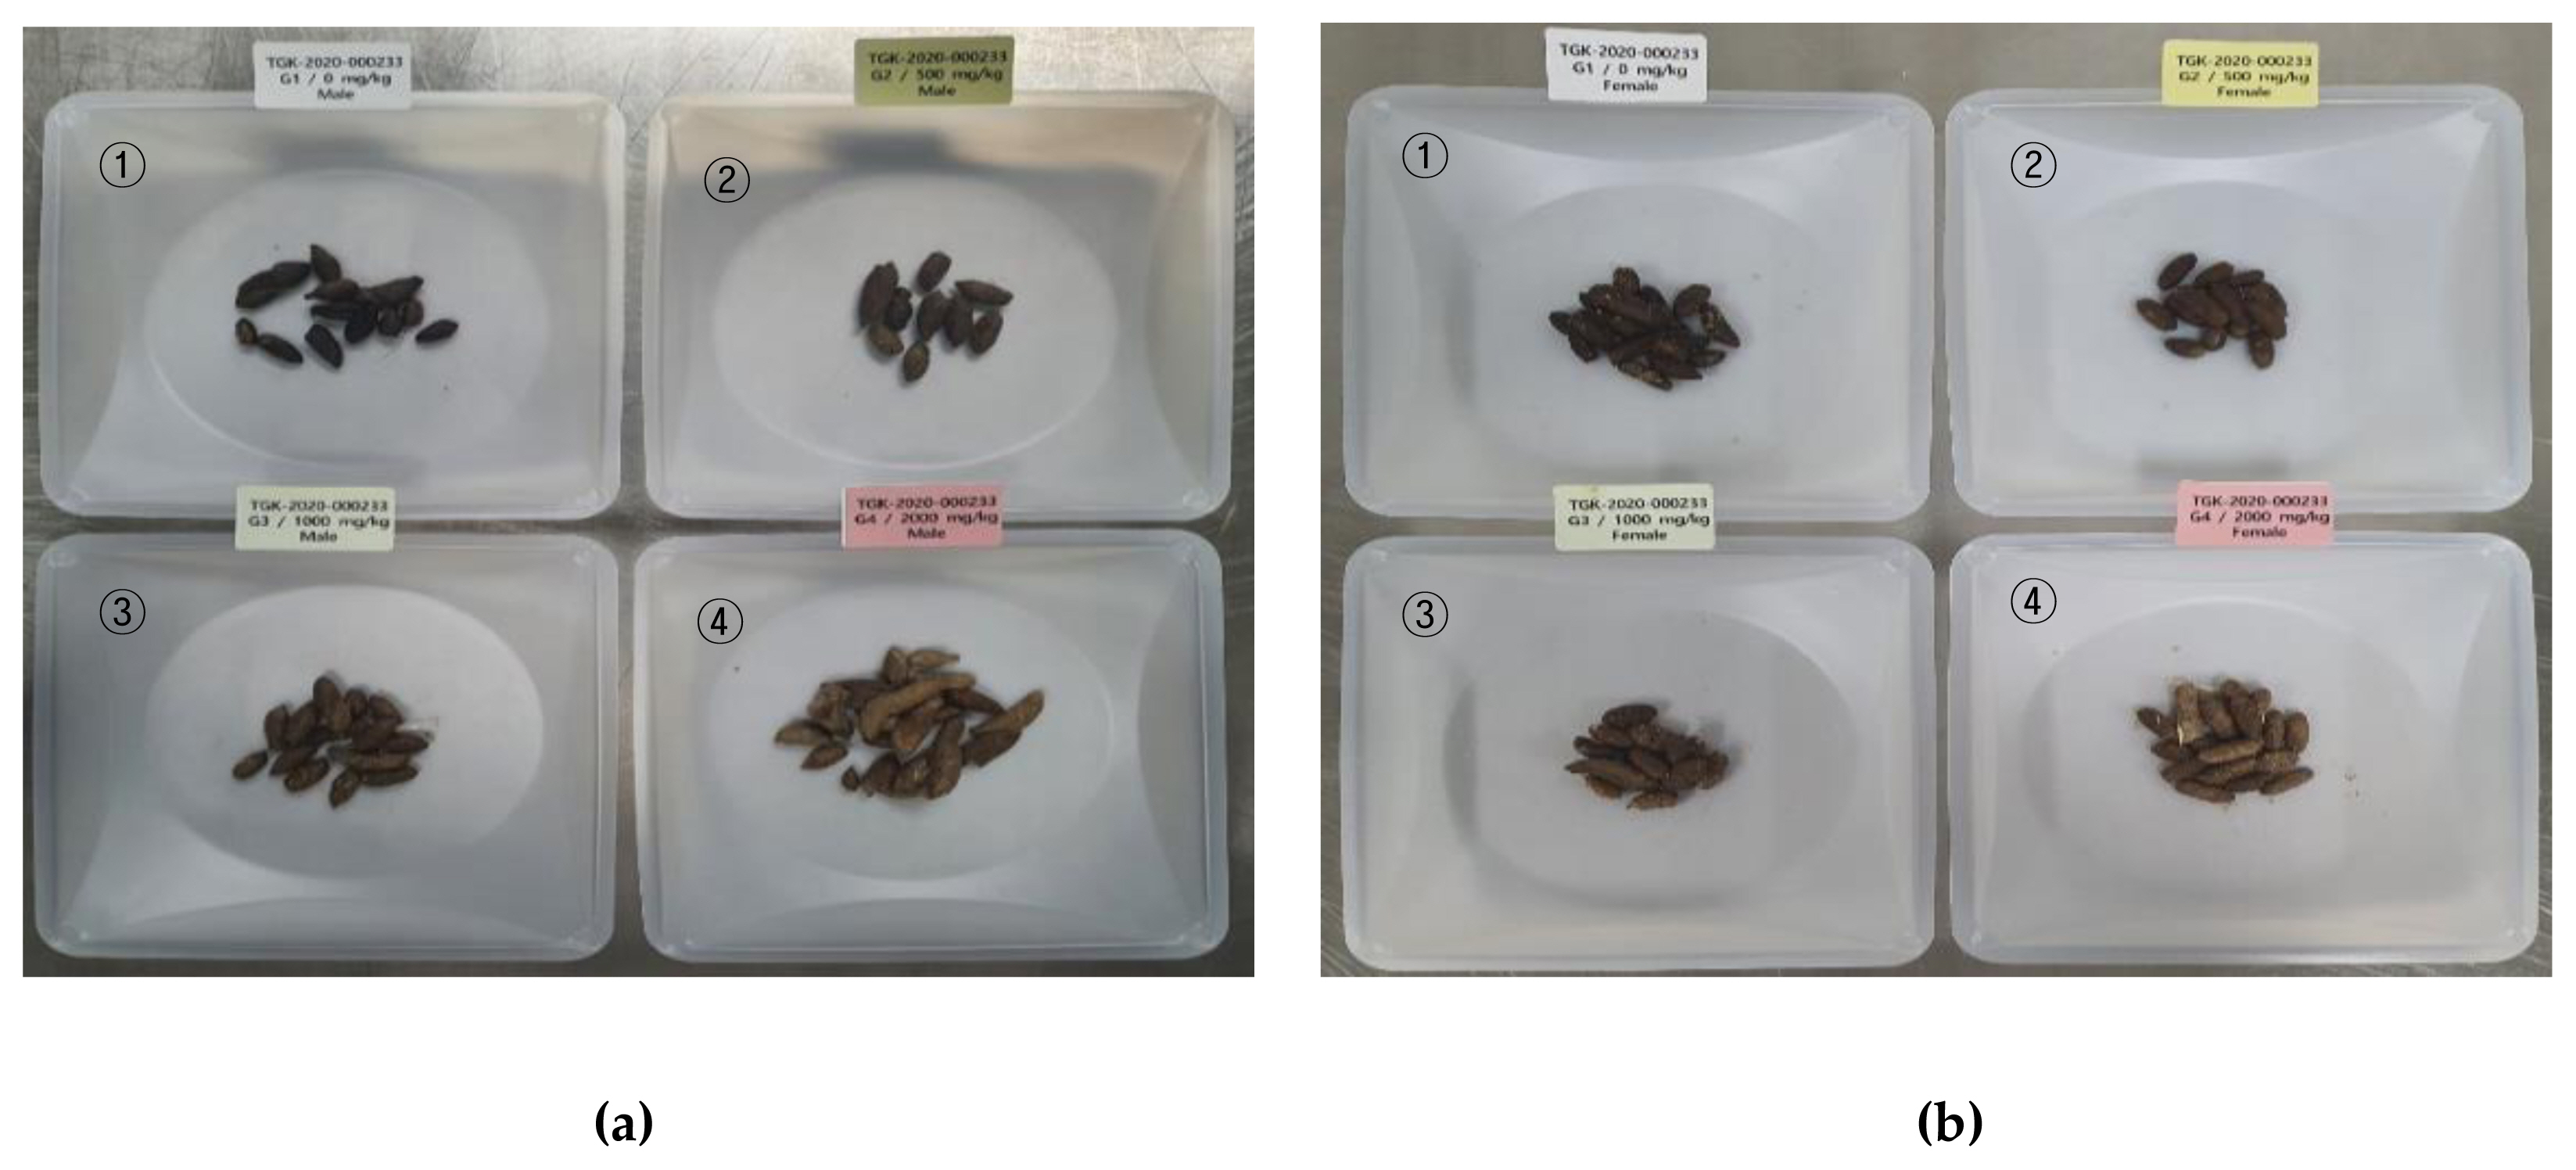
Compound-colored stool at treatment group (①: control group, ②: low dose, ③: middle dose, ④: high dose): (a) Male; (b) Female.
Heo et al. reported that no abnormal clinical sings were observed in any of treatment group (250, 500, 1000 mg/kg B.W/day) in the study of oral repeated dose 90-day in rats for TiO2 P25 (AEROXIDE® from Evonik Industries, 80:20 ratio of anatase and rutile, particle size range 14–21 nm, agglomerated/aggregated size: approximately 180 nm) [19]. Also, no significant adverse TiO2-related effects were observed on clinical signs in 90-day (100, 300, 1000 mg/kg B.W/day) in rats for synthesized TiO2 (d50=145 nm, 21% nanoparticles by particle number) via the chloride process with rutile type reported by D.B. Warheit et al [8]. It was thought that the difference between the clinical sign of previous publications and this study was observed due to difference in absorption by the various particle size.
Body weight and food consumptions
For the experimental period (90-day treatment period and 28-day recovery period), the body weight showed a normal increase and there were no treatment-related effects in food consumptions between the treatment and recovery group Figure 5.
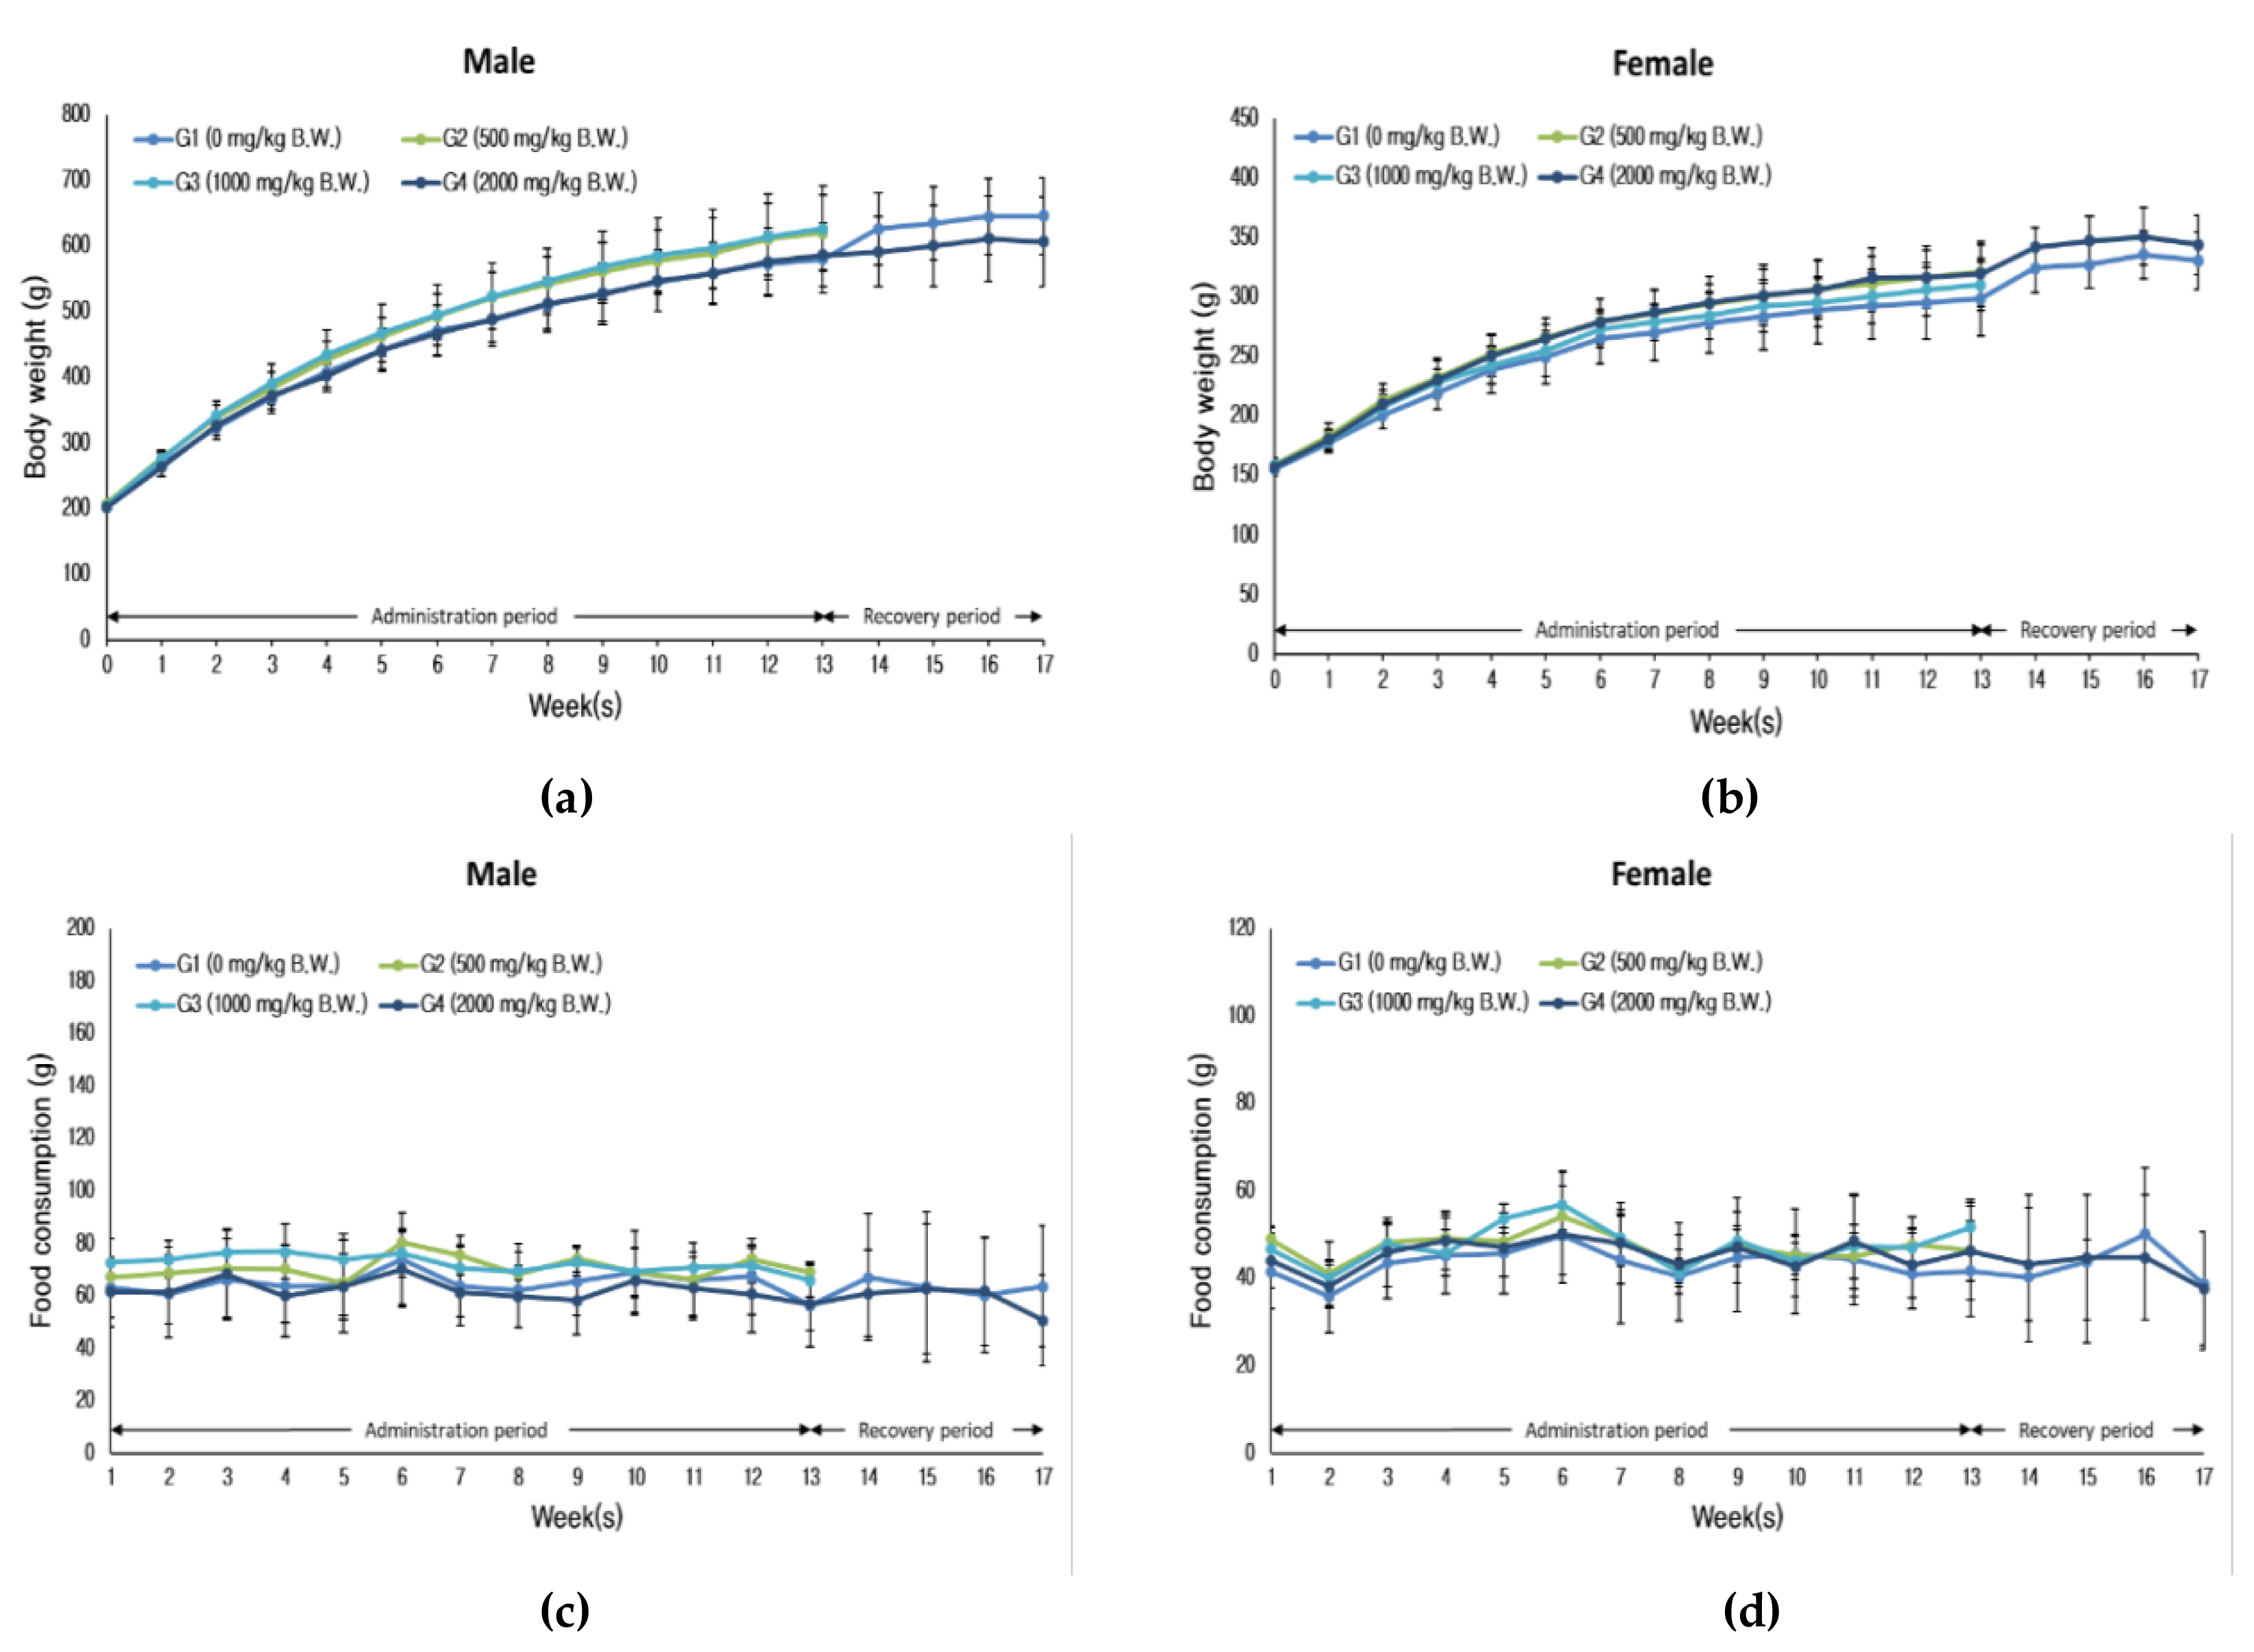
Changes for body weight and food consumptions: (a) body weight (male); (b) Body weight (female); (c) Food consumptions (male); (d) food consumptions (female).
Urinalysis
There were no treatment-related effects in both sexes in any of treatment group (data not shown).
Hematology, biochemistry and hormone analysis
There were no treatment-related significant effects in both sexes in any of treatment group as Tables 4,5 and 6. In some of studies, the orally administered TiO2 nanoparticles with size less than 100 nm may cause hepatic and renal toxicity as shown by the changes in the serum parameters (hepatic damage; total protein, glucose, AST, ALT, ALP/renal damage; blood urea nitrogen, uric acid) [4,20]. The significant changes for live or kidney were not observed in this study and it was thought to be due to difference in the particle size.

Hematological parameters
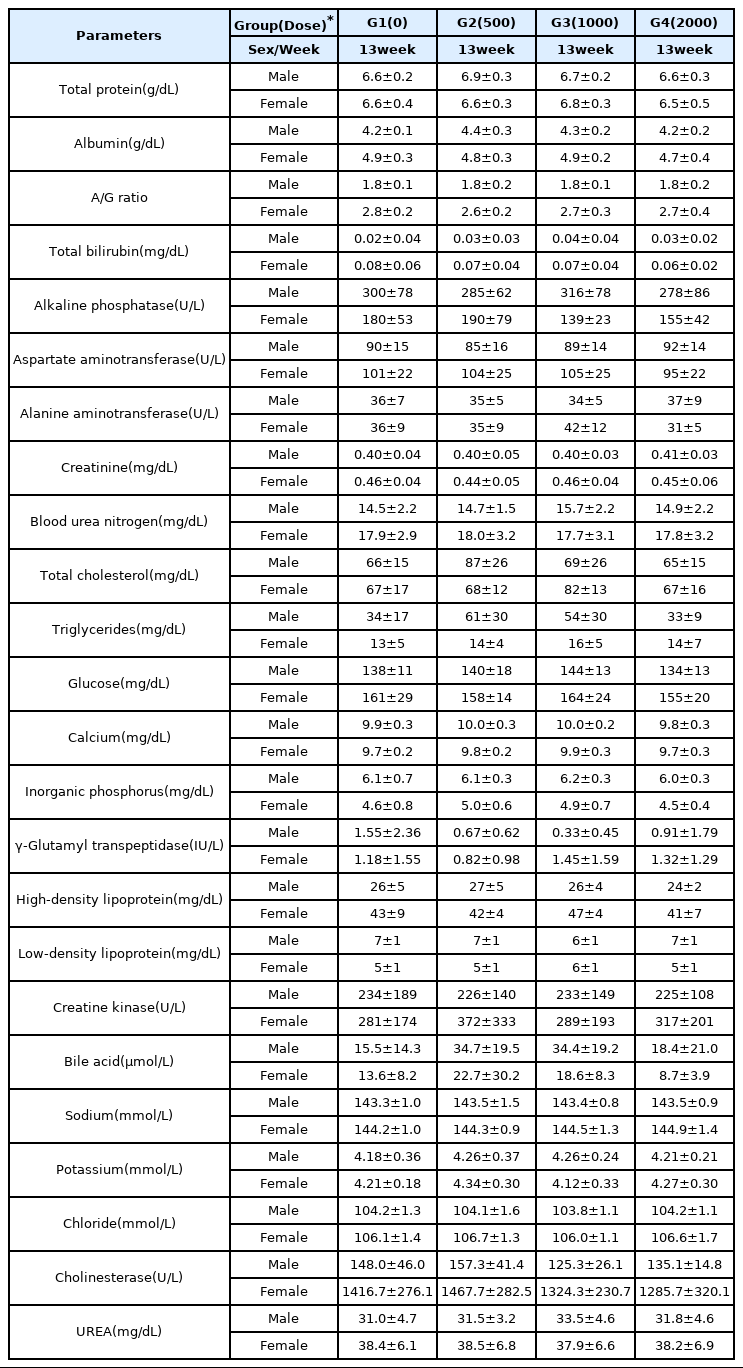
Blood chemical parameters.
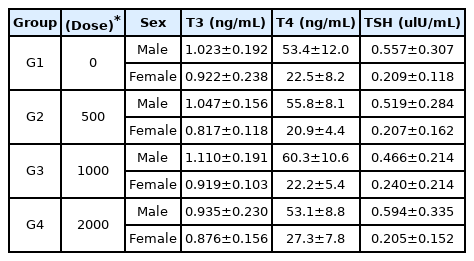
Hormone analysis
Necropsy and organ weight
At the end of treatment, the treatment-related gross finding (test substance retention) was observed in gastrointestinal tract for both sexes at treatment group Table 7 and no gross findings were observed in recovery group. These findings were thought to be minor absorption considering clinical sign (contaminant-colored feces). Also, in the absolute/relative organ weight, there were no treatment-related significant effects in both sexes in any of treatment group.
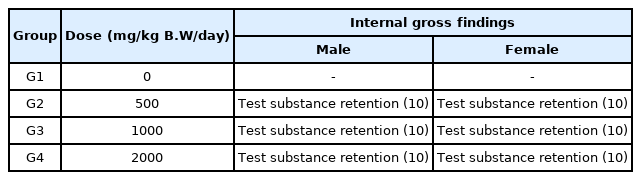
Summary of gross finding (test substance retention in gastrointestinal tract) for treatment group.
Histopathological examination
The histopathological examination was performed to identify the treatment-related effects for treatment group and recovery group. In gastrointestinal tract where gross finding was observed at necropsy, the foreign materials were observed in lumen of organs such as stomach, duodenum, ileum, cecum, colon and rectum in any of treatment group. Considering clinical signs, such as contaminant-colored feces, microscopic findings was considered that some of aggregated or agglomerated TiO2 was not absorbed and retention in digestive tract and then theses were excreted into feces Figure 6. But, this microscopic finding was not in other organ tissues.
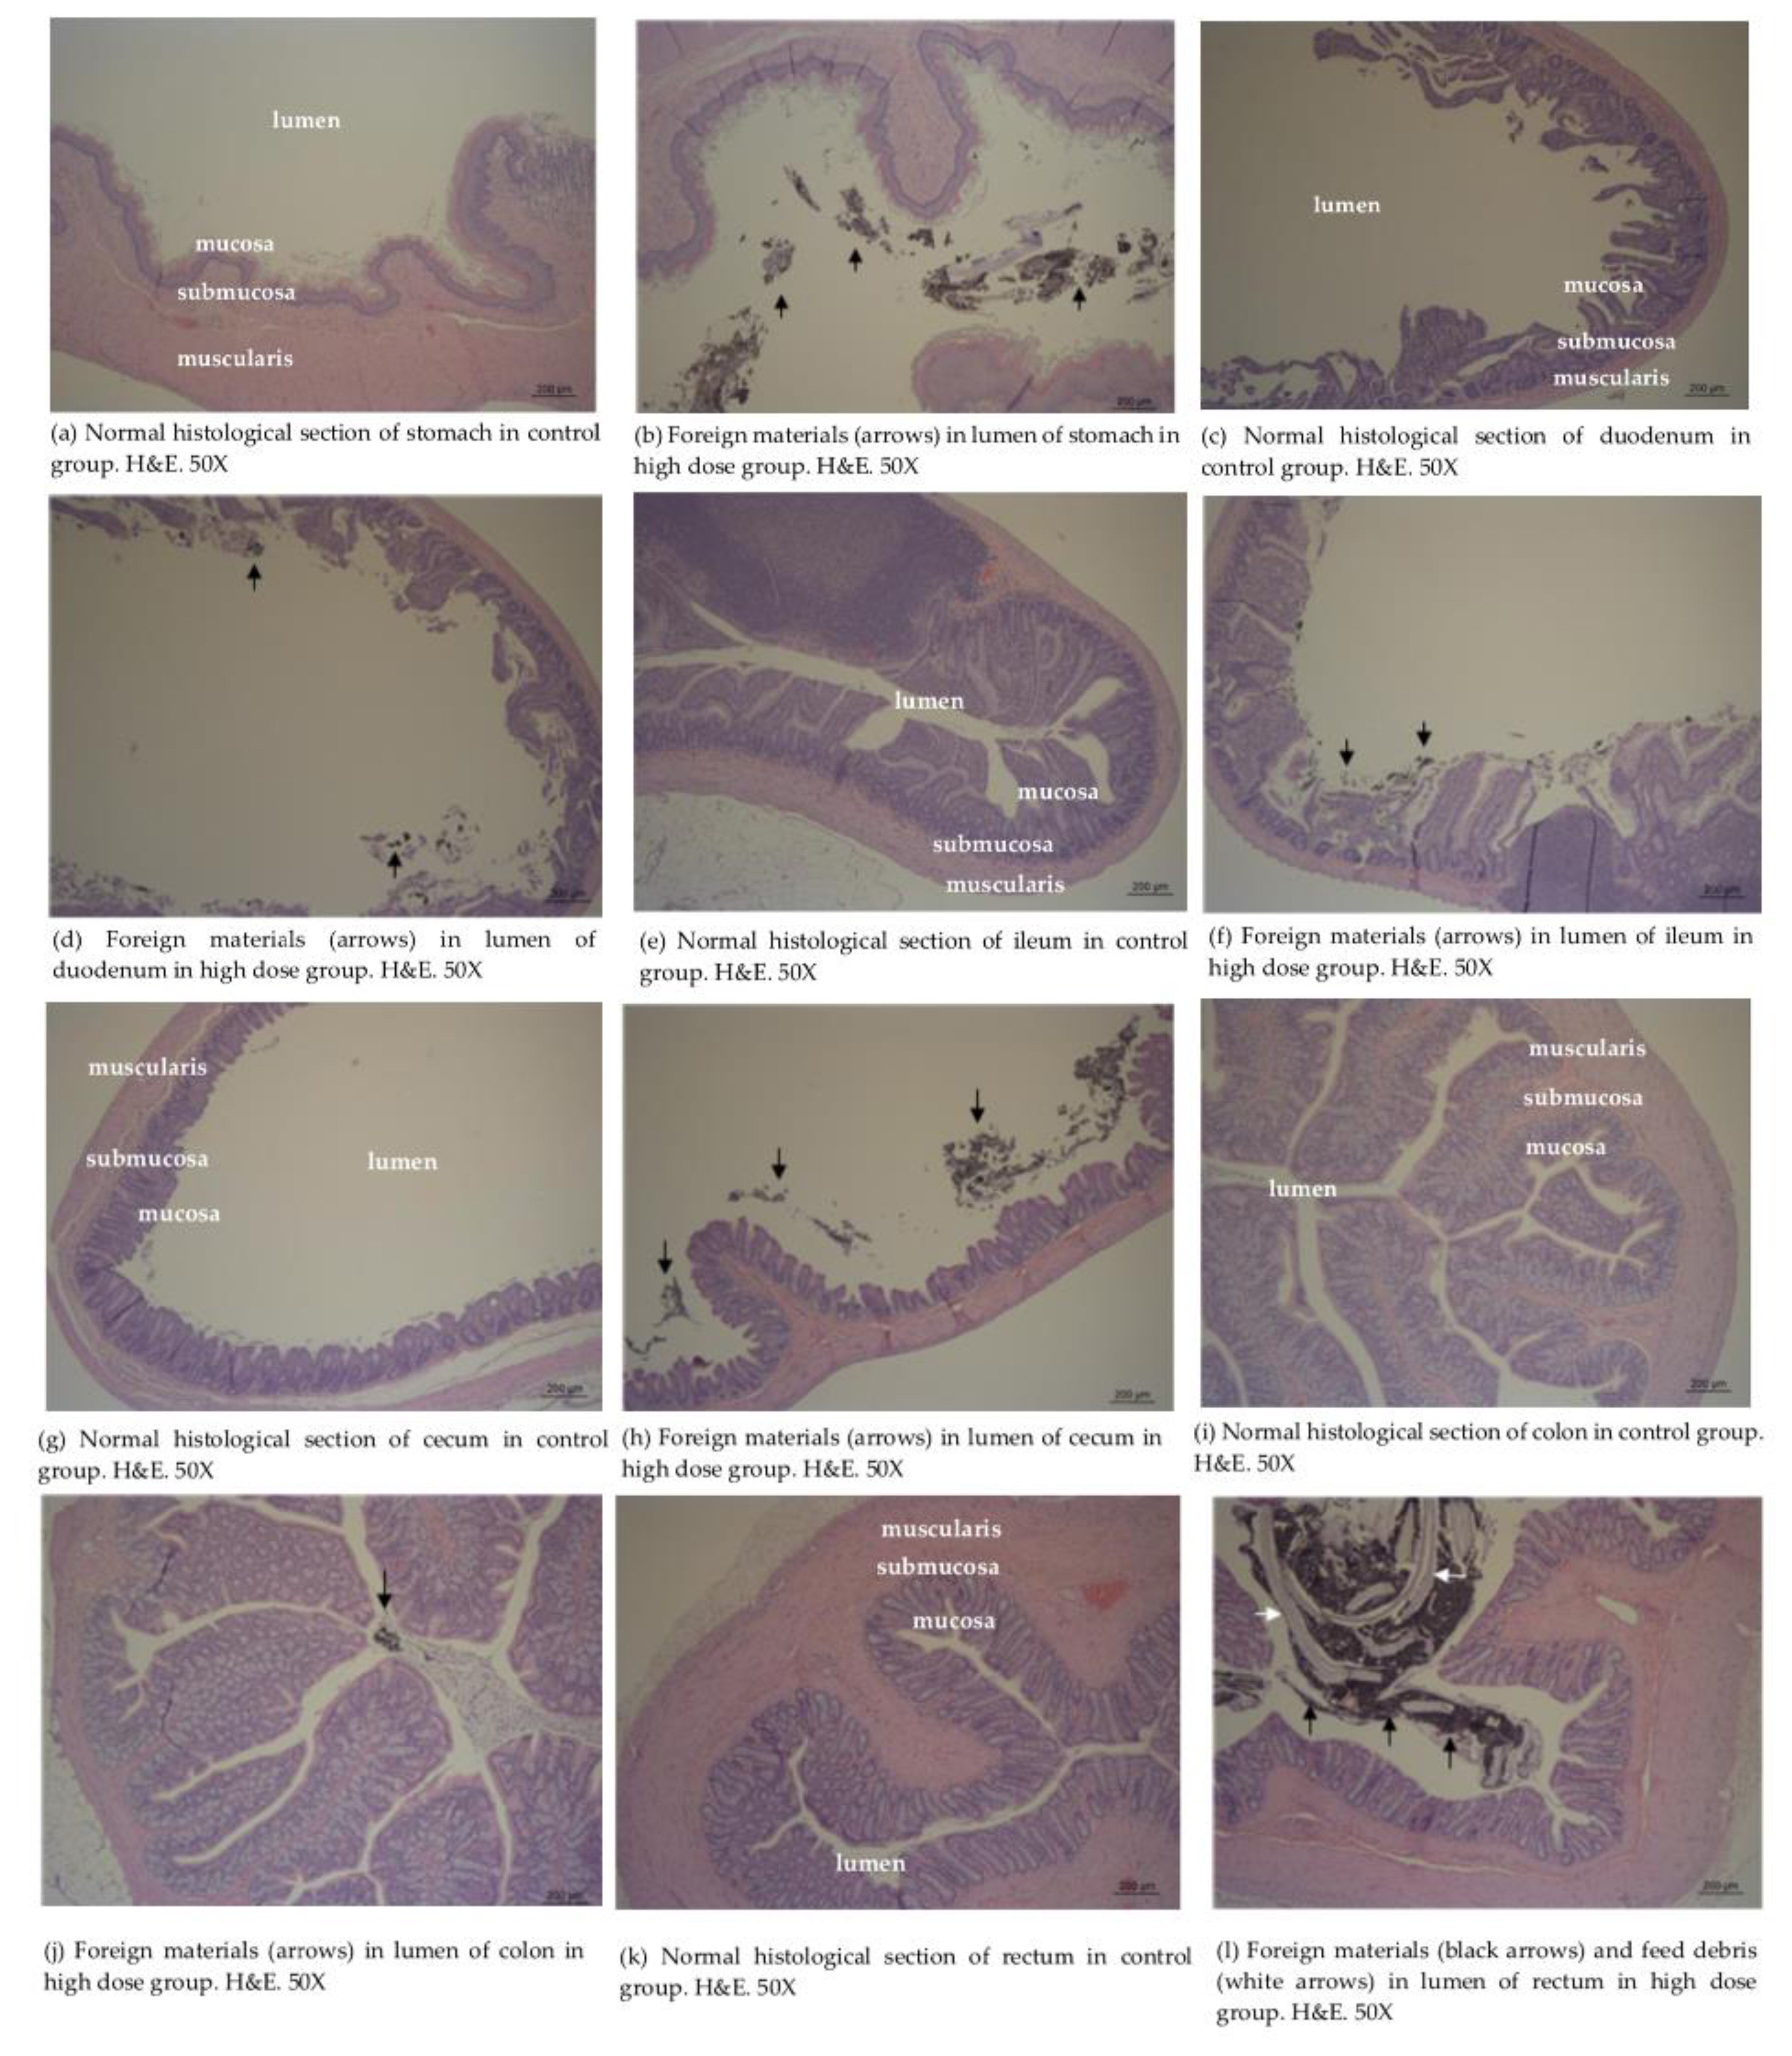
Histopathological findings examined in stomach (a, b), duodenum (c, d), ileum (e, f), cecum (g, h), colon (i, j) and rectum (k, l).
The similar finding was observed in 28-day/90-day repeated oral toxicities for synthesized TiO2 materials (173 nm and 145 nm) studied by D.B. Warheit et al. This study showed that the granular brown aggregates or clumps, likely indicative for the presence of TiO2 were seen upon hematoxylin & eosin staining in the digestive tract, draining lymphoid tissue without evidence of an adverse response [7,8]. But there were no TiO2-related findings (macroscopic/microscopic findings) in research for TiO2 P25 (average particle size range 14–21 nm) studied by Heo et al. [18]. These differences were thought to be due to the difference in absorption according particle size.
Also, considering retinopathy finding (presence of nanomaterials) observed in previous research of ZnO for 90-day in rats [21], we examined the eyes carefully including harderian gland and there were no TiO2-related effects as Figure 7 and it was considered to be due to the difference in absorption according particle size.
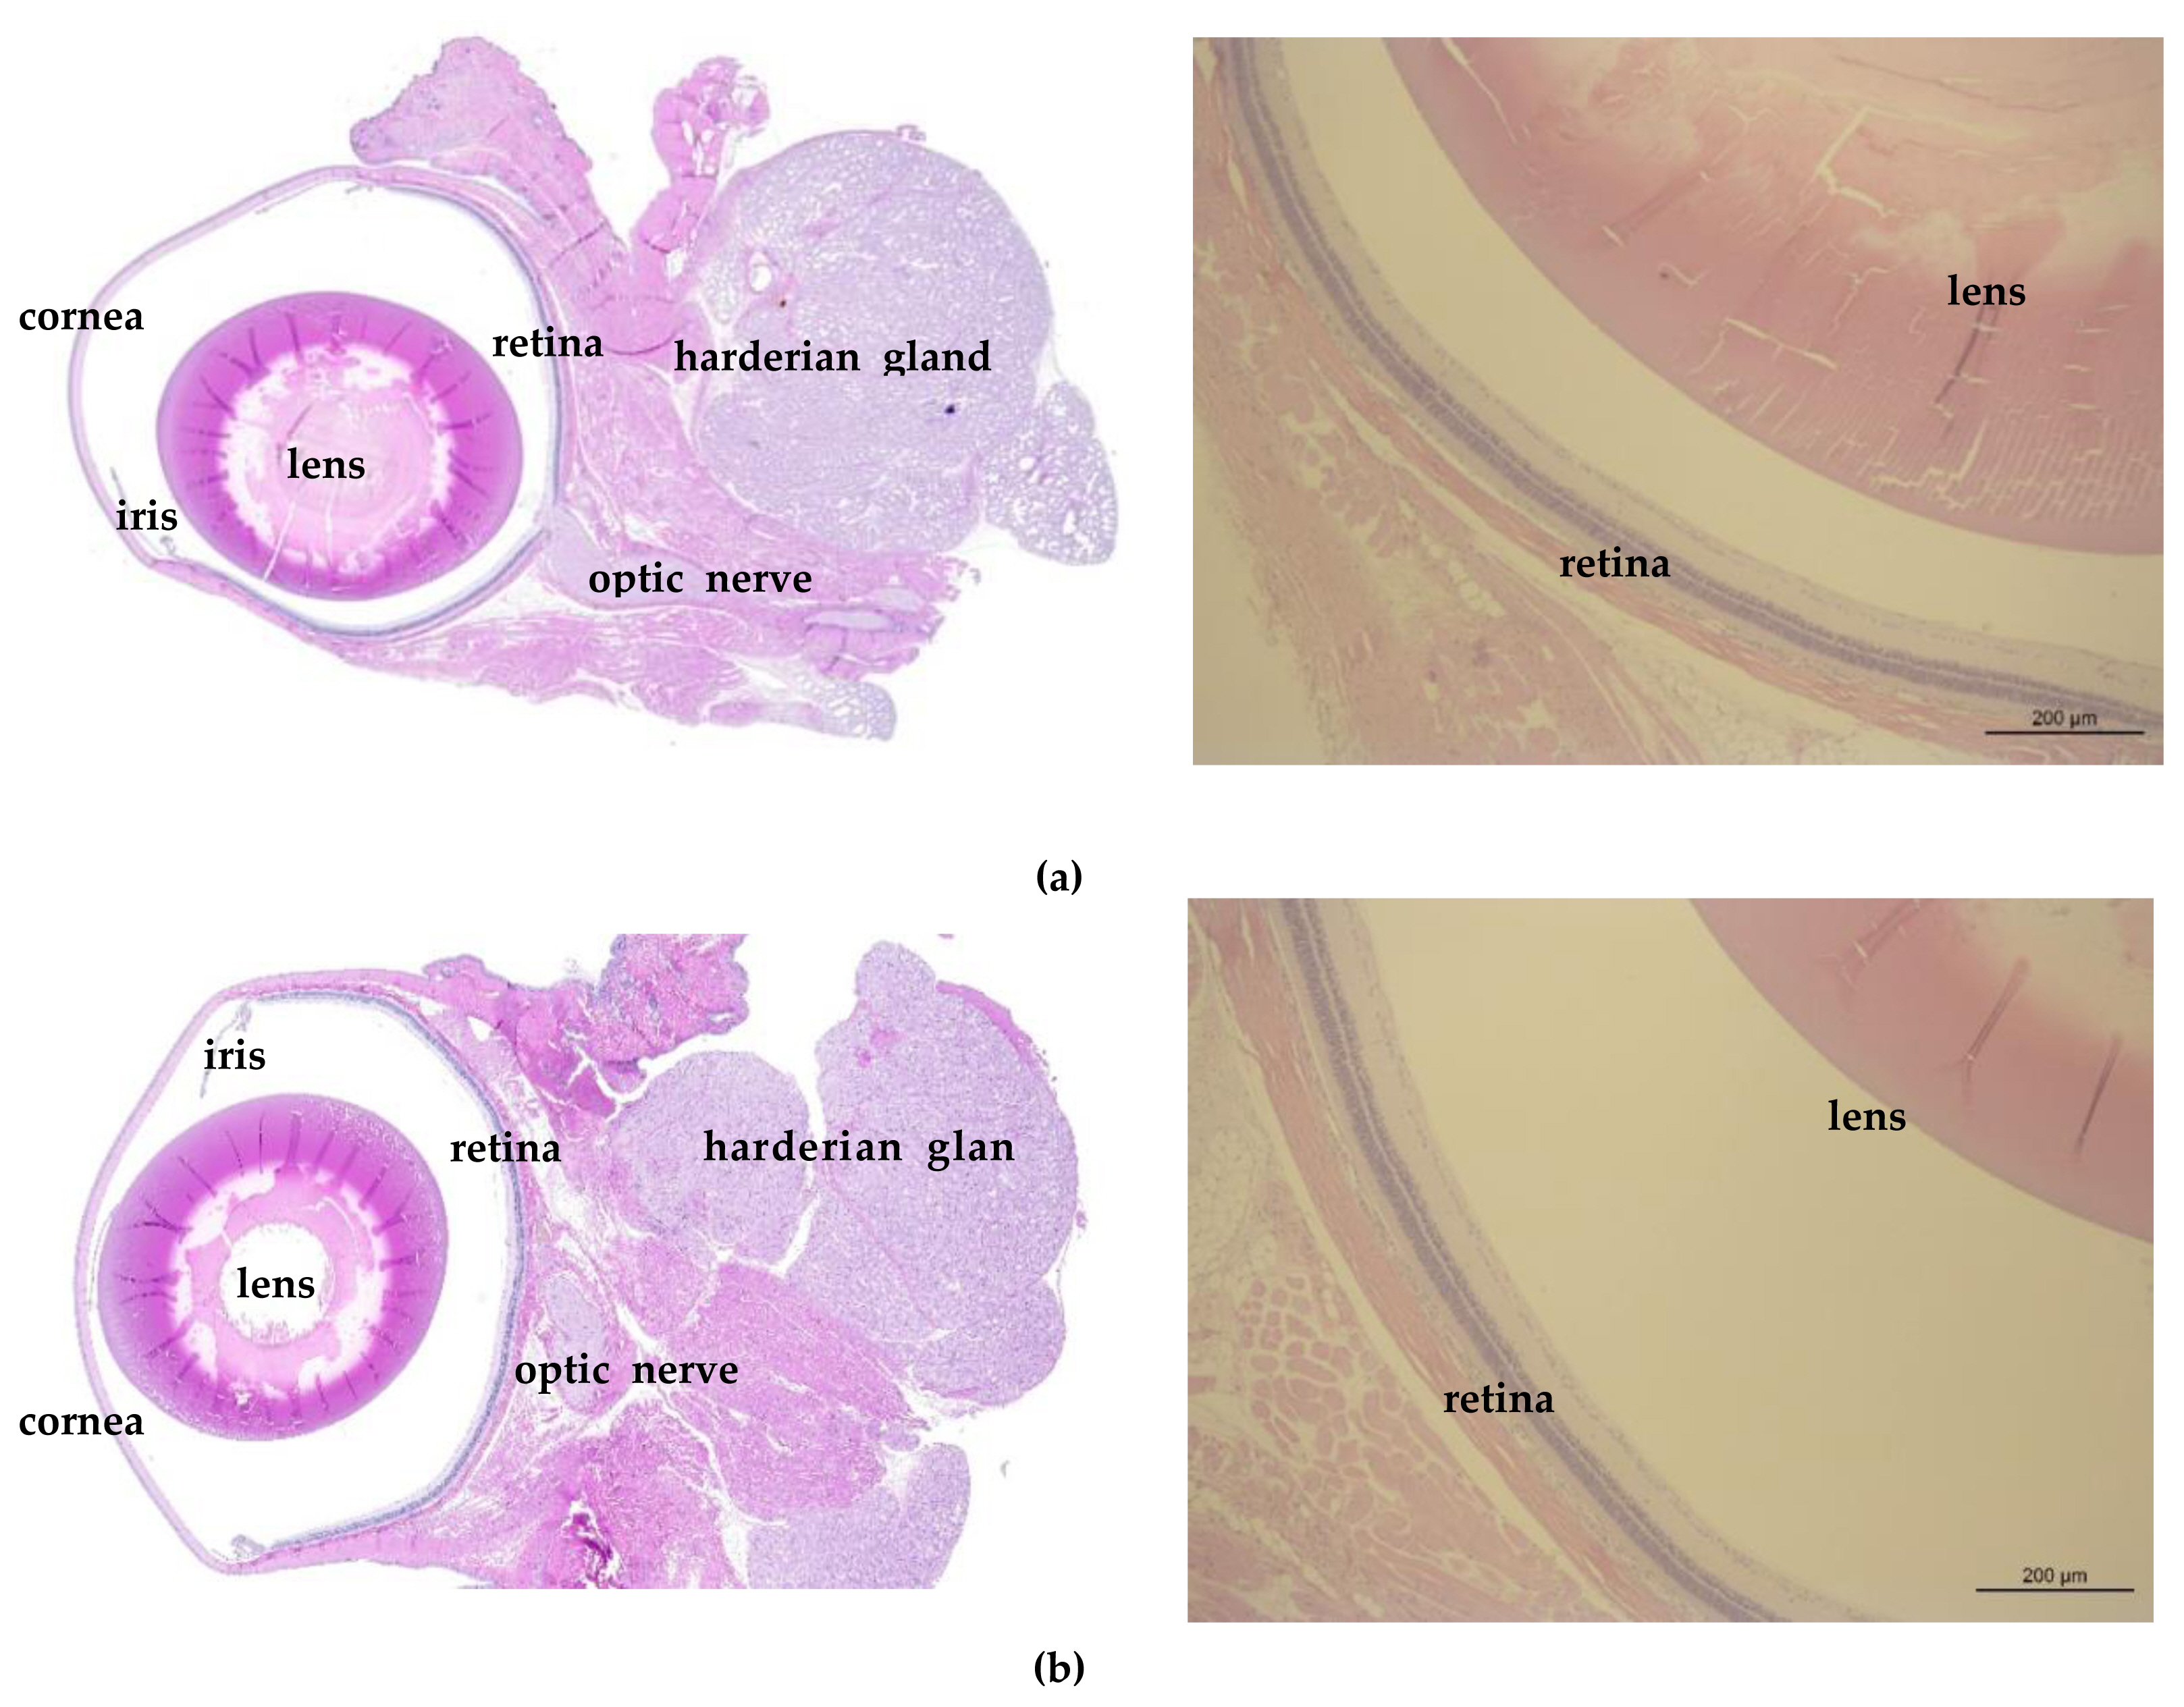
Eye photographs (Left: Slide scanner image, ZEISS Axio Scan. Z1, Right: Optical microscope, X50) including the corea, iris, lens, retina and accessory organs (optic nerve, harderian gland): (a) Control group; (b)High dose group.
Conclusions
This study was performed to investigate NOAEL (No Observed Adverse Effect Level) and evaluate the systemic toxicity for the test substance, new TiO2 (GST), manufactured to have cost-competitive lower than price of commercial material from sludge recycling of the sewage treatment plant, on male and female Sprague-Dawley rats. 90 days repeated oral dosing via gavage was conducted at dose levels of 0 (vehicle control), 500 (low dose group), 1000 (middle dose group), and 2000 (high dose group) mg/kg B.W/day. After observation, no test substance-related mortality was observed at any dose in male and female groups and there were no treatment-related effects in body weight, food consumption, urine analysis, ophthalmological test, hematological examination, biochemical examination, organ weight, gross necropsy and histopathological examination. However, it was thought that more studies (study for inhalation route or long-term study for dermal exposure, etc.) are needed to definitively comment on long-term use of new TiO2 materials and health effects.
In conclusion, adverse effect related with GST was not observed on male and female Sprague-Dawley rats followed by 90 days of administration period and 28 days of recovery period at dose levels of 0, 500, 1000, and 2000 mg/kg body weight, and target organ is not detected. Therefore, NOAEL of GST was considered to be 2000 mg/kg body weight in both sexes and the test substance was not detected in the target organs.
Acknowledgement
This work was supported by a grant (19SCIP-B145906-02) from the Korea Agency for Infrastructure Technology Advancement (KAIA) by Ministry of Land, Infrastructure and Transport of Korea government (MOLIT), Republic of Korea.
Notes
The authors declare that they have no conflict of interest.
CRediT author statement
SHK: Conceptualization, Methodology, Writing-Original draft preparation; MKP: Supervision, Writing-Reviewing and Editing; JKS: Methodology, Data curation; JMI: Visualization; HSS: Visualization; HJP: Resources, SSN: Project administration, Writing-Reviewing and Editing
References
Animal Protection Act. No 16544 [enforcement, 2019-08-27] (2019-08-27, partial revision). Republic of Korea.
Laboratory Animal Act. 15944 [enforcement, 2019-03-12] (2018-12-11, partial revision). Republic of Korea.