Identification of heavy metals source within selected active dumpsites in southeastern Nigeria
Article information

Abstract
Discriminating contaminant sources is crucial for pollution control. The study aimed at identifying the source(s) of heavy metals in active dumpsite soils from selected areas in Southeastern Nigeria using statistical tools. The dumpsites were Enyimba dumpsite Aba (dumpsite-1), Okpuno-Egbu dumpsite Nnewi (dumpsite-2), Rice mill dumpsite Abakaliki (dumpsite-3) and Nekede dumpsite Owerri (dumpsite-4) in Abia, Anambra, Ebonyi and Imo State respectively. After standard sampling, elemental analysis was carried out using an energy dispersive x-ray fluorescence spectrometer; Chromium (Cr), Manganese (Mn), Cobalt (Co), Iron (Fe), Nickel (Ni), Copper (Cu), Zinc (Zn), Arsenic (As), Lead (Pb) and Cadmium (Cd) were quantified and results showed they were present in high concentrations above control and standard values set by the National Environmental Standards and Regulations Enforcement Agency (NESREA) and the Food and Agriculture Organization of the United Nations (FAO) / World Health Organization (WHO). Metals investigated exhibited variable correlations among themselves suggesting potential multi-element contamination, while soil organic matter (OM) and pH displayed both significant positive and negative influence on the metal availability in the studied soils. Test of significance of the observed correlation were positive and significant (r > 0.9 at p < 0.05/0.01) for Cr/Co, Cr/Fe, Mn/Co, Co/Fe, Cu/Zn, Zn/Pb, Cu/As, Cu/Pb, Zn/As, As/Pb in dumpsite-1; in dumpsite-2, only Ni/Cu; in dumpsite-3, Fe/OM and Cd/OM while in dumpsite-4,Co/Fe, Cu/As, Cu/Pb, Zn/Cd, Ni/OM, and As/Pb. Hierarchical cluster analysis (HCA) and Principal component analysis (PCA) extracted two to three components/groups based on square Euclidean distance and eigenvalues > 1, confirming sources to be from organic pigments in plastics, scrap metals and incinerated biodegradable wastes. This study concludes that statistical methods can provide a scientific basis for monitoring heavy metals accumulation in dumpsite soils.
Introduction
The impact of waste on health and the environment has been an issue of global concern over the years [1]. Wastes are sources of environmental pollution through the introduction of toxic substances above their threshold limit into the environment. However, in Nigeria, most of the active dumpsites are now located within the city due to population influx and expansion [2,3]. Recent studies have shown that waste disposal on dumpsites introduces additional heavy metals into surrounding soil [2]. Soil is a natural reservoir of metals whose concentration is associated with several factors such as parent material, pH and organic matter (OM) [3]. In the last few decades, metal contents in soils have risen to dangerous levels mainly due to human activities such as industrialization and urbanization [4]. The properties and qualities of soils can be adversely affected by the high concentration of municipal wastes released from homes, schools, offices [5]. In many cities of the developing world, the increment of waste has led to environmental pollution and degradation [6]. It was estimated that in 2006 the total amount of waste generated globally reached 2.02 billion tons, representing a 7% annual increase since 2003 [6]. Global generation of waste between 2007 and 2011 raised by 37.3%, equivalent to a roughly 8% increase per year according to [6]. In some developing countries like Nigeria, areas with high refuse disposal rate are associated with high population density, increased commercial and industrial activities. These areas have developed without proper planning and it has led to the presence of waste dumps within built-up areas inhabited by millions of people. Consequently, such waste dumps become a point source for soil pollution as they serve as a host for leachate from dumpsites [7,8,9]. Considering the rising level of heavy metals in soils, the knowledge of the heavy metals accumulation in soil, the origin of these metals and their possible interactions with soil parameters have become priority objectives in most environmental monitoring [10,11,12]. Statistical methods such as correlation analysis (CA), principal component analysis, hierarchical cluster analysis (HCA) and analysis of variance (ANOVA) have been widely used to investigate heavy metal concentration, accumulation and origin in dumpsite soils. CA was used to quantitatively analyze and confirm the relationship between soil pH, OM and heavy metals concentration [13,14]. Principal component analysis (PCA) was adopted to assist the interpretation of elemental data. This method allows identifying the different groups of metals that correlate and thus can be considered as having a similar behavior and common origin [13,14,15]. HCA was used to find groups among metals based on Square Euclidian Distance (SED). ANOVA was conducted to reveal the most significant factor controlling the spatial differences in heavy metals concentration between the studied dumpsite soils [13]. This study is aimed at determining, using statistical methods, the most significant factor controlling the distribution of heavy metals and to identify the possible origin (source) of these heavy metals in soil samples collected from four selected active dumpsites in Southeastern Nigeria. It is hoped that this study would provide a scientific basis for pollution control and further monitoring of heavy metals accumulation in the studied dumpsites.
Materials and Methods
Study area
This study was conducted in four major cities in Southeastern Nigeria namely: Abakaliki, Ebonyi; Owerri, Imo; Nnewi, Anambra; and Aba, Abia (Figure1). Southeastern Nigeria has two distinct seasons (wet and dry seasons) [16]. Rainy (wet) season lasts between 8−9 months while the dry season is of shorter duration between 3−4 months [16]. Based on geographical location, the climate is tropical rainy, and the region experiences abundant rainfall with very high temperatures. The annual temperature ranges from 26 to 29ºC [16]. The selected active dumpsites for this study are Enyimba dumpsite in Aba, Okpuno-Egbu dumpsite in Nnewi, Rice mill dumpsite in Abakaliki and Nekede dumpsite in Owerri. Enyimba dumpsite is located in Aba, the commercial hub of Southern Nigeria (Figure 2) [16,17]. The high number of markets, industries and fabricating companies in the area has resulted in high population density and consequently, high accumulation of wastes [17]. The dumpsite is an open dumpsite and its proximity to schools, offices, markets and industries in Aba gave rise to the huge amount of wastes dumped there on a daily, weekly and monthly basis. Also, the dumpsite is a low land and is drained by Imo and Aba rivers and their tributaries [16,17]. Okpuno-Egbu dumpsite is situated along Okigwe-Oba-Onitsha road, Nnewi. The dumpsite was approved by the state government for the disposal of wastes generated from industries and fabricating companies, markets, schools, residential houses and offices within the area. Wastes generated from this city are about 3000 tons/day, which ought to have increased over the years [16,18]. Rice mill dumpsite is located along old Ogoja road Abakaliki. The major wastes found in the dumpsite are agricultural wastes [16]. The major occupation of the residents in this area is farming and they dump all sorts of their agricultural wastes there. Also, the Rice mill dumpsite is used extensively for cultivating varieties of edible vegetables and arable crops [18]. Nekede dumpsite is located along Owerri-Aba express road, close to the Nekede mechanic village. The area of the dumpsite is about two hectares [19], bound by two rivers, Otamiri to the east and Nworie on the south [19] and is surrounded by a stretch of residential buildings and farmlands [19]. The dumpsite is the biggest and the most active in Owerri metropolis; a large volume of all sorts of wastes are dumped there [16,19,20]. The major wastes found there are wastes from households, markets, hotels, offices, schools, industries and hospitals [16,19,20].
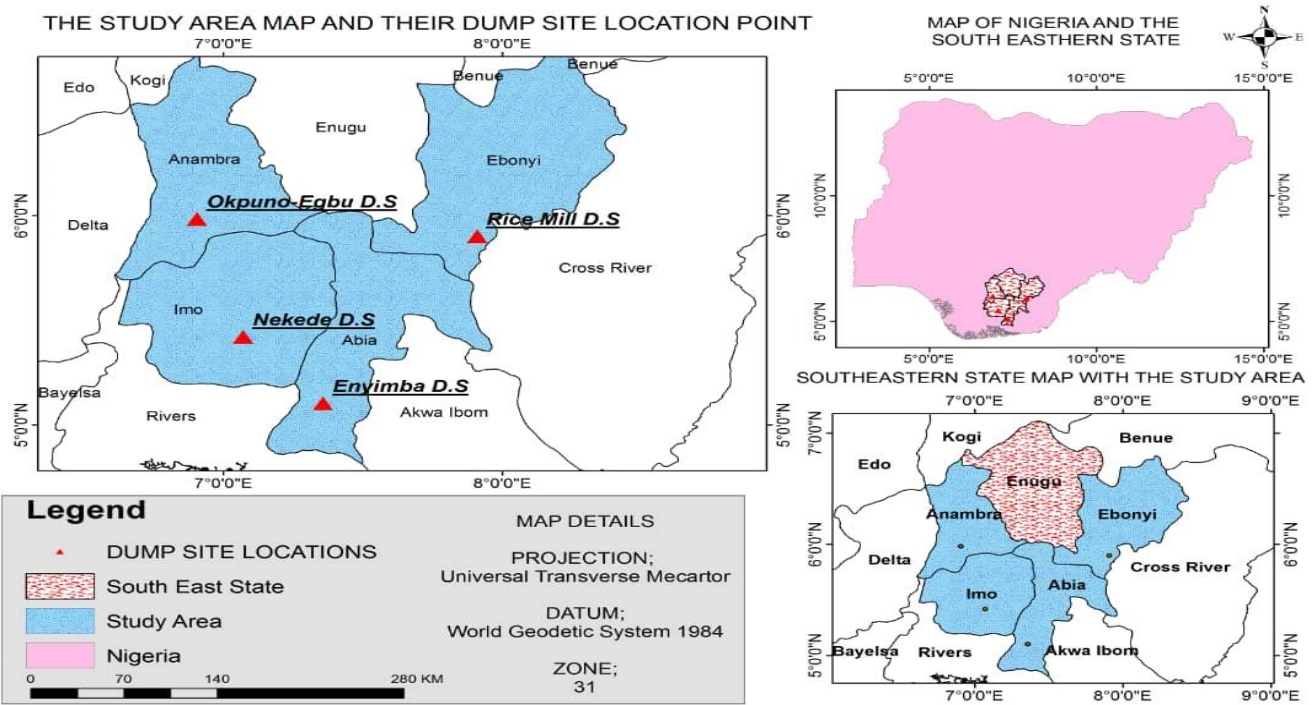
Map of the study area and their dumpsite location points.
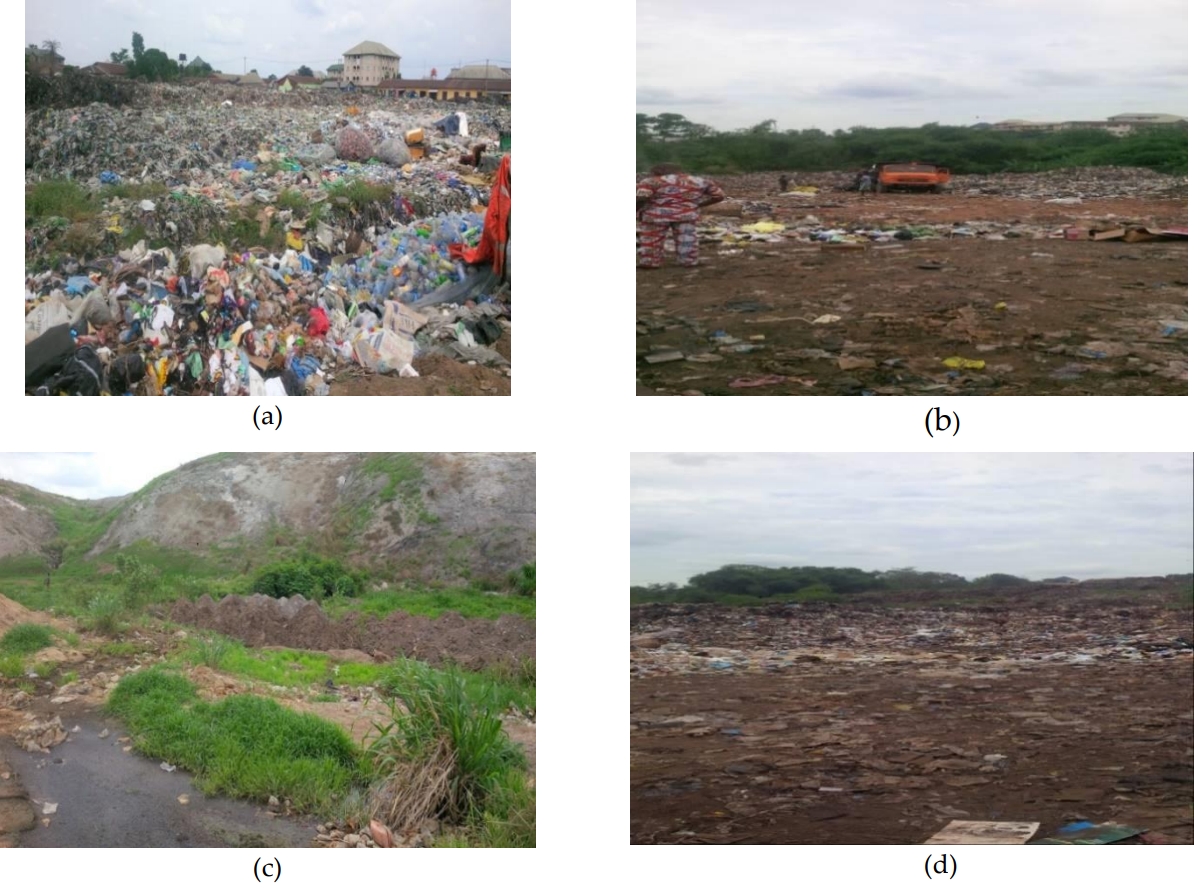
Photographs of studied dumpsites, (a) Dumpsite 1 (Enyimba), (b) Dumpsite 2 (Nnewi), (c) Dumpsite 3 (Rice mill), and (d) Dumpsite 4 (Nekede).
Sample collection, preparation and analysis
Soil samples were collected from the four selected active waste dumpsites according to Yuan et al. [16]. Each of the dumpsites was divided into four locations; north, east, west and south. Sampling errors were minimized by collecting quintuplicate sub-samples 10 m apart from each other within the sampling location using a soil auger at a depth of 0-20 cm. The soil auger was cleaned after soil sampling at each sample location using distilled water. The sub-samples were pooled together to form a composite sample which was taken to give a true representation of each sampling location in the dumpsite. The soil samples were stored using polythene bags and appropriately labeled. Control soil samples were collected 20 km away from each of the studied dumpsites where there was no form of human activities that could generate wastes. A total of eighty sub-samples and four control samples were obtained for this work. Sample collections were done in the month of March, during the dry season to avoid leaching of metals into sub-soil. The soil samples were pulverized using an agate mortar and pestle, then sieved to fine particle sizes of about 0.75μm with test-sieves with vibratory electronic sieve shaker to reduce soil matrix effects [21] until the water content of the samples was fully expelled and ready for elemental analysis.
The elemental analysis was carried out using EDX3600B x-ray fluorescence spectrometer with analysis accuracy (precision): 0.01 – 0.05% deviation and analytical range of element content (detection limit): 0.0001 (1ppm) – 99.99%, plating thickness measurement comprised of ≥11 layers with diameter up to 0.005μm each layer, measurement time ranged from 60s to 200s with an energy resolution of 150±5 eV, tube voltage ranged from 5 kV to 50 kV and current in the range of 50 uA to 1000 uA. The equipment EDX3600B x-ray fluorescence spectrometer applies XRF technology to conduct fast and accurate elemental analysis and qualitative characterization. The system detects elements between magnesium (Mg) and uranium (U) with high resolution and fast analysis of which the heavy metals of interest, chromium (Cr), manganese (Mn), cobalt (Co), iron (Fe), nickel (Ni), copper (Cu), zinc (Zn), arsenic (As), lead (Pb) and cadmium (Cd), were detected and quantified. Following the same protocol as the samples, standard reference material (SRM 2783) filter from the National Institute of Standards and Technology (NIST) was analyzed for elemental concentrations and compared with their certified values to validate the analyses and results were found within ±5% of the certified values.
Methods of Soil Parameters Assessment
Soil pH
Soil pH was determined in the suspension of 1:2.5 soil to water ratio using a calibrated pH meter (Hannah checker plus pH meter) according to the method described by literature [30].
Soil organic matter (OM)
OM content of the soil was determined according to the method described by literature [31].
Data Analysis
The data generated from heavy metal concentrations and selected soil parameters were analyzed using IBM SPSS (statistical software for social sciences) version 20.0 and MS-Excel 2007. CA, PCA, HCA and ANOVA were used. CA measured the interdependence of the set of variables under investigation, PCA and HCA helped to reduce the dataset into groups to help understand interrelated parameters, ANOVA assisted in determining why there are differences in heavy metals concentration between the studied dumpsite soils.
Results and Discussion
pH and organic matter (OM) content of the soil
The results for pH and OM for the different dumpsites are presented in Table 1. OM content of the studied dumpsites ranged from 4.23% to 12.82% with a mean of 8.62 and a standard deviation of 3.21. Okere et al. [22] attributed the high OM content of soils to the presence of a high quantity of biodegradable waste materials. The mean pH of the studied soil ranged from 7.0 – 7.6. Eze et al. [28] stated that soil pH in the range of 6 to 8 is often considered normal or neutral and good for crop growth. Similar results were reported for dumpsite soils studied by other researchers [4,10,17,19,21]. The alkaline pH of the soil was due to the decomposition of waste in the dumpsite, causing an increase in OM, and thus a reduction in H+ on the soil exchange complex [28,35].
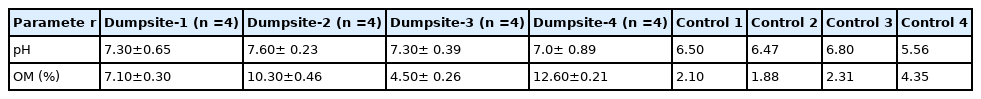
pH and organic matter (OM) of soils from the dumpsites
Elemental analysis
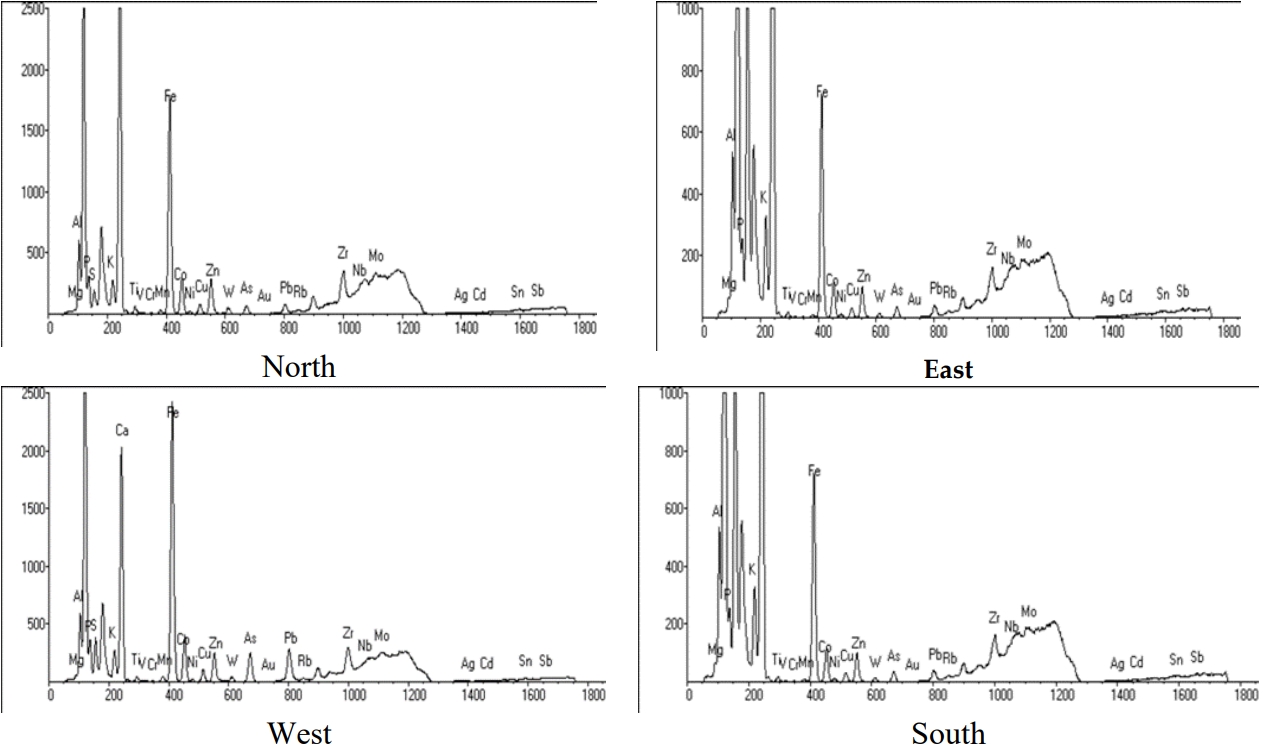
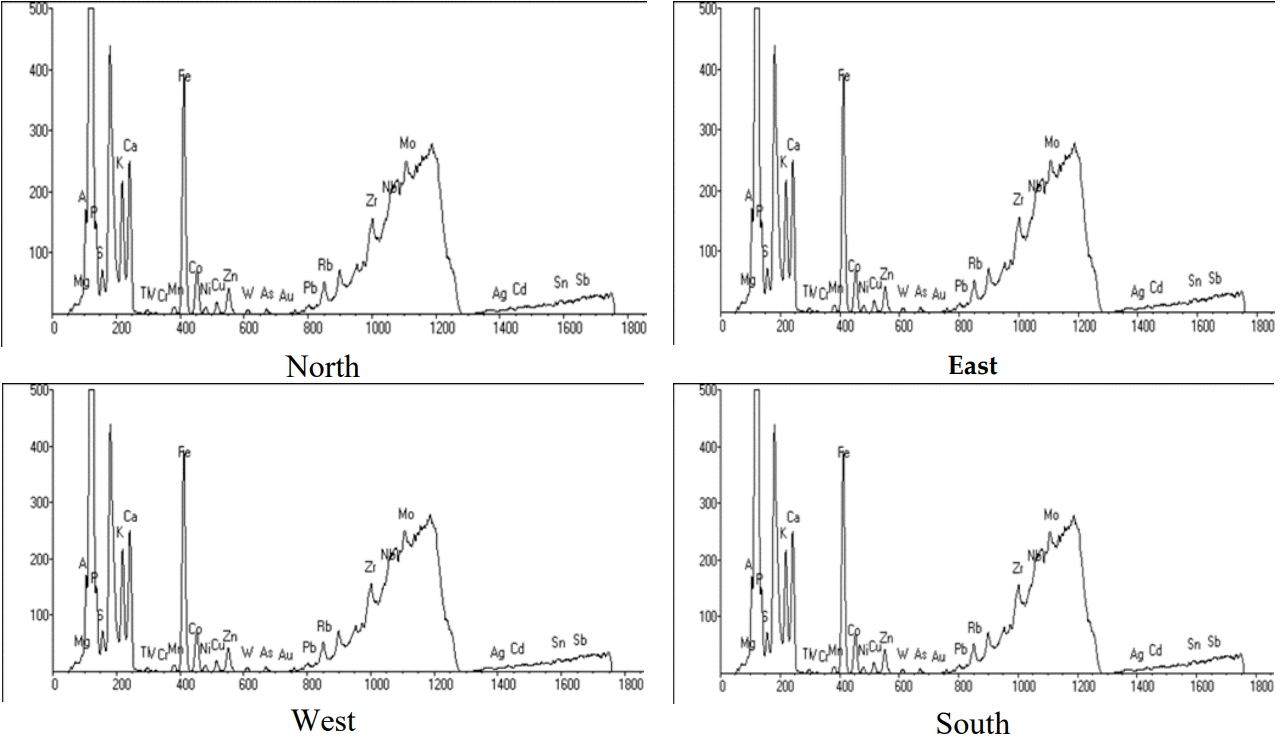
The Energy dispersive x-ray fluorescence (EDXRF) scans for soil samples are presented in Figure 3-6 while the mean concentrations in mg/kg of heavy metals (Cr, Mn, Co, Fe, Ni, Cu, Zn, As, Pb and Cd) from four different locations (north, east, west and south) within the studied dumpsite soils are shown in Table 2. The mean concentration of Cr ranged from 51.80 mg/kg to 271.50 mg/kg in the studied dumpsite soils which was relatively higher than 100 mg/kg stipulated for Nigerian soil by the National Environmental Standards and Regulations Enforcement Agency (NESREA) [25] except in dumpsite-3. Mn mean concentrations recorded in the various dumpsites studied ranged from 270 mg/kg to 1006 mg/kg which was above the Food and Agriculture Organization of the United Nations (FAO) / World Health Organization (WHO) [26] permissible limit of 200 mg/kg for soils. The mean concentration of Co recorded in all the studied dumpsite soils ranged from 387.5 mg/kg to 1337.5 mg/kg which was higher than the range (54.40 mg/kg to 100 mg/kg) reported in all the control sites indicating an additional source of the metal in the environment. The mean concentration of Fe within the studied dumpsite soils ranged from 4685 mg/kg to 90365.5 mg/kg. This was higher than the values obtained in the control sites except for control site-3 (12143 mg/kg) which had high Fe content. Also, the mean concentration of Fe reported in the studied dumpsite soils were higher than 400 mg/kg recommended by FAO/WHO [26] for Nigerian soils. The mean concentration of Ni within the studied dumpsite soils ranged between 367.8 mg/kg and 593.3 mg/kg which was relatively higher than 70 mg/kg stipulated for Nigerian soil by NESREA [25] and that of the control sites (4.41 mg/kg to 34.60 mg/kg). The mean concentration of Cu in the variously studied dumpsites ranged from 389.8 mg/kg to 21898.8 mg/kg which was higher than the control sites which ranged from 3.56 mg/kg to 54.20 mg/kg. The mean concentrations of Cu in each of the dumpsites were also higher than the stipulated100 mg/kg permissible limit of Cu in Nigerian soil by FAO/WHO [26]. The mean concentration of Zn in the studied dumpsites ranged from 1304.3 mg/kg to 3419.5 mg/kg. However, all the dumpsite studied recorded mean values of Zn that were above the permissible limit of Zn (421 mg/kg) in Nigerian soil according to NESREA [25]. Udosen [27] reported that zinc is an abundant and nutritionally important element essential for humans and can only become toxic at high concentrations. The mean concentration of As recorded in all the studied dumpsite soils ranged from 192.8 to 447.8 mg/kg which were higher than the FAO/WHO [26] permissible limits of 20.0 mg/kg for Nigerian soils and the control sites. The mean concentration of Pb in the studied dumpsites ranged from 195.3 mg/kg to 3526 mg/kg which were higher than the control sites which ranged from 7.30 mg/kg to 122.2 mg/kg. This indicates an additional source of metal in the studied dumpsite soils. The mean concentrations were also higher than the limit for Pb (164 mg/kg) in Nigerian soils according to NESREA [25]. The mean concentration of Cd in the studied dumpsite soils varied between 0.3 mg/kg to 0.8 mg/kg which was within the recommended limit of 3 mg/kg for Cd in Nigerian soils by NESREA [25]. The moderate concentration of Cd in the studied dumpsite soils could be due to mild enrichment by heavy metals in the dumpsites studied. Qishlaqi and Moore [14] noted that cadmium is a hazardous heavy metal that is of no use to biological systems. Comparing the results obtained to another study, Ebong et al. [15] obtained lower values in most of the heavy metals assessed (except for cadmium) while a similar heavy metal concentration was reported by Eze et al. [17]. Duru et al. [36] reported higher values in the assessment of heavy metals in soils from a reclaimed section of Nekede mechanic village. Generally, the range obtained for heavy metals in dumpsite-3 is lower than the range reported for other dumpsites in this study. This could be attributed to the discrepancy in age of dumpsite, volume and type of waste materials as reported by Ebong et al. [15].
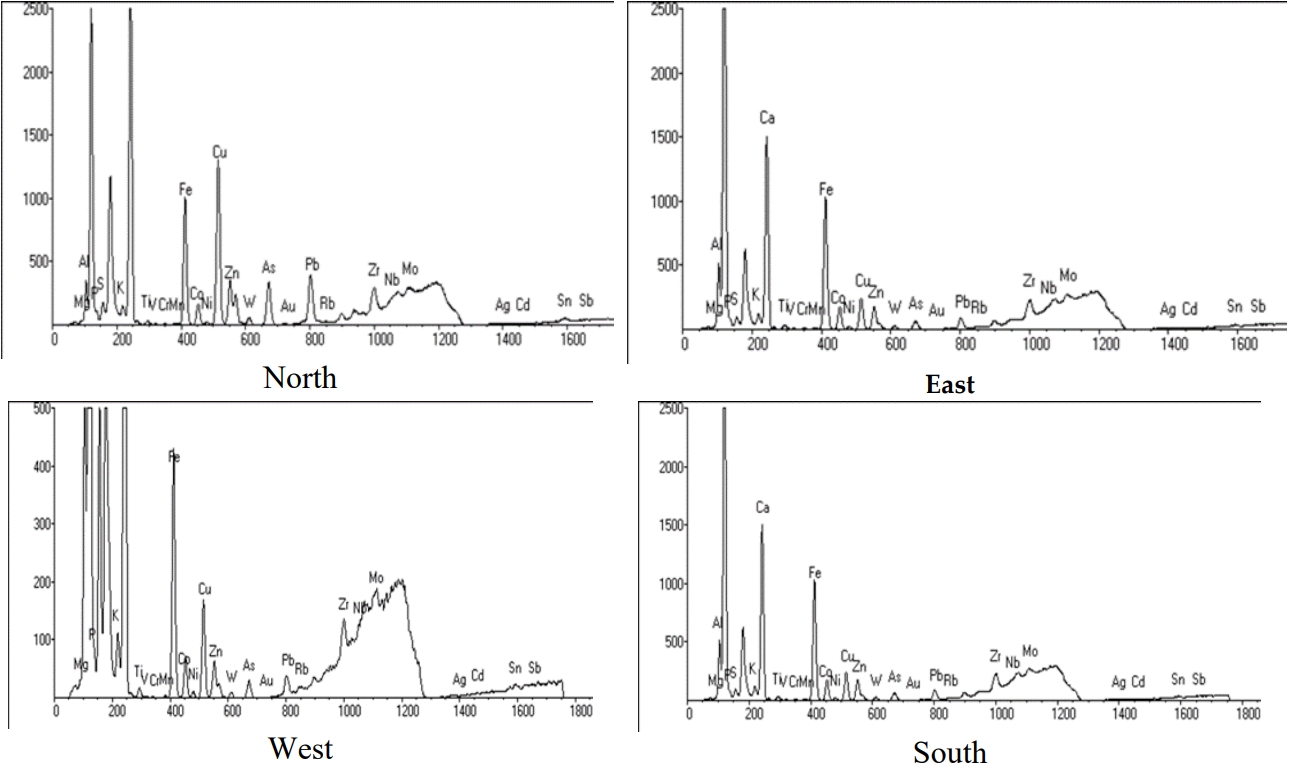
Energy dispersive x-ray fluorescence (EDXRF) scans for soil samples at dumpsite 1
Energy dispersive x-ray fluorescence (EDXRF) scans for soil samples at dumpsite 2
Energy dispersive x-ray fluorescence (EDXRF) scans for soil samples at dumpsite 3
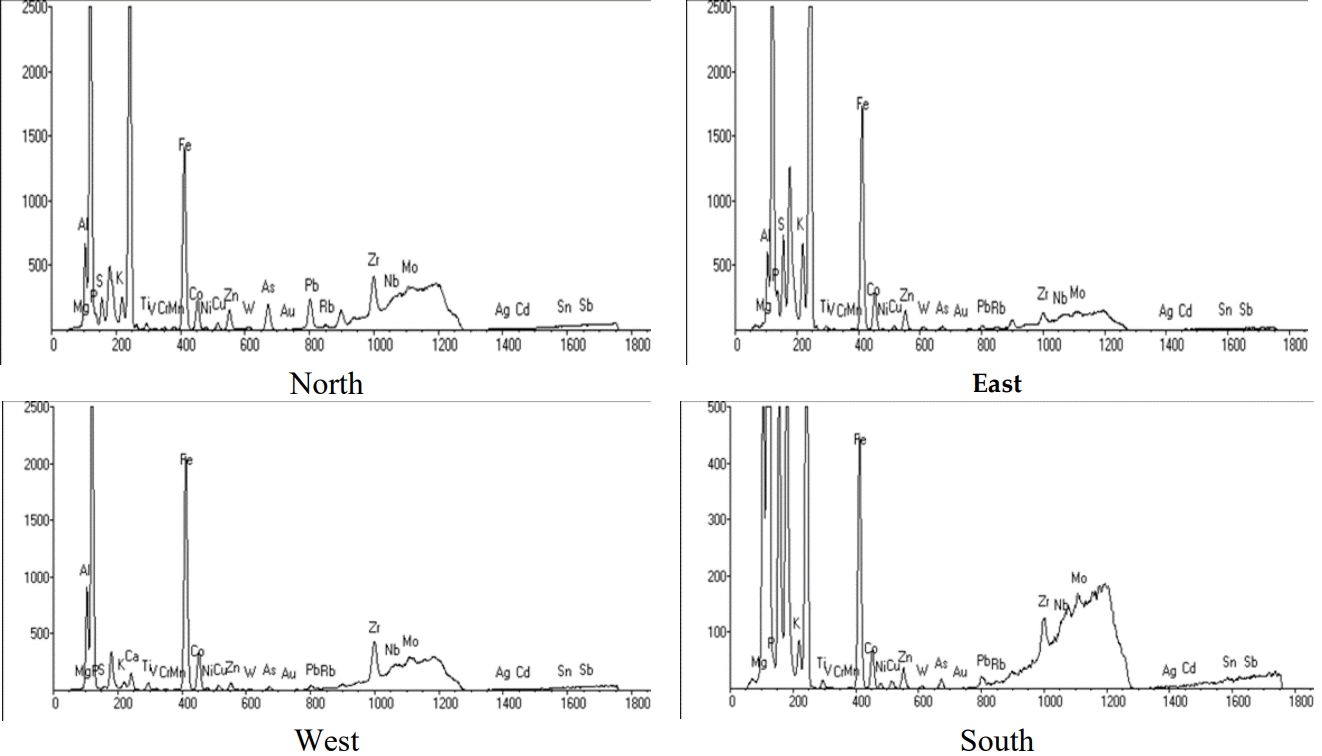
samples at dumpsite 4. Energy dispersive x-ray fluorescence (EDXRF) scans for soil

Summary of mean concentration (mg/kg) of heavy metals in the studied dumpsite soils and control sites.
Correlation analysis (CA)
Pearson’s correlation coefficient between the variables was calculated in the form of matrices and used as a measure of similarity and inter-relationship among parameters assessed. Results obtained in dumpsite-1 revealed positive and significant correlation between Cr / Co (r = 0.983 at P < 0.05), Cr / Fe (r = 0.989 at P < 0.05), Mn / Co (r = 0.976 at P < 0.05), Co / Fe (r = 0.953 at P < 0.05), Cu / Zn (r = 0.984at P < 0.05), Zn / Pb (r = 0.988 at P < 0.05), Cu / As (r = 0.993 at P < 0.01), Cu / Pb (r = 0.994 at P < 0.01), Zn / As (r = 0.992at P < 0.01), and As / Pb (r = 0.999 at P < 0.01). Dumpsite-2 revealed positive and significant correlation between Ni / Cu (r = 0.975at P < 0.05). Dumpsite-3 recorded positive and significant correlation of Fe / OM (r = 0.981 at P < 0.05) and Cd / OM (r = 0.978at P < 0.05). Dumpsite-4 revealed positive and significant correlation of Co / Fe (r = 0.983at P < 0.05), Cu / As (r = 0.973at P < 0.05), Cu / Pb (r = 0.975), Zn / Cd (r = 0.959 at P < 0.05), Ni / OM (r = 0.993 at P < 0.01), and As / Pb (r = 0.999 at P < 0.01) and negative correlation of Co / pH (r = − 0.971 at P < 0.05), and Fe / pH (r = – 0.950 at P < 0.05). The findings from this study showed that soil OM content is positively correlated with Ni, Fe and Cd. The results indicate that the variations in the concentrations of heavy metals between 98 and 99% can be attributed to the variation in the OM content of the dumpsite soils. The observation that soil OM is a dominant variable affecting the spatial distribution of heavy metals is consistent with well-investigated findings [14-16,31]. Udosen [27] opined that the formation of OM and heavy metal ionic compounds reduces heavy metals bioavailability and mobility and thus, decreasing the activity of the heavy metal ions thereby leading to increased levels of heavy metals accumulation in the soil. Moreover, a significant negative correlation (inverse correlation) was observed between Fe / pH and Co / pH in the dumpsite soil. Previous studies have shown that soil pH has a significant impact on the migration of Fe and Co. The inverse correlation noted in dumpsite4 implies that as the available Co and Fe content in the dumpsite soil increases, the pH content of the dumpsite soil tends to decrease. The inverse correlations observed in this study are in agreement with that reported by [28]. The results obtained for the various dumpsites studied are shown in Tables 3, 4, 5 and 6.

Pearson’s correlation coefficient between the pH,organic matter (OM) and heavy metals in dumpsite-1.

Pearson’s correlation coefficient between the pH, organic matter (OM) and heavy metals in dumpsite-2.

Pearson’s correlation coefficient between the pH, organic matter (OM) and heavy metals in dumpsite-3

Pearson’s correlation coefficient between the pH, organic matter (OM) and heavy metals in dumpsite-4.
Principal component analysis (PCA)
PCA in dumpsite-1 revealed two major components (factors) with eigenvalues > 1 and 92.307% of the total variance, which was very good and can be relied upon to identify the origin of the heavy metals in the studied dumpsite soils. The first principal component (PC1) contributed 58.738% of the total variance with strong positive loadings on Cr, Mn, Co, Fe and pH; moderately positively loaded with Ni and OM, but strong negative loading on Cd. The dominant factor loading of Cr strongly suggests that the origin of Cr could be attributed to wastes from organic pigments in plastics and scrap metals in the dumpsite soil. Cr correlates with Co and Fe which indicates that they are from the same source. The second principal component (PC2) contributed 33.569 % of the total variance with strong positive loading on Cu, Zn, As, Pb; strong negative loading on Ni, but moderately positively loaded with pH. The dominant factor loading of Cu in PC2 strongly suggests that the origin of Cu could be attributed to wastes from scrap metals in the dumpsite soil. Also, in dumpsite-1, Cu significantly correlates with Zn, As and Pb which indicates that their source could be the same. PCA in dumpsite-2 (Table 7) revealed three major components (factors) with eigenvalues > 1 and 100.000% of the total variance. These components are related to the source of metals in the dumpsite soils. PC1 with 56.153% of total variance comprises Mn, Co, Ni, Cu and Zn with significantly high loadings. Significantly high negative loading and moderate negative loading were also recorded for pH and Cd respectively. The dominant factor loading of Cu in PC1 strongly suggests that the origin of Cu could be attributed to wastes from scrap metals in the dumpsite soil. Cu significantly correlates with Ni which indicates that their origin could be the same. PC2 contributed 32.588% of total variance with strong loading on Cr, Cd and OM; moderately positively loaded with Fe, Zn and Pb. The dominant factor loading of Cr in PC2 strongly suggests that the origin of Cr could be attributed to wastes from organic pigments in plastics and scrap metals in the dumpsite soil. The third component (PC3) explained 11.259% of total variance with significantly high loadings on As and Pb; but moderately positively loaded with Mn, Co and Fe. The dominant factor loading of As in PC3 strongly suggests that the origin of As could be attributed to wastes from organic pigments in plastics in the dumpsite soil. The results obtained for PCA in dumpsite-1 is shown in Table 7.
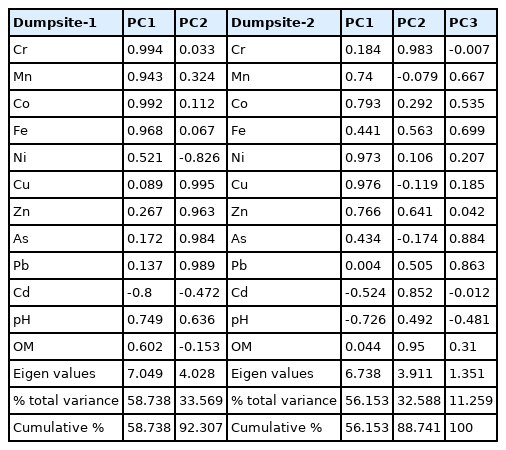
Principal component (PC) loadings (varimax-normalized) for experimented variables in the soil samples in dumpsites-1 and 2.
Results obtained for PCA in dumpsites-3 and 4 are shown in Table 8. The results obtained from PCA in dumpsite3 after varimax orthogonal rotation revealed three principal components with eigenvalues ˃ 1 and 100.000% of the total variance. The first principal component (PC1) in the data set explains 47.861% of the total variance and is strongly positively loaded with Mn, Fe, Ni, Cd, OM and pH. The dominant factor loading of OM strongly suggests that the origin of OM could be attributed to the presence of a high quantity of biodegradable waste materials domiciled in the dumpsite. The high OM content of dumpsite soils encourages cultivation on dumpsite soils by local farmers which poses health risks to humans along the food chain. Fe and Cd correlate with OM which could be attributed to wastes from decomposing rice husk and rice bran that accumulated on the studied dumpsite soils. Carr et al. [13] reported that soil OM is one of the most important factors that control the accumulation, mobility and bioavailability of heavy metals in soils. Also, OM content in soils can lead to elevated soil adsorption capacity which enhances the accumulation of heavy metals [14]. Poorly drained soils with pH ranges from 4–7 are prone to Fe toxicity [27]. PC2 contributed 31.319% of total variance with significant positive loading on Cu, Zn and Pb; significant and moderate negative loading on Co and Mn respectively. The dominant factor loading of Zn in PC2 strongly suggests that the origin of Zn could be attributed to wastes from incinerated rice husk and bran in the dumpsite soil. PC3 accounted for 20.820% of total variance with significant loading on Cr; moderate positive and significant negative loading on pH and As respectively. The dominant factor loading of Cr in PC3 strongly suggests that the origin of Cr could be attributed to wastes from incinerated rice husk and bran in the dumpsite soil. Udosen [27] further reported that Cr is considered a serious environmental pollutant although its distribution in plants does not only depend on soil pH, OM and heavy metals concentration. PCA in dumpsite-4 (Table 8) revealed three PCs with eigenvalues > 1 and 100.000% of the total variance. PC1 contributed 45.874% of the total variance with strong positive loadings on Mn, Cu, Zn, As and Pb; moderately positively loaded with Cr and Cd. The dominant factor loading of Cu in PC1 strongly suggests that the origin of Cu could be attributed to wastes from scrap metals in the dumpsite soil. Cu significantly correlated with As and Pb which indicates that their origin is the same. Also, Zn significantly correlated with Cd which suggests that both are from the same source. Chen et al. [29] reported that Zn and Cd always occur in a combined state and are very toxic to the ecosystem even at very low concentrations. PC2 contributed 31.909% of the total variance with significant positive loading on Co and Fe and strong negative loading on pH. The dominant factor loading of Co in PC2 strongly suggests that the origin of Co could be attributed to wastes from organic pigments in plastics and scrap metals in the dumpsite soil. The negative correlation (inverse correlation) which was observed at Fe / pH and Co / pH indicated that as the available Co and Fe contents of the soil increase, the pH of the soil decreases. Eze et al. [28] noted that soil pH has a significant impact on the migration and biological effects on Fe and Co in the soil. PC3 contributed 22.216% of the total variance with strong loading on Ni and OM; moderately positively loaded with Cr, moderately negatively loaded with Zn and significantly negatively loaded with Cd. The dominant factor loading of Ni in PC3 strongly suggests that the origin of Ni could be attributed to wastes from organic pigments in plastics and scrap metals in the dumpsite soil. A positive correlation was observed between Ni and OM which indicated that the high OM content of the soil influenced the accumulation, mobility and bioavailability of Ni in the studied dumpsite soil. Zn correlation with Cd suggested that they are from the same anthropogenic source. The origin of Zn and Cd could be associated with municipal solid wastes from plastics, scrap metals, inorganic chemicals, Cd-Ni battery, roofing materials, discarded automobile spare parts, pulp and paper in the dumpsites. Furthermore, this study revealed an inverse relationship of Co / pH and Fe / pH in the studied dumpsite soil. The obtained results demonstrate that statistical procedures can be a strong tool for classifying the metals as groups in terms of relationship with soil properties and identifying their probable origin in soil.

Principal component (PC) loadings (varimax-normalized) for experimented variables in the soil samples in dumpsite-3 and 4.
Hierarchical Cluster Analysis (HCA)
HCA was used also to find groups among metal based on SED [32,33]. The cluster plots for heavy metals in soils from the different dumpsites are presented in Figures 3a-d. In dumpsites 1 (Figure 7a), three groups were identified. In group 1, the combination includes Mn, Co, Ni, Cr, Cd, As, Pb and Zn. In group 2, the combination includes Cu while in group 3 is Fe. This showed that metals in the first group might have originated from mixed anthropogenic and geogenic sources including organic pigments in plastics, atmospheric deposition and incinerated biodegradable wastes while metals in groups 2 and 3 are from human activities, mainly from waste dumped containing scrap metals in the area. A similar observation was also made for dumpsite 2 (Figure 7b), showing Fe belonging to group 3. In dumpsites 3 (Figure 7c) and 4 (Figure 3d), two groups (1 and 2) were identified. Again, Fe showed dissimilarities from other heavy metals, placed in group 2, suggesting that there is a specific source of these pollutants in these dumpsites related to scrap metals and slightly from geogenic sources. A similar result was reported by Ebong et al. [15] for a dumpsite soil in Calabar. Worthy of note is that the waste materials in the studied dumpsite soils could have influenced the levels of Mn, Co, Ni, Cr, Cd, As, Pb, Cu, Fe and Zn.
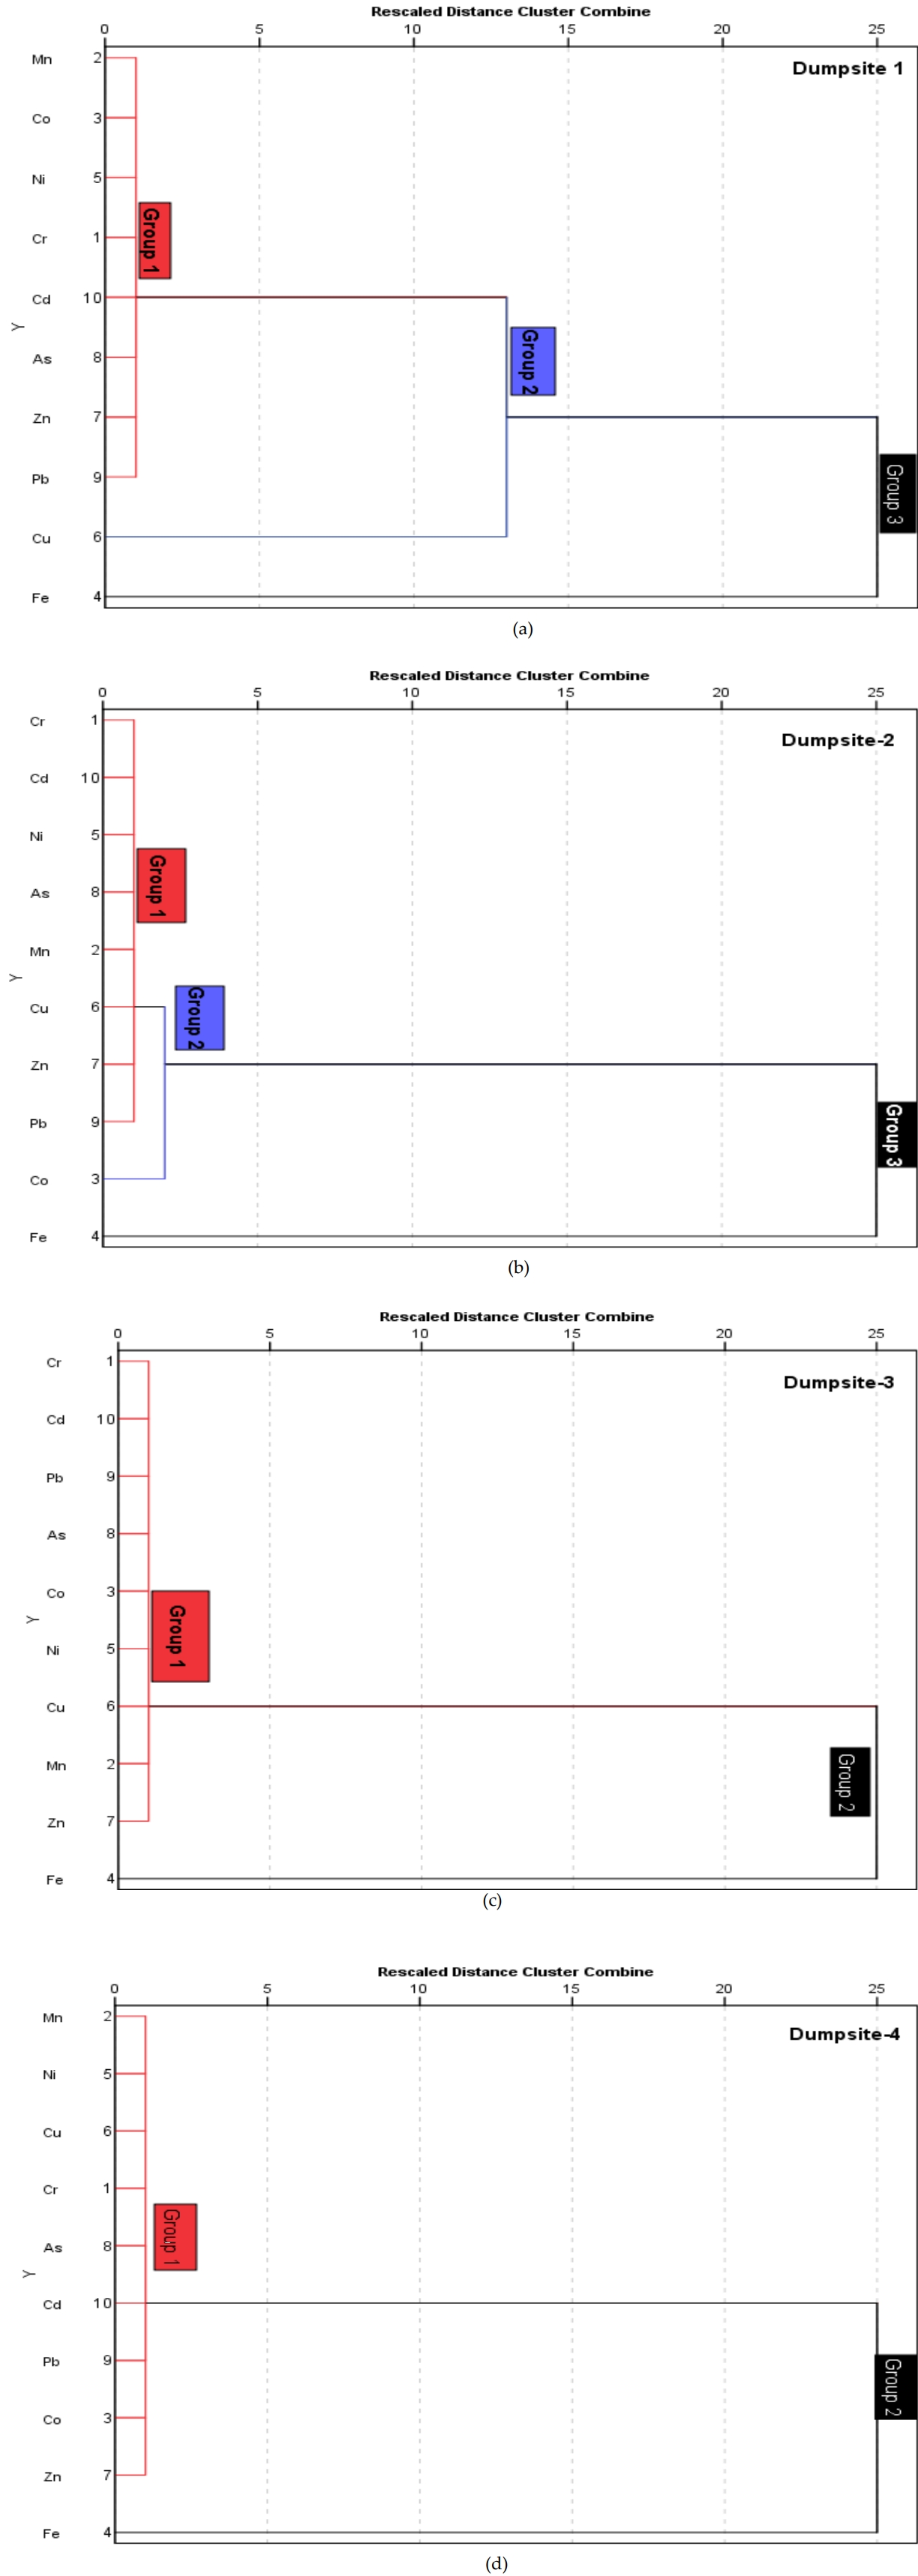
Hierarchical cluster plots of heavy metals in soils from the different dumpsites
Analysis of variance (ANOVA)
ANOVA revealed that the p-value for the heavy metals is 0.000 which is less than 0.05. This implies that the effects of the heavy metals on the studied dumpsite soils are significant, hence the need for multiple comparison tests. The data obtained was subjected to multiple comparisons test and the result showed that the p-value for the studied dumpsite soils is 0.441 which is greater than 0.05. This implies that the dumpsite soils are independent of the effects of heavy metals. Besides, the Least Significant Difference (LSD) revealed that Fe was the predominant heavy metal among the metals present in the studied dumpsites. It can be concluded that the Fe content explains the majority of the variations in the concentration of heavy metals from the studied dumpsites. This was in contrast to the findings reported by Ebong et al. [15] where OM content explained the majority of the variations in the concentration of heavy metals from the studied sites.
Conclusion
This research has revealed the extent of heavy metals accumulation in the studied dumpsite soils in Southeastern Nigeria and the inter-relationship among the parameters assessed. The concentration of the heavy metals in the studied dumpsite soils were significantly higher than the maximum permissible limits of heavy metals for Nigerian soils. Using ANOVA, it was discovered that the dumpsite soils studied were independent of the effects of the heavy metals. ANOVA also revealed that Fe was the predominant heavy metal among the studied dumpsite soils after comparison with other heavy metals using their LSD. CA was used to quantitatively analyze and confirm the significant relationship among soil parameters (pH and OM) and heavy metals concentration among the studied dumpsite soils. PCA and HCA were adopted to assist in the interpretation of elemental data. This method reduced the dataset into major components/groups representing the different sources of the metals. However, the origin of these heavy metals in the studied dumpsite soils has been attributed to wastes from organic pigments in plastics, scrap metals and incinerated biodegradable wastes. This study generally concludes that statistical methods can be a strong tool for monitoring heavy metals accumulation, origin and may assist in predicting future soil pollution posed by human activities as well as its mitigation.
Acknowledgements
This work was part of an M.Sc research project submitted to the Department of Pure and Industrial Chemistry, Faculty of Physical Sciences, Nnamdi Azikiwe University, Awka, Nigeria.
Notes
The authors declare no conflicts of interest regarding the publication of this manuscript.
CRediT author statement
VI: Conceptualization, Visualization, Software, and Supervision; VC: Methodology, Data curation, Writing- Original draft preparation, Investigation, Writing- Reviewing and Editing.