Monitoring and modeling of heavy metal contents in vegetables collected from markets in Imo State, Nigeria
Article information
Abstract
Vegetable consumption is one major exposure route of heavy metals to humans, but few data exist for Imo State, Nigeria. We assessed the contamination levels and associated health risk of cadmium (Cd), cobalt (Co), copper (Cu), nickel (Ni), lead (Pb) and zinc (Zn) in vegetables (Telfairia occidentalis, Pterocarpus mildbraedii, Gongronenina latifolium and Vernonia amygdalina) that are consumed frequently from markets (n=16) in three zones of Imo State, Nigeria. After wet-digestion of samples, the supernatant were analyzed using atomic absorption spectrophotometry. The mean concentrations in the four vegetables ranged from 0.006±0.003 mg/kg to 0.011±0.007 mg/kg for Cd, 0.064±0.012 mg/kg to 1.225±0.226 mg/kg for Co, 10.711±1.968 mg/kg to 25.088±13.975 mg/kg for Cu, 0.062±0.013 mg/kg to 0.307±0.210 mg/kg for Ni, 0.006±0.005 mg/kg to 0.012±0.002 mg/kg for Pb and 63.55±4.055 mg/kg to 104.126±24.080 mg/kg for Zn. Except for Zn, all heavy metals in the various vegetables were below the joint standard of Food and Agriculture Organization and World Health Organization. Although, overall load of heavy metal was very low, Zn had the highest contamination factor in vegetables. Heavy metals concentrations in vegetables generally showed low to high variations and statistically different (p<0.05). Average daily intake was below the provisional tolerance limit except for Zn. The target hazard quotient of metals in vegetables for both children and adults were below 1, indicating no potential risk to the public. Overall, heavy metals hazard index were below 1, indicating acceptable level of non-carcinogenic adverse health effect. However, potential multi-element contamination from ingestion is possible as revealed by the correlation profiling of heavy metals.
INTRODUCTION
Pollution of the biosphere started with exponentially increased human needs to fulfill the requirements of products in daily life [1,2]. Following a rapid growth of usage in agricultural chemicals, the ecosystem is now enriched with heavy metals [3,4]. The agricultural agents have led to release of heavy metals in the environment [5]. Health of population is impaired as people ingest foods contaminated by heavy metals [6]. The presence of heavy metals in the environment has become a major threat to plant, animal and human life due their bioaccumulating tendency and toxicity [7–9].
Heavy metals are non-biodegradable, generally possess specific densities greater than 5 and adversely affect the environment and living organisms [10]. Acute metal poisoning in humans causes severe dysfunction in the renal, reproductive and nervous systems and chronic exposures at low concentrations in the environment can be harmful to human health [9]. However, some elements called trace elements or micronutrients have essential functions in plant and animal cells. Such elements including copper (Cu), cobalt (Co), iron (Fe), molybdenum (Mo), nickel (Ni) and zinc (Zn). Only when the concentrations in plants and animals exceed a certain threshold do they demonstrate toxic effects [11].
One major source of heavy metals in the environment is from roads and automobiles exhaust. Suspended heavy metals in particulates emitted from automobiles are deposited on road surfaces. During rainfall, the bound metals dissolve or are swept off the roadway with the dust into drainages. The silt from these drainages during de-silting end up in refuse dumps or carried to farmlands by flood [12,13].
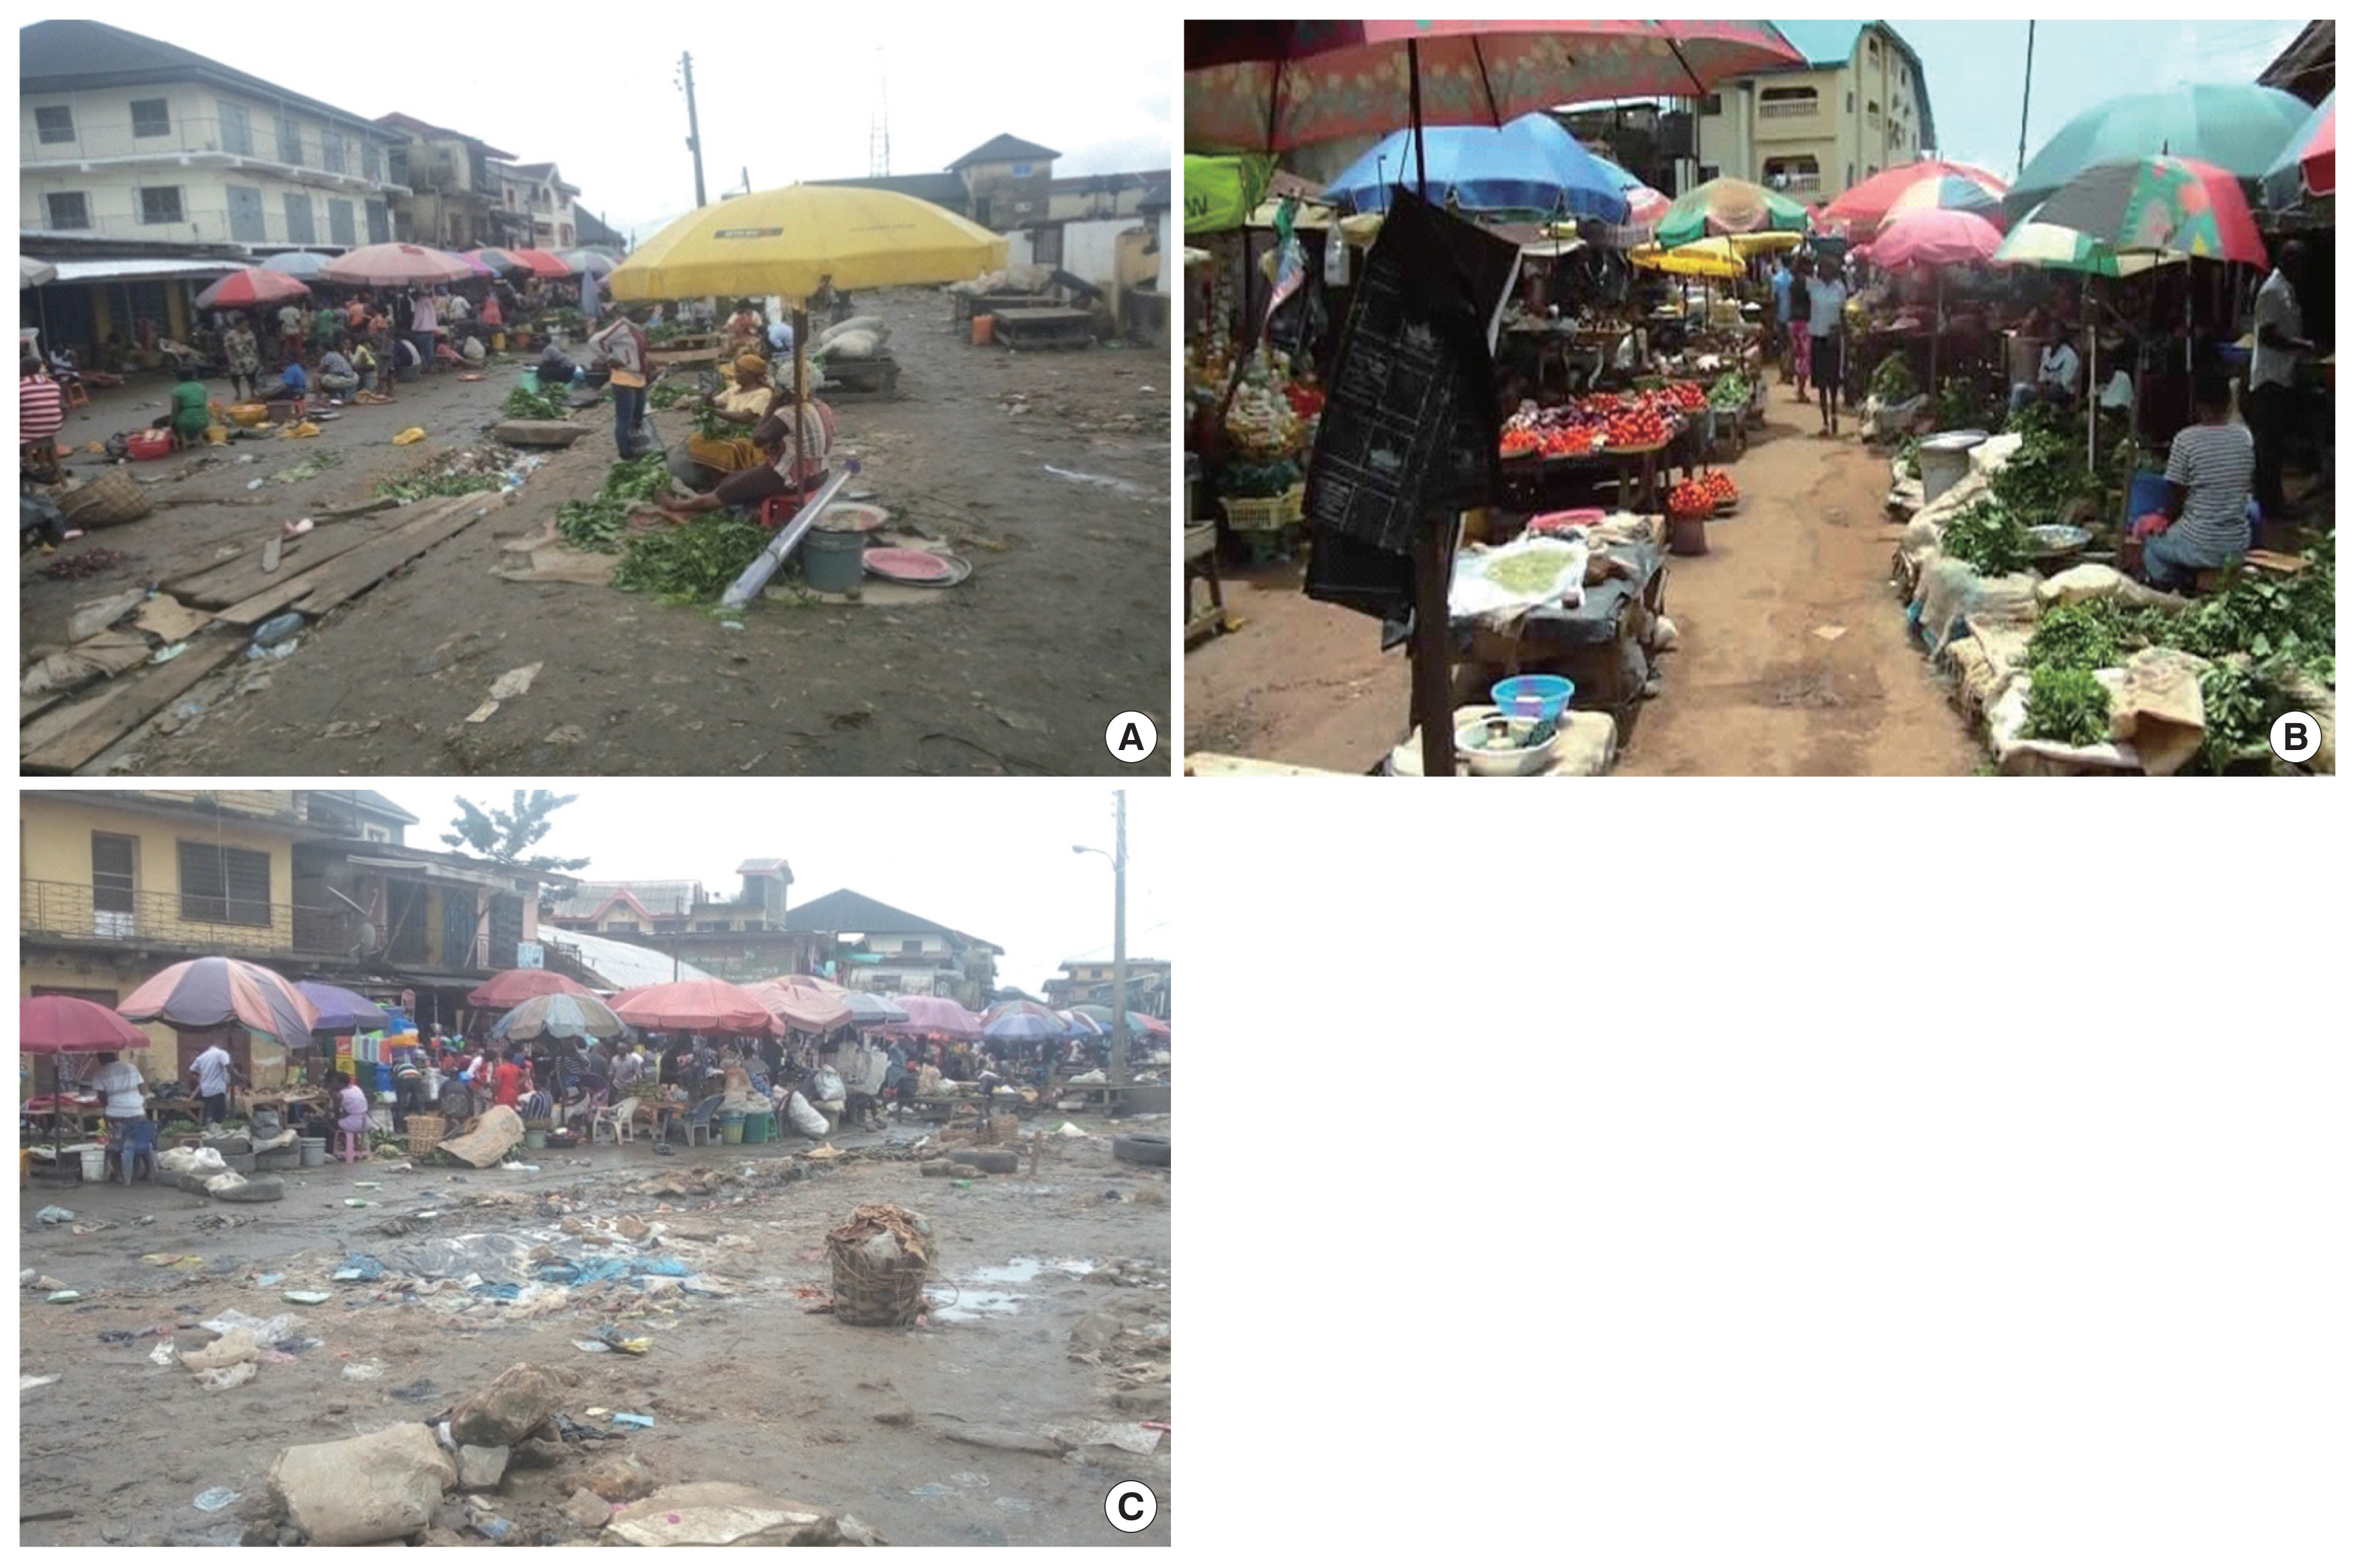
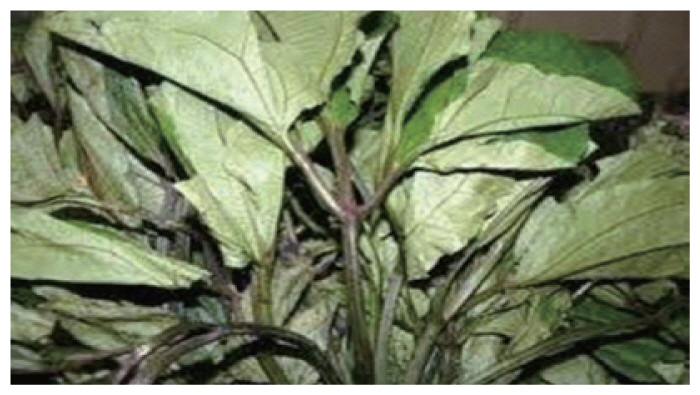
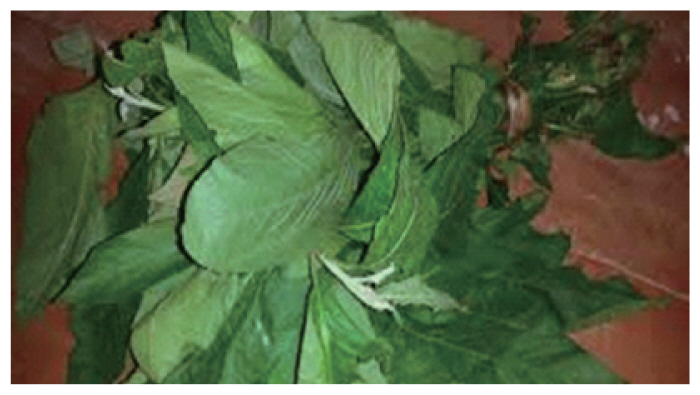
Vegetables refer to the stems, leaves and roots of plants that are edible [14]. Vegetables are major sources of vitamin C, thiamine, niacin, pyridoxine, folic acid, minerals and dietary fiber and therefore needed in human nutrition and health [10]. Vegetables are exposed to heavy metals from the soil or deposited heavy metals on exposed vegetables in open markets (Figure 1). In Imo State, Nigeria, the environment selling these vegetables are very degraded, dirty and deplorable (Figure 1c).
Heavy metals in vegetables are of growing concern due to the fact that some soils and irrigation water have been shown to be polluted [15]. Uptake of heavy metals depends on the type of vegetable as some accumulate higher levels of heavy metals than other [3,6,16]. Once vegetables containing high amounts of heavy metals get eaten by man, such metals can cause many clinical and physiological problems [4]. However, the human health risk is depended on quantity of heavy metals in the vegetables.
In Nigeria, vegetable consumption rose from 120 g per person per day in 1992 to 165 g per person per day in 2007 growing at an average annual rate of 11.33% [17]. It is expected that consumption may reach 389 g per person per day in 2019, marking increasing potential exposure to heavy metal contamination from vegetable consumption. Consumers of vegetable from markets are exposed to heavy metals via consumption and dermal contact. Literature reveals that vegetables sold in markets may be contaminated by heavy metals above stipulated limits of Food and Agriculture Organization (FAO) and World Health Organization (WHO) [6,15,16]. Unfortunately, there is paucity of data regarding the levels of heavy metals in vegetables that are openly sold in public markets in Nigeria. Two previous reports studied ugu leaf (Telfairia occidentalis) and Bitter leaf (Vernonia amygdalina) collected from Eke Okigwe Market, Nigeria, for mercury (Hg), cadmium (Cd), lead (Pb) and manganese (Mn) concentrations [18, 19]. In view of the importance of the role that heavy metals play in defining the nutritional status of the human body and need to fill data gap, the present study was initiated to determine the concentrations of Cd, Co, Cu, Ni, Pb and Zn in different species of vended leafy vegetables and their associated human health risk in markets in the three zones of Imo state, Nigeria. Depending on the results obtained in comparison with FAO and WHO permissible limits, the populace would be alerted or not.
MATERIALS AND METHODS
Study area
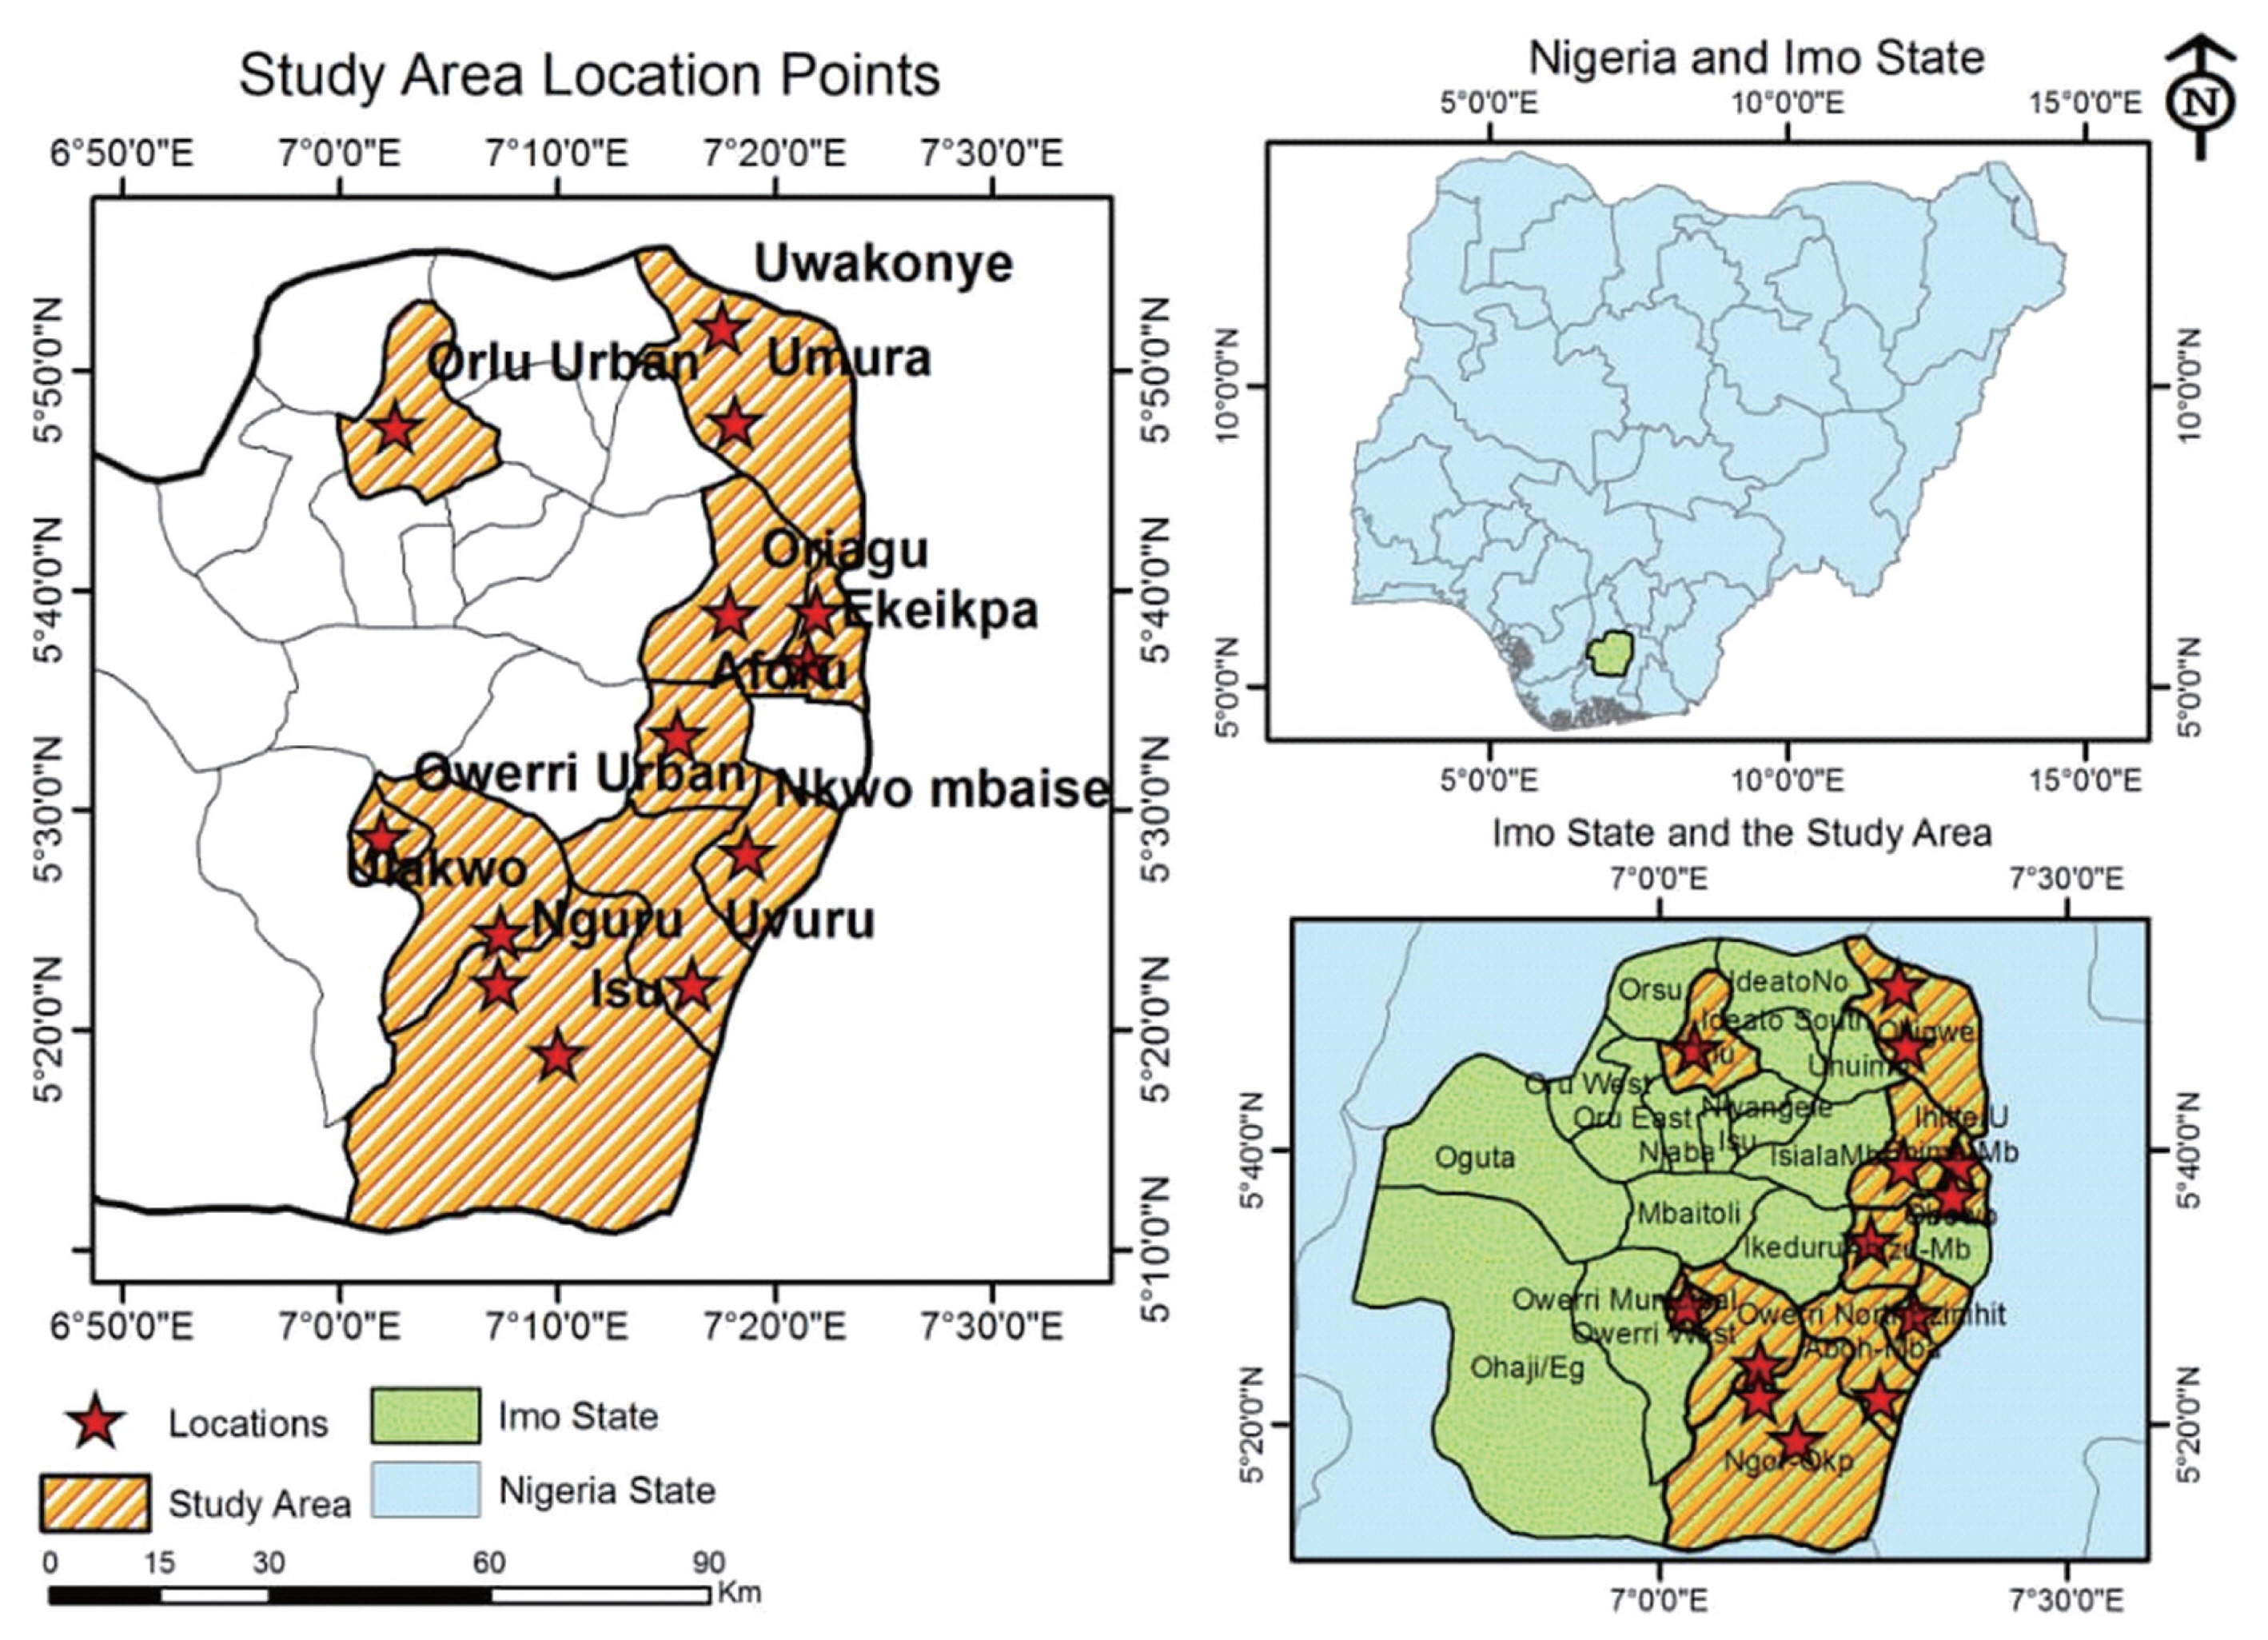
The study was conducted in open markets within the three zones (Owerri, Orlu and Okigwe) of Imo State (Figure 2, Table 1). Geographically, the area lies within latitudes 4°45′N and 7°15′N, and longitude 6°50′E and 7°25′E with an area of around 5,100 km2 [20]. The markets attract local goods from the agricultural and commerce sectors in the south eastern region of Nigeria. The communities in the area have a large expanse of land for agricultural activities, serving as their chief occupation.
Sample collection and preparation
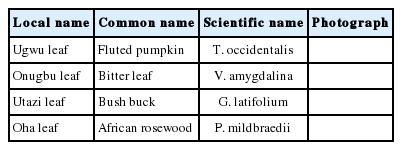
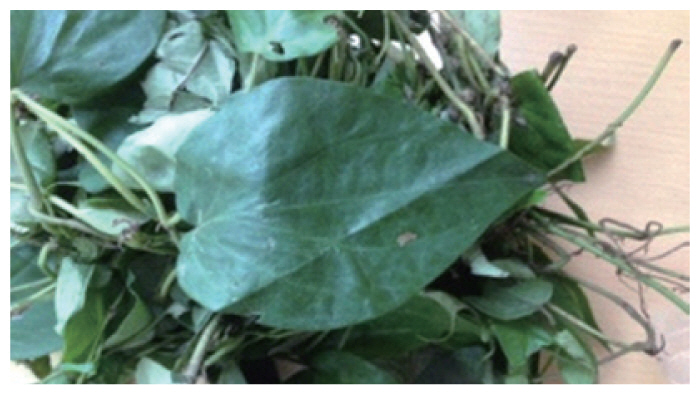
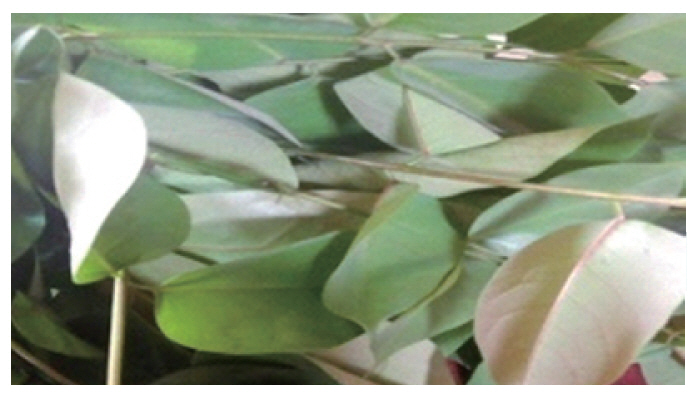
Forty-eight samples of leafy vegetables were randomly purchase from 16 markets in seven local government areas and two urban towns (Figure 2). Four species, T. occidentalis, V. amygdalina, Gongronenina latifolium and Pterocarpus mildbraedii were investigated in this study. From each market, each sample was collected from three different spots, twice after five days gap. The vegetable names and photographs are presented in Table 2. The vegetables leaves were plucked off their stems by hand and washed with clean deionized water to remove dirt and soil materials clinging on them. The washed leaves were oven-dried at 80°C for 2–3 days and weighed occasionally until a constant weigh was attained and the moisture content was determined along as the ratio of difference in the constant weight from initial weight to the initial expressed in percentage [21]. The oven dried vegetables was then pulverized with porcelain mortar and pestle. The biomass powder was packaged in air-tight plastic vessel for each sample, prior to acid digestion.
Sample digestion and analysis
Each sample was wet-digested applying the method of Ibe et al. [3] 5 g of sample powder was introduced into a 100 mL beaker. 45 mL of perchloric-nitric acid mixture (2:1, v/v) was added to the powder and allowed to digest in a microwave oven (Gallenkaimp CAS-234) at 110°C for 1 hour in a fume chamber. Cooled digest was filtered into a 50 mL standard volumetric flask. Deionized water was added to make the solution up to the mark. Different working solutions were prepared by dilution of digest filtrate using deionized water. Metals concentrations in the digest were analyzed using Atomic Absorption Spectrophotometer (Buck Model 210).
The characteristic wavelengths of Cd, Co, Cu, Ni, Pb and Zn were first set using the hollow cathode lamp, then digested filtrates samples was aspirated into the flame directly. Concentration was in mg/L (ppm) which was converted to mg/kg by dividing with the volume of sample aspirated. The instrumental parameters for particular metals that were analyzed are presented in Table 3. The limit of detection (LOD) and quantification (LOQ) of the analytical method for each metal was calculated as described in a literature [22]. LOD and LOQ values are presented in Table 3.
Quality assurance and quality control (QA/QC)
For quality assurance/quality control purposes, high purity reagents and chemicals were used in this study. All glassware was thoroughly washed with detergent and rinsed many times with deionized water before use. For contamination and data reliability assessment, blank samples were scrutinized after every three samples for the purpose of ensuring that obtained results are within the range. Based on dry weight, heavy metals concentrations in vegetable and all the evaluation were done in triplicate. Precision and accuracy of analysis was assured through repeated analysis of samples against standard reference materials (NIST-SRM 1570) and results were found within±2% of the certified values.
Data analysis
Data analysis was conducted using Microsoft Excel 2010. Descriptive statistics including means, standard deviations, minimum and maximum values of heavy metal concentrations for the various samples were calculated. We applied Pearson’s correlation to determine specific relationships among the different metals at level of significance (α=0.05). One-way analysis of variance (ANOVA) was conducted to test for significance differences between metals and between vegetables at p < 0.05. Variability was computed for heavy metals as coefficient of variations (CV, %) to test for variations in vegetables from the different market, according to equation (1).
where SDV is the standard deviation and Xi is the mean. Variation ranking was considered to be: CV less than 20 as little variation; CV between 20 to 50 as moderate variation and CV greater than 50 as high variation.
Other analysis was done using chemometric models.
1. Contamination factor (Cf) and pollution load index (PLI)
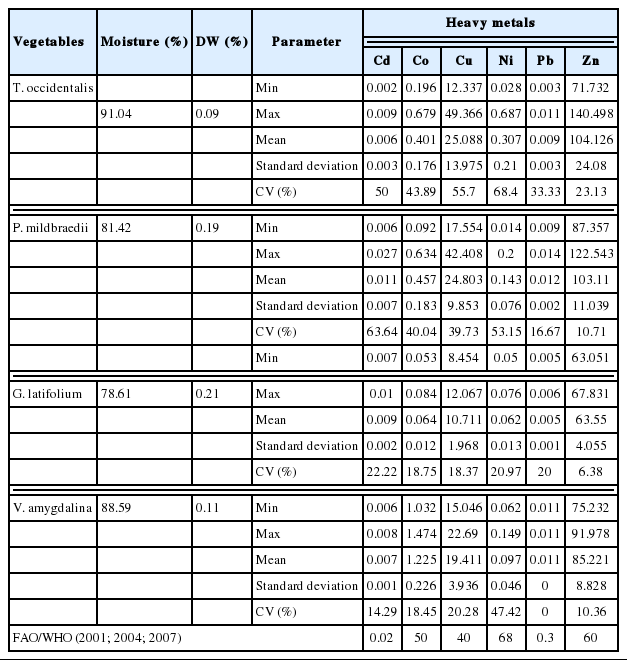
Contamination factor (Cf) and pollution load index (PLI) were quantitatively estimated according to the equation (2) and (3) [23,24]. Cf is defined as the ratio of the measured concentrations of heavy metals in the vegetables to reference recommended limits, while PLI is computed from the Cf, as the sixth-root of individual Cf product of individual heavy metals studied.
where Cm is the measured heavy metal concentration in the vegetable presented in Table 4 and RL is the recommended limit taken from FAO/WHO [25–27], also in Table 4.
2. Average daily intake (ADI)
The average daily intake (ADI) of heavy metal was calculated as described in previous report [6]. The chemometric model for calculating ADI is presented in equation (4)
where ADI is average daily intake of heavy metal per person per day (mg/person/day), AVconsumption is the average vegetable consumption in Nigeria in 2019 (389.33 g/person/day), %DWvegetable is percentage of dry weight of vegetable (Table 4), Cm is average heavy metal concentration of dry weight vegetable (mg/g), and BWA/C is the average weight of person was considered to be 60 kg for adult and 12 kg for children [28].
3. Target hazard quotient (THQ)
Target hazard quotient (THQ) was calculated to assess health risks through consumption of vegetables. Methods described by USEPA [29] was followed and presented in equation (5).
where VIR is the vegetable ingestion rate (2.2 g/day); EF is exposure frequency (365 days/year); ED is the exposure duration (70 years), equivalent to the average lifetime [30]; RFD is the oral reference dose (mg/kg/day), which were 0.001, 0.04, 0.02, 0.004 and 0.3 for Cd, Co, Ni, Pb and Zn respectively [25–27,29], and ETAV is the average exposure time for noncarcinogens (365 days/year × number of exposure years, assuming 70 years in this study).
4. Hazard index (HI)
Human exposure to more than one pollutant can results in additive effects [6]. Hazard index (HI) can used to estimates the likely impacts of these additive effects. HI is computed as the summation of individual THQ for heavy metals as described in equation (6).
RESULTS AND DISCUSSION
Heavy metal distribution in vegetables
The distributions of heavy metals in the vegetables from the different markets are presented in Figure 3. Overall Zn was generally distributed in high concentrations, while Cd, Co, Ni and Pb were very low in the studied vegetables (Figure 3). Critically looking at the distribution plot in Figure 3a, for T. occidentalis, higher concentrations for Zn was generally recorded at markets located in urban areas than less urbanized area. Markets such as Nkwo Orji, Relief, Eke Ukwu, International and Daily are located in urban areas such viz. Owerri (state capital) and Orlu [31]. Similar highest distribution for Cu was in vegetables from International and Daily markets in Orlu urban. Highest distribution for Zn in P. mildbraedii was from Nkwo Orji and lowest at Relief markets (Figure 3b). Similar pattern was also observed for Cu (Figure 3b). Again, Zn and Cu followed the same pattern for G. latifolium and V. amygdalina. The order of distribution of Zn and Cu by markets was Eke Nguru>Eke Ulakwo>Eke Isu for G. latifolium while Nkwo Mbaise>Afor Oru>Orie Uvuru for V. amygdalina. Heavy metals like Cu and Zn in plant work synergistically maintaining proper metabolic activities since both elements are constituent of many enzymes which are required in the process of photosynthesis, mitochondrial respiration, oxidative stress response, and some other physiological processes in plants [4, 32,33]. These Zn-Cu dynamics in plants could be responsible for the similar pattern exhibited in the four vegetables. However, analysis of variance reveals that there were significant differences (p<0.05) between heavy metals concentration in the four vegetables from the different markets in the state [p=1.29×10−66; degree of freedom (125); Fcritical (2.29)<Fratio (307.29)]. It indicates that the levels of heavy metals vary in the four vegetables from the different markets. This could be due to environmental factors such as the soil they are grown in as well as irrigation water used during planting [34].
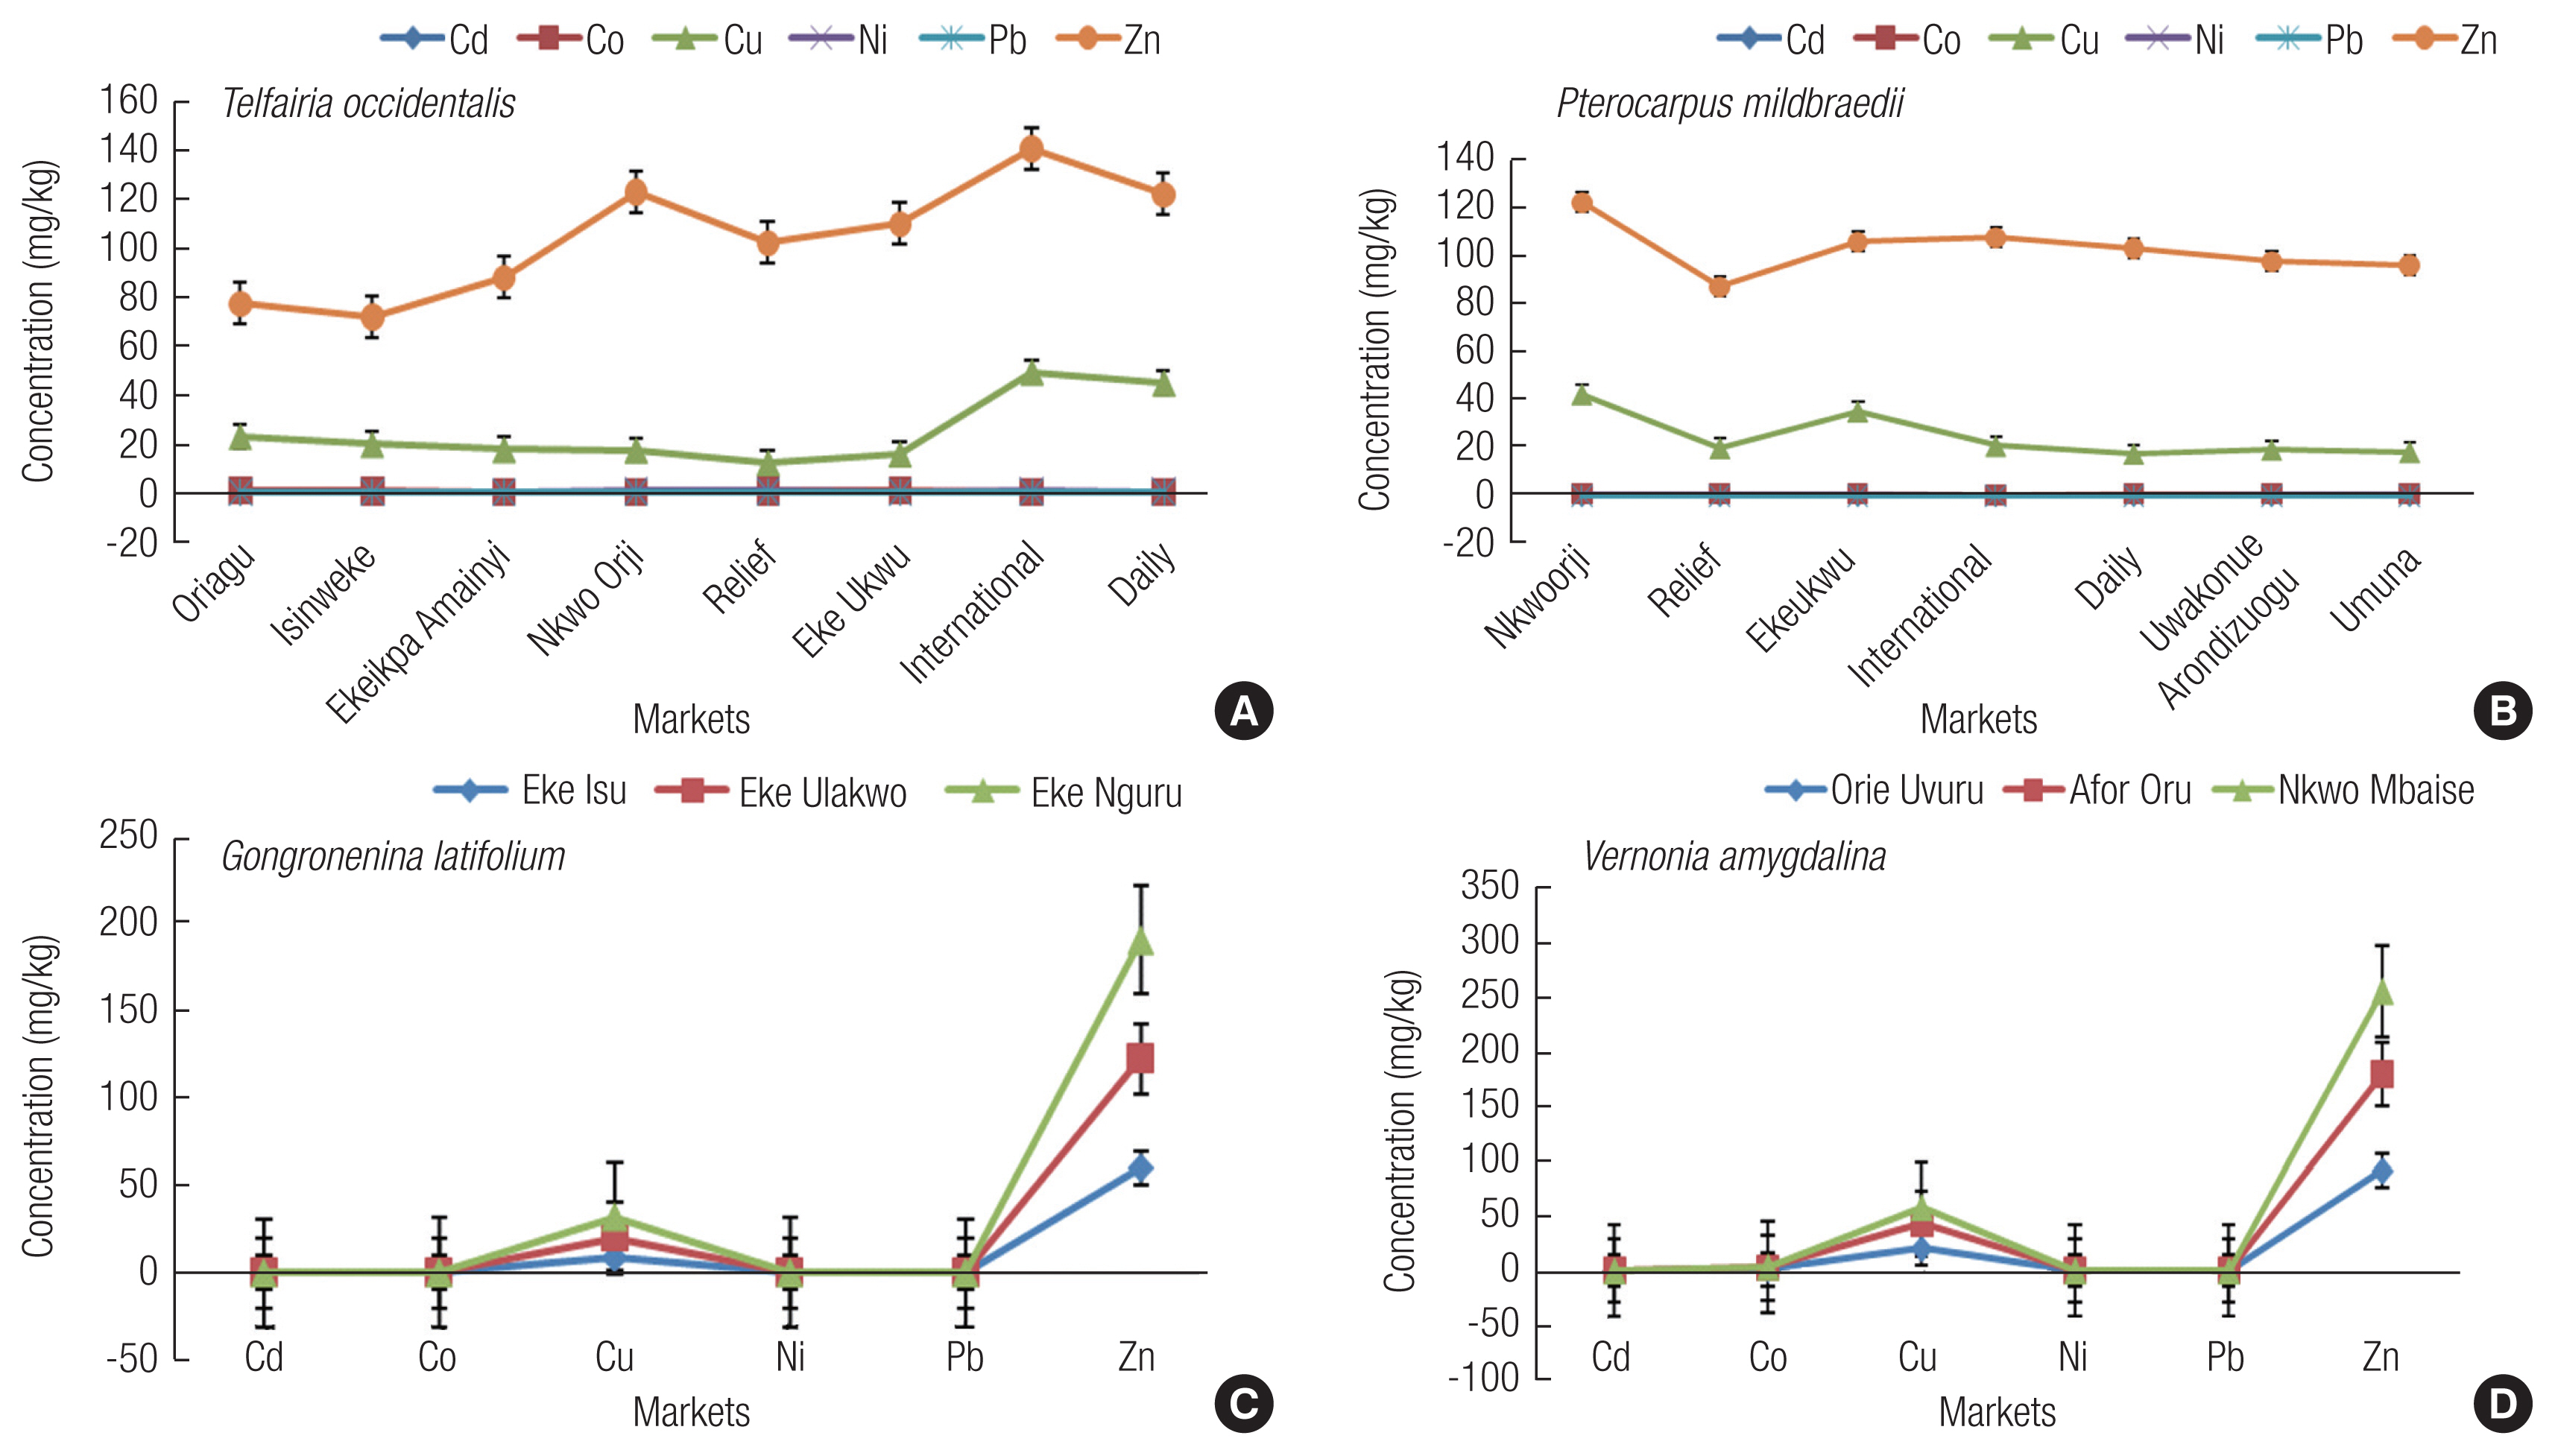
Heavy metal distribution in vegetables from the different markets.
* Cd: cadmium, Co: cobalt, Cu: copper, Ni: nickel, Pb: lead, Zn: zinc
The descriptive statistics and the variations for heavy metals concentrations in four vegetables are presented in Table 4. Cd concentrations in T. occidentalis, P. mildbraedii, G. latifolium and V. amygdalina are presented in Table 4, which ranged from 0.006±0.003 mg/kg to 0.011±0.007 mg/kg. The findings revealed that Cd levels in the four vegetables were below 0.02 mg/kg, the limit set by FAO/WHO [27]. Similarly in another study, Cd values in vegetables collected from farms and markets in Lagos, Nigeria, ranged from 0.001 to 0.003 mg/kg [35]. Analysis of vegetables harvested from waste dumpsites in Kumasi, Ghana showed very high Cd levels that ranged from 0.68 to 1.78 mg/kg [36]. Furthermore, Lente et al. [15] reported that Cd values are less than 0.006 mg/kg for vegetables which was grown in wastewater irrigated areas of Accra, Ghana. Similar study conducted on vegetables from markets in Tamale, Ghana reported Cd levels which ranged from 0.01 to 0.07 mg/kg [6]. The current study was also lower than value of 3.68 mg/kg for local vegetables Brassica juncea in Harare, Zimbabwe, 0.090 mg/kg for T. occidentalis from Lagos Markets, Nigeria and 0.049 mg/kg for Lactuca sativa collected from vicinity of an industrial area [37–39]. Various sources of environmental contamination have been implicated for its presence in foods especially from irrigation water and potentially from microplastics [15,37,40–42]. Cd is a non-essential element in foods and natural water and it accumulates principally in the kidneys and liver [13]. Furthermore, it can persist in the body and has been linked to renal damages and abnormal urinary excretion of proteins [9,43,44]. The variations of Cd in vegetables from the different markets ranged from low to high. Low variability was recorded for V. amygdalina (14.29%), moderate for G. latifolium (22.22%) while high for both T. occidentalis (50%) and P. mildbraedii (63.64%) (Table 4).
Co concentrations in T. occidentalis, P. mildbraedii, G. latifolium and V. amygdalina are presented in Table 4, which ranged from 0.064±0.012 mg/kg to 1.225±0.226 mg/kg. The findings revealed that Co levels in the four vegetables were below 50 mg/kg, the limit set by FAO/WHO [25]. In Nigeria, Oladeji and Saeed [16] assessed seasonal levels of Co in Amaranthus hybridus, L. sativa, Brassica oleracea, Daucus carota, Hibiscus esculentus, Allium cepa and Lycopersicon esculenetum, collected along wastewater stream channels in Kubanni Kaduna, Nigeria and reported concentrations higher (1.25–12.45 mg/kg) than the current study. Similarly, Mohsen and Seilsepour [45] reported Co level which ranged from 0.10–3.18 mg/kg in B. oleracea. Also, Lawal and Audu [46] studied vegetables (A. hybridus, L. sativa, B. oleracea, H. esculentus, A. cepa and L. esculenetum) grown in an irrigated garden in Kano, Nigeria and reported levels of Co with mean of 1.14±0.24 mg/kg. Co is ubiquitous in the natural environment and its higher levels are often caused by anthropogenic activity [4]. Co is toxic and can accumulate in tissues and organs, such as heart, liver, spleen, lymph nodes, and kidney, where it can induce cytotoxicity and genotoxicity effects in body cells [44,47]. Co variations in vegetables from the different markets ranged from low to moderate. Low variability was recorded for V. amygdalina (18.45%) and G. latifolium (18.75%) while high for both T. occidentalis (43.89%) and P. mildbraedii (40.04%) (Table 4).
Concentration of Cu in T. occidentalis, P. mildbraedii, G. latifolium and V. amygdalina are presented in Table 4, which ranged from 10.711±1.968 mg/kg to 25.088±13.975 mg/kg. The findings revealed that Cu levels in the four vegetables were below 40 mg/kg, the limit set by FAO/WHO [27]. Therefore, the levels of Cu in the four vegetables are safe for consumption. Lower levels of Cu have been reported in previous studies. Elbagermi et al. [48] reported Cu levels which ranged from 1.49–5.75 mg/kg in vegetables collected from production and market mites in Libya. Lente et al. [15] reported Cu values is less than 10 mg/kg in vegetables grown in an area irrigated by wastewater in Accra, Ghana. Also, in Ghana, Ametepey et al. [6] found lower Cu levels (0.01 – 0.09 mg/kg) in vegetables from Tamale markets. In Nigeria, Lawal and Audu [46] reported levels of Cu which ranged from 0.69±0.12 mg/kg to 7.50± 1.08 mg/kg in vegetables (A. hybridus, L. sativa, B. oleracea, H. esculentus, A. cepa and L. esculenetum) grown in an irrigated garden in Kano, Nigeria. Also, Doherty et al. [35] studied vegetables collected from the various markets in Lagos, Nigeria, reported Cu range of 0.066 – 0.867 mg/kg. Furthermore, it is reported that mean Cu levels of 0.02 mg/kg and 0.0081 mg/kg, respectively for studied vegetables [49,50]. Cu is essential for humans as a trace dietary mineral, but excess amount of Cu can cause acute intestine and stomach aches, and liver damage [4,51]. Cu variability was slightly high T. occidentalis (55.70%), moderate for P. mildbraedii (39.73%) and V. amygdalina (20.23%) while low for G. latifolium (18.37%).
Concentration of Ni in T. occidentalis, P. mildbraedii, G. latifolium and V. amygdalina are presented in Table 4, which ranged from 0.062±0.013 mg/kg to 0.307±0.210 mg/kg. The findings revealed that Ni levels in the four vegetables were below 68 mg/kg, the limit set by FAO/WHO [27]. The current study found lower Ni levels compared to Lente et al. [15], 1.30 – 2.78 mg/kg, for vegetables irrigated with wastewater in Accra, Ghana. Also, in Kano, Nigeria, Lawal and Audu [46] reported highest mean Ni in vegetables to be 2.02±0.35 mg/kg. Similar level of Ni (0.19 – 0.2 mg/kg) was reported in vegetable collected from markets in Libya [45]. Weigert et al. [52] argued that more than 90% of ingested Ni is held in organic form and can be safely excreted via feces or urine [44]. Therefore, at this Ni level will pose no risk to human health. In terms of variations (Table 4), only G. latifolium showed moderate variation (20.97%) while other vegetables showed high variation (> 50%).
Concentration of Pb in T. occidentalis, P. mildbraedii, G. latifolium and V. amygdalina are presented in Table 4, which ranged from 0.006±0.005 mg/kg to 0.012±0.002 mg/kg. The findings revealed that Pb levels in the four vegetables were below 0.3 mg/kg, the limit set by FAO/WHO [27]. Therefore, at this level there is no risk for toxic effects. Similar observation was made that ranged from 0.1 to 0.5 mg/kg in Libya [48]. However, high levels of Pb have been reported elsewhere. Lente et. al., [15] reported Pb level that ranged from 5.59 to 10.51 mg/kg in vegetables, Odai et al. [36] reported Pb concentration that ranged from 2.42 to 13.50 mg/Kg, Suruchi and Pankaj [53] reported 2.652 mg/kg of Pb in vegetables collected in China. Lawal and Audu [46] reported Pb levels that ranged from 21.22 mg/kg to 35.28 mg/kg in vegetable (A. hybridus, L. sativa, B. oleracea, H. esculentus, A. cepa and L. esculenetum) grown in an irrigated garden in Kano, Nigeria. At high levels, Pb affects human organs such as kidneys, liver, lung and spleen. It also affects the central nervous system and impairs neurodevelopment in children [4]. A study found positive correlation between Pb in the human body and the increase of blood pressure of adults [54]. The variations for Pb in four vegetables are presented in Table 4. The study found no Pb variations (0.00 %) in V. amygdalina, probably due to the markets they were collected falling in the same zone (Owerri) and thus share similar environmental factors [55]. For other vegetables, variations were low (P. mildbraedii and G. latifolium) and moderate (T. occidentalis).
Zn levels in T. occidentalis, P. mildbraedii, G. latifolium and V. amygdalina are presented in Table 4, which ranged from 63.55±4.055 mg/kg to 104.126±24.080 mg/kg. The findings revealed that Zn levels in the four vegetables were above 60 mg/kg, the limit set by FAO/WHO [27]. Low levels of Zn less than 10 mg/kg have been reported for vegetables in Ghana [6,15], and some locations in Nigeria viz. Lagos and Kano [35,46]. However, similar concentrations were reported for Zn in vegetables collected from abandoned dumpsites in Owerri, Imo State, which ranged from 75 – 225 mg/kg [3]. High Zn in these vegetables could be from the planting soil. High Zn has been reported for soils in the state [3,21,56]. This could also be responsible for the low Zn variations in the vegetables, except for T. occidentalis (Table 4). Zn can reduce immune function, levels of high-density lipoproteins [57]. It also causes growth retardation, delayed sexual maturation, infection susceptibility, and diarrhea in children [6].
Heavy metals correlation matrix in vegetables
Correlation analysis has been widely used in analytical environmental studies. Information regarding relationships between multiple heavy metals in a sample matrix is depicted by correlation analysis. Such analysis enables understanding of how environmental factors affect chemical components in a matrix [44] and how some of the heavy metals influence their concentration. When matrix coefficient is positive between heavy metals in a sample, it may suggest similar contamination or pollution sources e.g. contaminated soil, water or air, while when it is negative, it may suggest dissimilar contamination or pollution sources. The strength of correlation is based on the coefficient values. The computed correlation matrix for heavy metals in four vegetables is displayed in Figure 4. The highest positive correlation (0.7) occurred between Cu and Zn while the most negatively correlated metals were Cd and Cu (−0.22). Other positively correlated metals include Cd/Pb, Co/Pb, Cu/Ni, Ni/Zn and Pb/Zn. This indicates that the heavy metals were generally anthropogenic origin such as irrigation water, farm soil, and pesticides or from traffic on the highways, with possible multi-element contamination which could double the effect of the toxic metals if ingested through consumption [45,58,59]. Similar observation was also made for some metals in vegetables from markets in Tamale, Ghana [6].
Contamination assessment
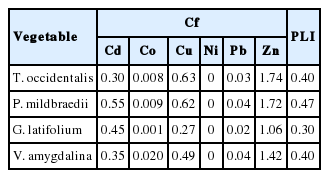
Cf value reveals the level of contamination by individual metals in the vegetable. The significance of intervals of Cf has been described. Cf value less than 1 reveals low contamination, less than 3 and greater than or equal 1 reveals moderate, less than 6 and greater than or equal 3 reveals considerable contamination, and greater than or equal 6 reveals very high contamination [3,9]. The computed toxicity factor is presented in Table 5. All samples showed low Cf values for all heavy metals except for Zn which was moderate. The Cf order for heavy metals in vegetables was Zn > Cu > Cd > Pb > Co > Ni for T. occidentalis, P. mildbraedii and V. amygdalina, while Zn > Cd > Cu > Pb > Co > Ni for G. latifolium.
PLI informs on the collective load of the studied heavy metals in each vegetable. The computed PLI is presented in Table 5. When the PLI is greater than a unit, it means that the vegetable sample is highly polluted. However, when the PLI is less than a unit, it indicates no pollution. All vegetable samples are not polluted with the studied heavy metals (<1). However, PLI order for vegetables was P. mildbraedii > T. occidentalis and V. amygdalina > G. latifolium.
Health risk assessment
Humans are exposed to heavy metals by many pathways via oral, dermal or inhalation. From ingesting heavy metal contaminated vegetables, humans may be at risk. In environmental analytical studies, health risks of any pollutants to human are often detected from its routes of exposure as it is very essential to estimate exposure level (computed via daily intake estimate). Although daily metal intake estimate does not take it into account the possible metabolic ejection of the metals, it can easily tell the possible ingestion rate of a particular metal. The human health risk associated with the ADI was determined for adult and children using the mean concentrations of Cd, Co, Cu, Ni, Pb and Zn (Table 4) in the various vegetables and obtained results are presented in Table 6.

Average daily intake (ADI, mg/person/day) of heavy metals through consumption of contaminated vegetables
The ADI values for adult and children were compared with the recommended provisional tolerable daily intake (PTDI) given by FAO/WHO [60]. All ADI values for both adult and children were lower than the tolerable limit except for Zn (60.83–423.98 mg/person/day greater than 60). Zn can reduce immune function and levels of high-density lipoproteins [57]. It can also cause growth retardation, delayed sexual maturation, infection susceptibility, and diarrhea in children [6]. According to Hambidge and Krebs [61], Zn caused death of about 800,000 children death worldwide every year. Comparing our results to other study, Singh et. al. [40] reported high ADI of Zn (84.28–1091.71 mg/person/day) in vegetables growing in an area irrigated by wastewater in Varanasi, India. Zn is an essential mineral for proper body functioning but can cause adverse effects from excessive ingestion [3,51]. Children generally ingest more heavy metals on daily basis from vegetable consumption compared to adults, basically due to their body weight. Similar observation was also made for some metals in vegetables (cabbage, carrot, green pepper, onion and tomato) from markets in Tamale, Ghana [6], vegetable crops (lettuce, cabbage and pepper) irrigated with wastewater in Accra, Ghana [34] and spinach grown in Ellala River in Northern side of Mekelle city, Tigray, Ethiopia [62].
Percent contributions of vegetables in ADI of heavy metals through vegetable consumption are varied (Figure 5). Overall P. mildbraedii contributed highest to ADI of heavy metals. Individual distribution was P. mildbraedii (40 %) > G. latifolium (34 %) > V. amygdalina (14 %) > T. occidentalis (11 %) for Cd; P. mildbraedii (69 %) > T. occidentalis (29 %) > G. latifolium and V. amygdalina (1 % each) for Co; P. mildbraedii and T. occidentalis (35 % each) > G. latifolium (16 %) > V. amygdalina (14 %) for Ni; P. mildbraedii (41 %) > G. latifolium and T. occidentalis (20 %) > V. amygdalina (19 %) for Cu; P. mildbraedii (43 %) > V. amygdalina (22 %) > G. latifolium (20 %) > T. occidentalis (19 %) for Pb; P. mildbraedii (38 %) > G. latifolium (26 %) > V. amygdalina and T. occidentalis (18 %) for Zn.
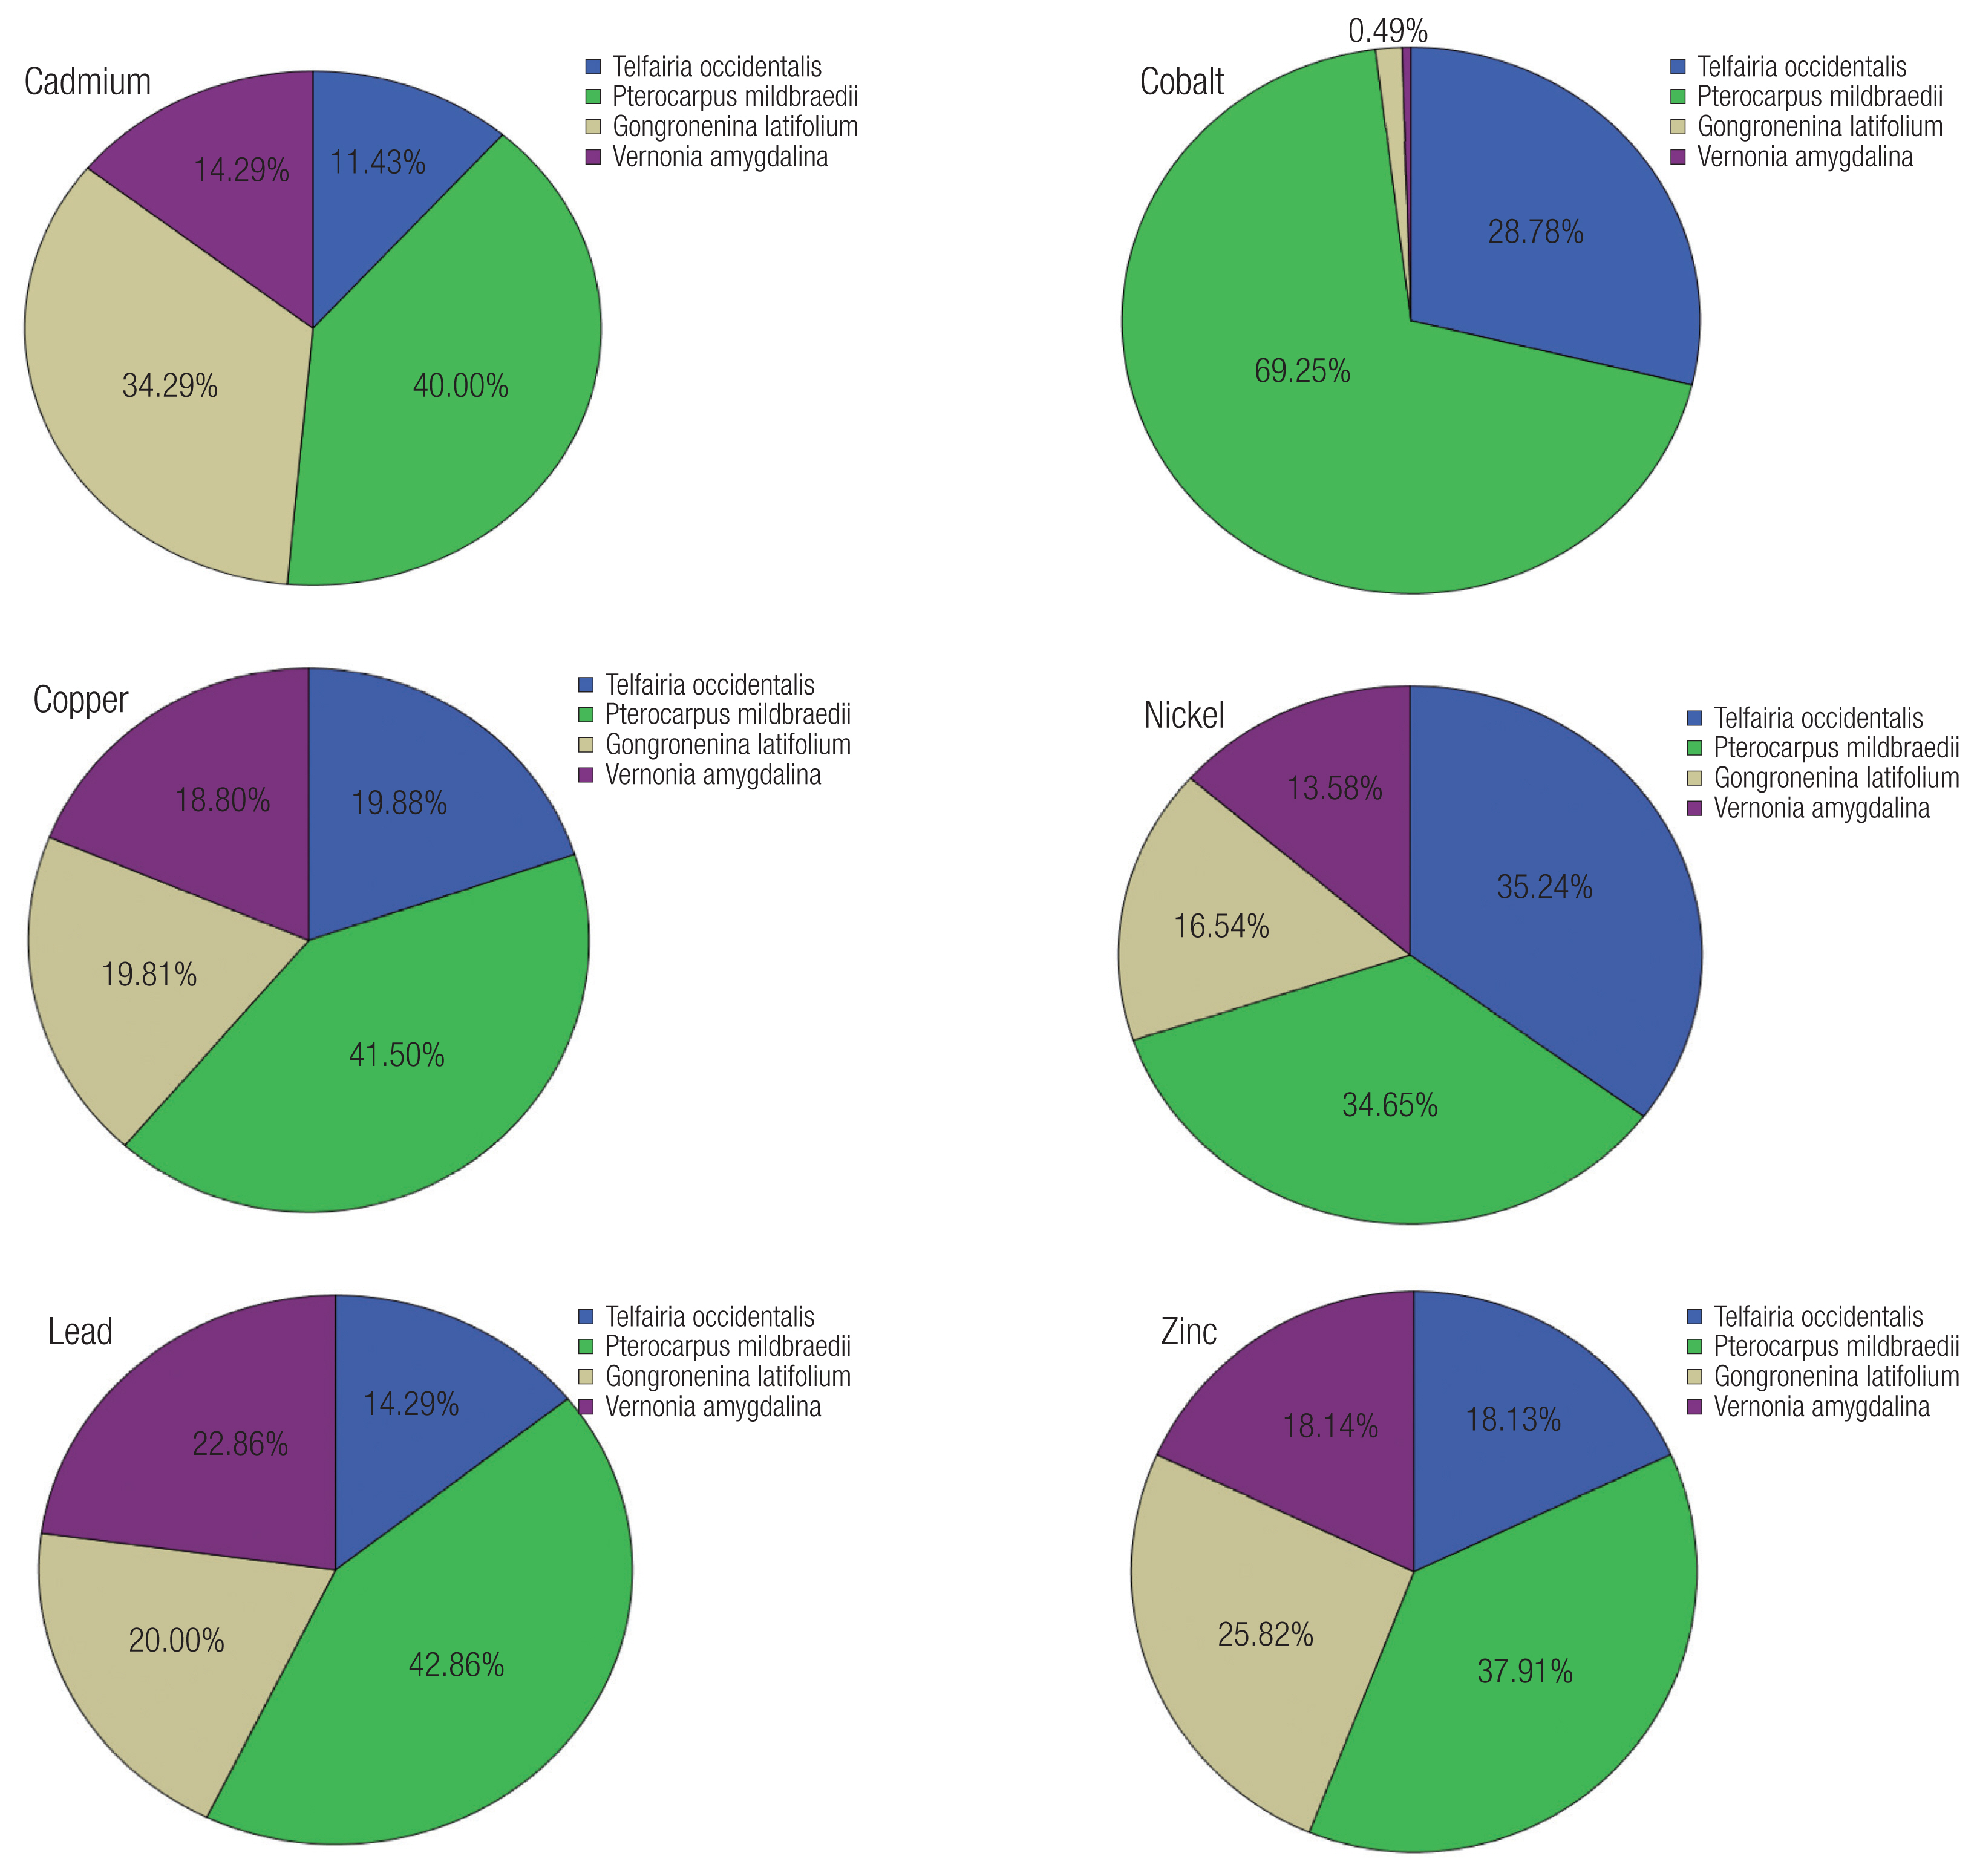
Percent contribution of vegetables to average daily intake (ADI) of heavy metals
*Cd: cadmium, Co: cobalt, Cu: copper, Ni: nickel, Pb: lead, Zn: zinc.
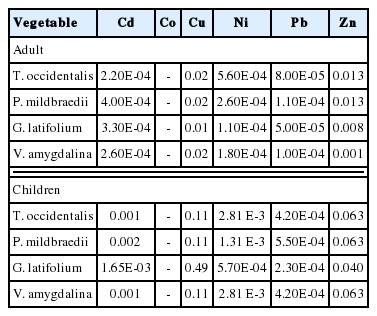
Computed non-carcinogenic THQ and HI of various vegetables for adult and children are presented in Table 7 and Figure 6 respectively. Evidently, all THQs were less than 1 for all vegetables for both adults and children. THQs less than 1 was also reported in previous studies [6,34]. Ametepey et al. [6] studied vegetables (cabbage, carrot, green pepper, onion and tomato) from markets in Tamale, Ghana, and reported low THQs for some metals such Pb, Zn, and Cu. Similarly, Lente et al. [34] studying vegetable crops that have been irrigated with wastewater in Accra, Ghana reported low THQs for Cu, Zn, Pb, Ni, Cd and Co. Hence, there is no need for concern regarding the normal consumption of the vegetables in terms of potential health risk from heavy metal toxicities.
HI values of the heavy metals were also less than one for both adult and children (Figure 6), which is considered safe and pose no overall non-carcinogenic risk from consumption. Hence, HI recorded in Imo State markets indicates that contribution of heavy metals cannot lead to aggregate risk via consumption of vegetables. Similar, studies conducted by Lente et al. [34] found low HI for vegetable crops in Accra, Ghana. In contrast, very high HI values were observed in cabbage, green pepper, onion and tomato from markets in Tamale, Ghana [6].
Conclusion and recommendation
The aim of the present study was to evaluate the concentrations of heavy metal of commonly consumed vegetables and modeling them for contamination and associated health risks in Imo State, Nigeria. The levels of studied heavy metals in the various vegetables were generally below the limit of FAO/WHO except for Zn, showing moderate contamination by Zn in the studied vegetable. However, the overall load of individual in vegetables indicated no pollution. Also, ADI was all below the PTDI, except for Zn. Correlation profiling of the metals revealed strong correlations between the metals, indicating that the metals were generally of anthropogenic origin with potential multi-element contamination which could double the effect of the toxic metals if ingested. However, the individual hazard quotient values were all below 1, indicating an acceptable level of non-carcinogenic adverse risk for the heavy metals in vegetables. The HI for both adult and children were also below 1, suggesting in overall no adverse health risk. Based on the findings of this study; the heavy metals in vegetables in markets in Imo state is at acceptable levels except for Zn and will generally pose no risk from normal consumption. However, detrimental effects may become from prolonged consumption of these vegetables [63,64]. Though vegetable intake is just a proportion of food consumed, supplementary or complementary food that may include fish, meat and rice, that are consumed alongside vegetable in the area can also contribute and increase amounts of heavy metals. Therefore, it is recommended that monitoring toxins levels and extensive analysis of more vegetables including vegetable crops and other food sources should be carried out at regular intervals, such as by season, to reveal the pollution status and health implications from consumption. This will inform on the mitigation measures to be taken and ultimately prevent these avoidable health problems.
Notes
CONFLICT OF INTEREST
The authors declare no conflict of interest regarding the publication of this manuscript.

