Comparison of volatile organic compounds between cigarette smoke condensate (CSC) and extract (CSE) samples
Article information
Abstract
Cigarette smoke is a major risk factor for several diseases, including chronic obstructive pulmonary and cardiovascular diseases. The toxicity of the cigarette smoke can be determined in vitro. The cytotoxicity test of the cigarette smoke is commonly conducted using the cigarette smoke condensate (CSC) and cigarette smoke extract (CSE). The CSC and CSE methods are well known for sampling of the particles and water-soluble compounds in the cigarette smoke, respectively. In this study, the CSC and CSE were analyzed by using a gas chromatography-mass spectrometry (GC-MS) system equipped with a wax column for separation of the volatile organic compounds. The cytotoxic effect of the CSC and CSE were evaluated thoroughly by comparing the analytical results of the CSC and CSE samples. The total concentration of the volatile organic compounds detected in the CSC sample was similar to that in the CSE sample based on the peak area. Except for the dimethyl sulfoxide solvent, nicotine had the highest concentration in the CSC sample, while acetonitrile had the highest concentration in the CSE sample. The compositions were as follows: (1) CSC sample: 55.8% nicotine, 18.0% nicotyrine, 3.20% 1,2,3-propanetriol, triacetate, 1.28% ethyl chloride, 1.22% phenol, etc. and (2) CSE sample: 18.7% acetonitrile, 18.0% acetone, 12.5% 2-hydroxy-2-methyl-propanenitrile, 8.98% nicotine, 5.86% nicotyrine, etc. In this manner, to accurately examine the cytotoxicity of the cigarette smoke using CSC or CSE, the components and their concentrations in the CSC and CSE samples should be considered.
INTRODUCTION
Cigarette smoke contains several toxic compounds that can cause diverse diseases, including respiratory diseases [1-3]. Many researchers have studied cigarette smoke-related diseases like lung cancer, cardiovascular disease, and chronic obstructive pulmonary disease [4,5]. Recently, electronic cigarettes are being marketed as less harmful alternatives to tobacco smoking [6]. However, the cigarette industry is still one of the most profitable and deadly industries in the world [7]. In addition, the market volume of the cigarette industry is still large, despite the market growth of the electronic cigarettes. Thus, the manufacturing, distribution, and marketing of cigarette products need to be regulated, and the regulations should be based on the results of the study of cigarette smoke-related diseases.
The toxicity test for the cigarette smoke are commonly performed using animal or cell experiments [8,9]. In case of the cytotoxicity test, a solution that absorbs cigarette smoke is generally used and cells are exposed to it [10,11]. There are two main types of cigarette smoke solutions: (1) Cigarette smoke condensate (CSC) is obtained by dissolving the particulate phase of cigarette smoke. The cigarette smoke is collected by a filter pad and then eluted using a solvent such as dimethyl sulfoxide (DMSO), methanol, and ethanol [12]. (2) Cigarette smoke extract is obtained by dissolving the water-soluble gas and particle phases of cigarette smoke. The cigarette smoke sample is directly absorbed in phosphate buffer saline (PBS) using impingers [13]. Because the compounds in CSC and CSE are different, the toxicities determined using the CSC and CSE will differ.
In this study, the qualitative analysis of the volatile organic compounds (VOCs) in the CSC and CSE samples was conducted. Cigarette smoke was generated and smoke samples were collected and pretreated by the CSC and CSE methods. The CSC and CSE samples were then analyzed using gas chromatography with mass spectrometry (GC-MS) [14]. The identification of the VOCs in the cigarette smoke solutions should contribute to the understanding of the cigarette smoke toxicity.
METHODS
Cigarette Smoke Generation
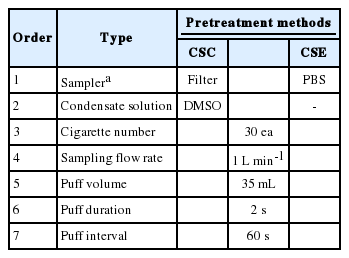
The 3R4F reference cigarettes were used to generate cigarette smoke (University of Kentucky, Lexington, KY, USA). They were conditioned following international organization for standardization (ISO) standard 3402, i.e., at approximately 48 h at 22±1˚C and 60±3% [15]. The cigarettes were smoked on a CSM 2080 30-port smoking machine for the qualitative analysis of the smoke solution under ISO machine smoking conditions following ISO 3308 [16] (Table 1). The puff duration, puff volume, filter vent blocking, and interpuff period were 2 s, 35 mL, 0%, and 60 s.
Preparation of cigarette smoke condensate (CSC) sample
The CSC sample was prepared by smoking the cigarettes on the smoking machine. The total particulate matter (TPM) from generated cigarette smoke was collected on a Whatman Cambridge filter pad (Whatman Grade F319-04, model number: 97039654, diameter: 44 mm, weight: 1.61 pounds, and shape: circle) (GE Healthcare, Buckinghamshire, UK) at 1 L min-1 for 5 min using a mini vacuum pump (XR5000, SKC Inc., Eighty Four, PA, USA). The TPM on the filter pad was extracted with DMSO to yield a concentration of 20 mg mL-1 (TPM mass per DMSO volume) in a petri dish. The petri dish filled with the mixture of TPM and DMSO was shaken for 30 min using a twist shaker to increase the extraction efficiency. Finally, the extracted smoke solution was filtrated by using 0.45 μm polytetrafluoroethylene (PTFE) filter [17]. The filtrated solution was used to analyze as a CSC sample.
Preparation of cigarette smoke extract (CSE) sample
In order to collect the TPM from the cigarettes, PBS was used as an absorbed solvent. The inlet and outlet of the impinger filled with the 30 mL PBS were respectively connected to the cigarette smoke gas line and a vacuum pump. The TPM sample from the cigarettes was absorbed by the PBS at 1 L min-1 for 5 min.
Analytical approach and instrumental system
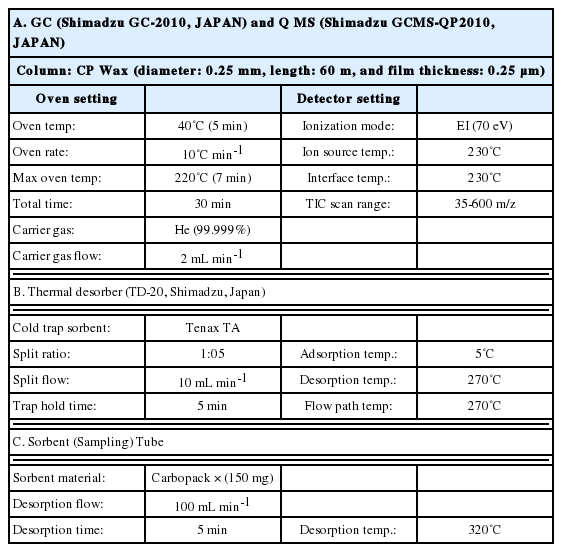
The analysis of VOCs in the CSC and CSE samples in this study was carried out using GC (Shimadzu GC-2010, Japan) equipped with MS (Shimadzu GCMs-QP2010 Ultra, Japan) and a thermal desorber (TD-20, Shimadzu, Japan). Firstly, the prepared CSC and CSE samples were injected onto the sorbent tube via a temporary injection port made from the Teflon tubing that connected the inlet of sorbent tube and a polyester aluminum bag, with a constant supply of the back-up gas from the bag (flow rate = 500 mL min-1 for 2 min). The sorbent tube was filled with 200 mg of Carbopack X used as the collection media to preconcentrate the VOCs in the CSC and CSE samples. The VOCs loaded on the sorbent tube were thermally desorbed at 320˚C (5 min) at a reverse flow of 100 mL min-1 of helium (> 99.9999%) carrier gas. The desorbed analytes were swept into the cold trap (held at 5˚C) in the stream of the carrier gas. The cold trap packed with quartz wool (10 mg) and Tenax TA (50 mg) in a Silcosteel holder (Shimadzu, Japan) was then rapidly desorbed (270˚C for 5 min) in a reverse flow of carrier gas in order to transfer (inject) the VOCs into the column (CP wax - length: 60 m, diameter: 0.25 mm, and thickness: 0.25 μm, Agilent, USA). The transfer/injection of analytes from the cold trap into the GC column was carried out by splitting the flow between the column (2 mL min-1) and the split vent (10 mL min-1). The oven temperature was initially set at 40˚C (for 5 min), ramped at 10°C min-1 to 220˚C, and held at this temperature for 7 min (a total run time of 30 min).
To detect VOCs, the interface and ion source temperatures were set relatively high (e.g., at 230˚C) in order to prevent contamination in the MS system. The VOCs were examined in total ion chromatographic (TIC) mode over a mass range of 35 to 600 m/z. Detailed information on the instrumental system is included in Table 2.
RESULTS AND DISCUSSION
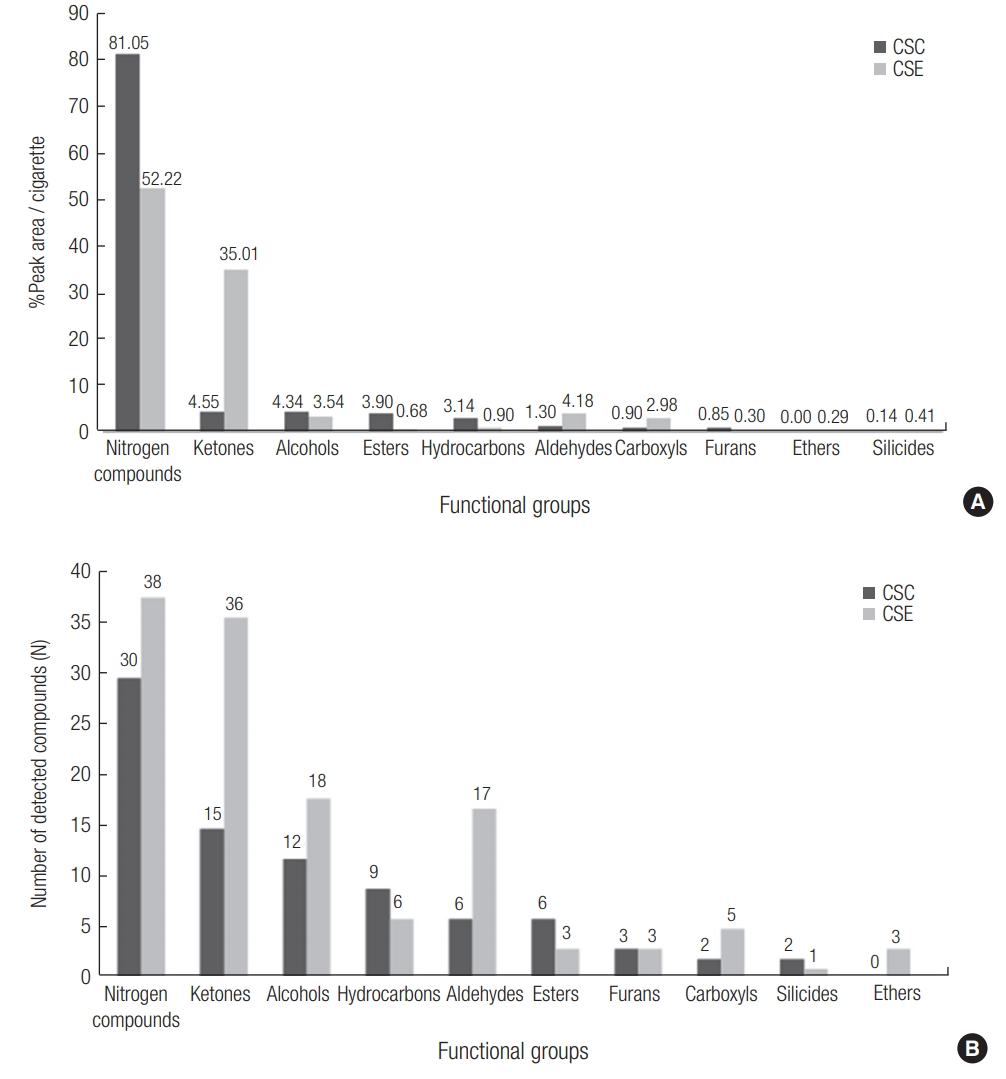
The VOCs contained in CSC and CSE samples were separated by a GC system with a Wax column and detected by a MS system. A total of 164 VOCs were detected from the CSC and CSE samples (except the VOCs detected in each solvent, solvent blank correction). The kinds and peak areas of detected VOCs were different between the CSC and CSE samples. The CSC samples were dominated by nitrogen compounds (NC) with %peak area of 81.0% (ketone: 4.55%, alcohol: 4.34%, ester: 3.90%, hydrocarbon: 3.14%, aldehyde: 1.30%, others: below 1%) (Eqn (1)). In case of the CSE sample, NC and ketone have high %peak areas of 52.2% and 35.0%, respectively. Here, %peak area of each compound is calculated as follows:
The number of VOCs detected in the CSE sample was higher than that detected in the CSC sample: number of detected VOCs = 130 (CSE) and 80 (CSC). The patterns of the number of the detected VOCs between CSC and CSE samples were similar to those of the %peak areas. In case of the CSC, the number of detected NC was higher than other compounds (number of detected compounds in the CSC sample = 30 NC, 15 ketones, 12 alcohols, 6 aldehydes, 6 esters, and other compounds). In CSE sample, the number of detected NC was highest along with 36 ketones, 18 alcohols, 17 aldehydes, 6 hydrocarbons, 5 carboxyls, and other compounds (Figure 1).
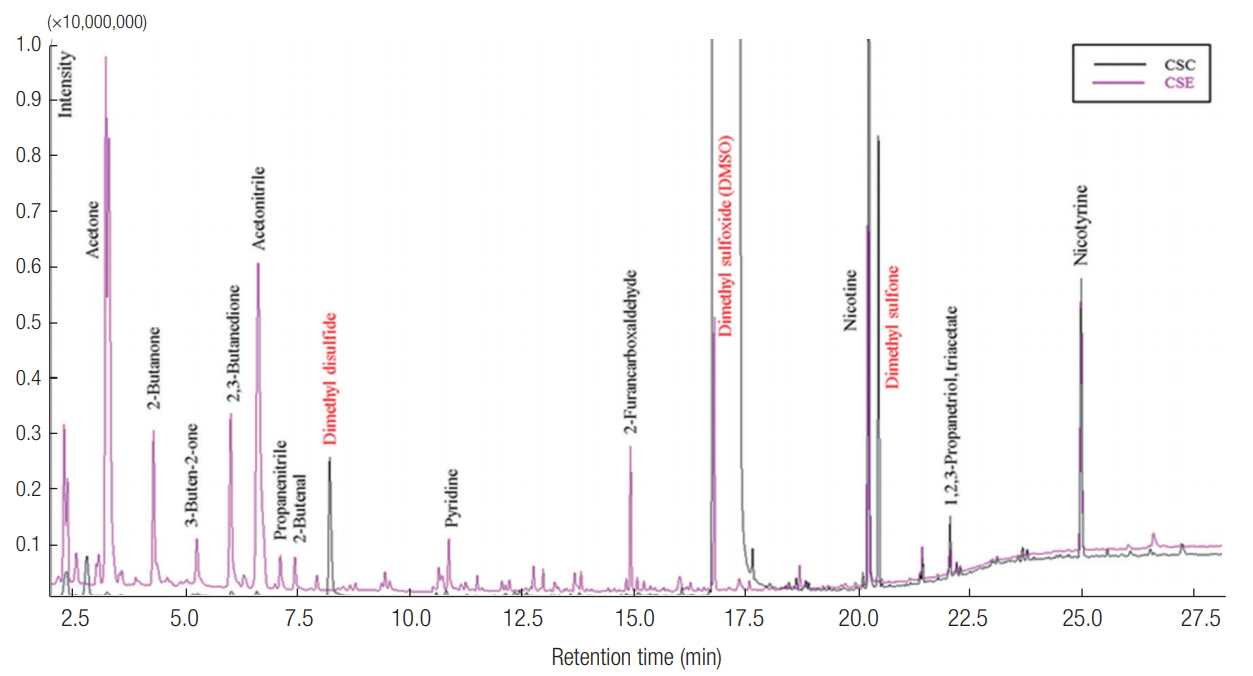
The chromatograms of VOCs obtained from the analysis of CSC and CSE samples are presented in Figure 2 (analytical volume = 0.2 μL (CSC) and 2 μL (CSE)). As shown in Figure 2, most VOCs with a relatively short retention time were detected in the CSE samples. The peak areas of VOCs with relatively long retention time were relatively higher in the CSC sample: VOCs with a retention time of < 20 min accounted for < 15% of total peak areas, while the peak areas of VOCs with a relatively long retention time (above 20 min) correspond to about 85% of the total peak areas (Figure 3). Because the CSE samples contained the gaseous compounds with relatively light molecular weights, most VOCs detected from the CSE samples had relatively short retention times. In contrast, the VOCs of the CSC samples that collected most smoke particles have relatively long retention times.
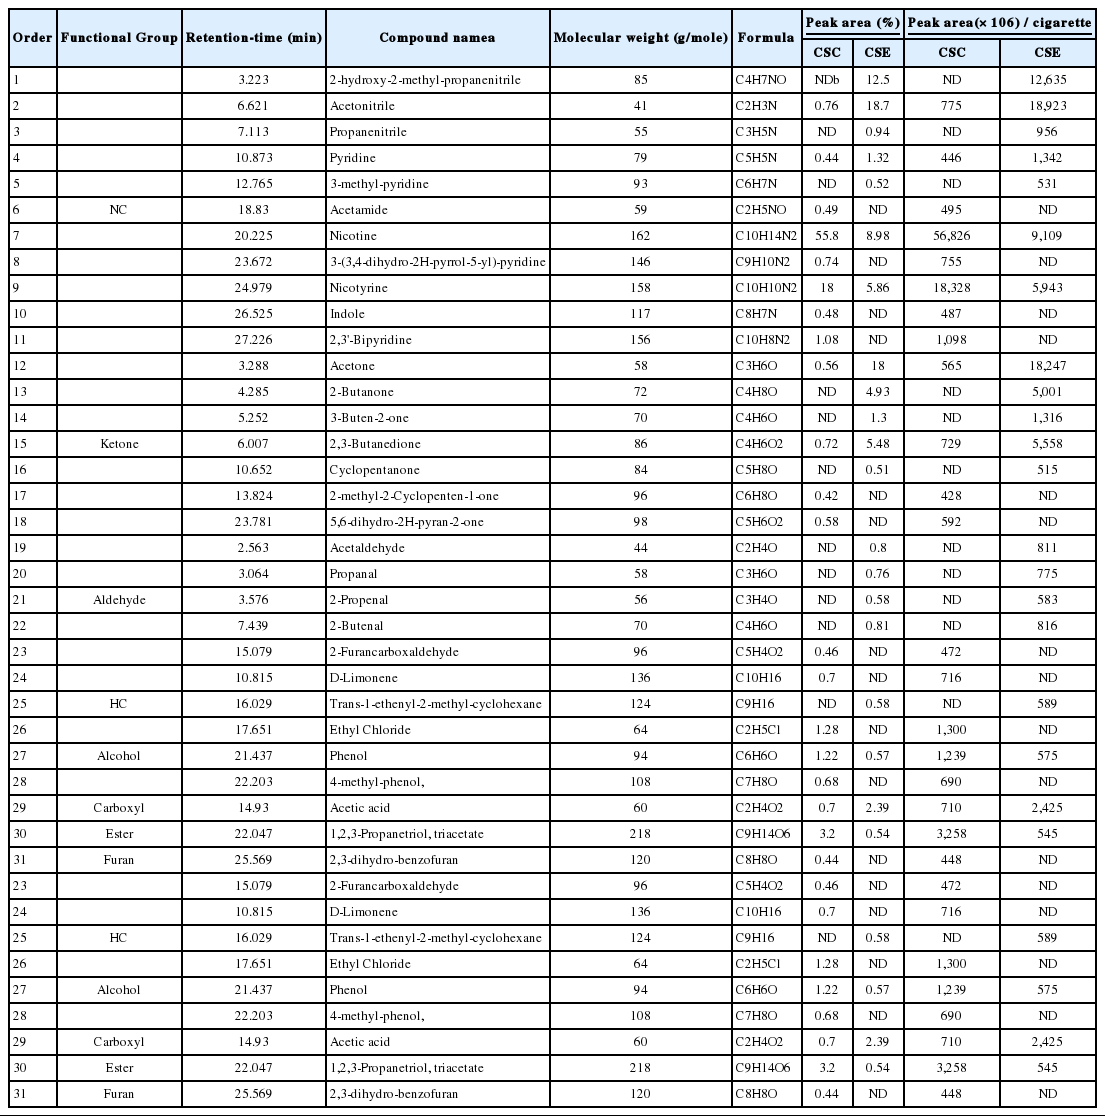
Table 3 shows the peak areas of VOCs detected from one cigarette smoke between CSC and CSE samples (peak area / cigarette) (top 20 VOCs with highest peak areas in CSC or CSE sample) (Eqn (2)).
In case of nicotine, CSC had the highest peak area of 56,826, while CSE had just 9,109. This indicates that nicotine existed mainly in the particulate phase. The peak areas of other VOCs in the CSC and CSE samples also differed per cigarette. 4-methylphenol, 3-(3,4-dihydro-2H-pyrrol-5-yl) pyridine, 5,6-dihydro-2H-pyran-2-one, and indole were only detected in the CSC sample with relatively long retention time (> 20 min). In contrast, relatively light VOCs such as acetaldehyde, propanal, 2-butanone, 2-hydroxy-2-methyl-propanenitrile and 2-propenal were only detected in the CSE sample. Although some light VOCs like acetone, acetonitrile, and 2,3-butanedione were also detected from CSC samples, their peak area values of the CSC samples were significantly lower than those of the CSE samples (Table 3).
We confirmed that the composition and quantity of VOCs in particulate and gas phases of cigarette smoke were different through the analysis of the CSC and CSE samples. Thus, to obtain the qualitative and quantitative data about the components of cigarette smoke solutions, the toxicity test should be performed using CSC and CSE separately.
CONCLUSION
The CSC and CSE are representative cigarette smoke solutions for conducting the cigarette smoke toxicity test. The components of CSC and CSE samples differ because the sampling and pretreatment approaches are different. In this study, CSC and CSE samples were analyzed using a GC-MS system and detected VOCs of the CSC and CSE samples were compared. In CSC, most VOCs were NC with 81% of total peak areas. In case of CSE, NC and ketones were dominant with 52.2% and 35.0% of total peak areas, respectively. Relatively light VOCs (molecular weight < 100 g/mole) were mainly detected in the CSE sample, while most relatively heavy VOCs (molecular weight > 100 g/mole) were detected in the CSC sample. In addition, the quantity of detected VOCs was also different between CSC and CSE samples. For example, nicotine which is a typical component of cigarette smoke was detected in both CSC and CSE samples. However, the peak area of nicotine detected in CSC was about five times higher than that in CSE. In conclusion, the analysis of CSC and CSE samples to obtain the qualitative and quantitative data is necessary to determine the toxicity of cigarette smoke solutions.
Acknowledgements
This work was supported by a grant (14182MFDS977) from the Ministry of Food and Drug Safety in 2017.
Notes
The authors have no conflicts of interest associated with the material presented in this paper.
