Does wastewater discharge have relations with increase of Turner syndrome and Down syndrome?
Article information

Abstract
The purpose of this study is to examine whether water and air pollutants have a relationship with an increase in the genetic disorders Turner syndrome and Down syndrome, which are caused by congenital chromosomal abnormalities, and to generate a hypothesis about the genetic health effects of environmental pollutants. A panel regression based on random effect was conducted on Korea’s metropolitan councils from 2012 to 2014. The dependent variable was the number of Turner syndrome and Down syndrome cases, and the main independent variables were those regarding the water and air pollution. Air pollutants did not have a significant impact on the number of Turner syndrome and Down syndrome cases; however, the increase in number of wastewater discharge companies did have a significant relationship with the number of cases. The more the number of wastewater discharge companies, the more the number Turner syndrome and Down syndrome cases were observed. Therefore, scientific investigation on water and air pollutants in relation with genetic health effects needs to be performed.
INTRODUCTION
Turner syndrome and Down syndrome are genetic disorders that are caused by congenital chromosomal abnormalities. However, various chemical substances that cause genetic mutations in organisms are being discharged through the current state of environmental pollution [1]. Therefore, the possibility of genetic disorders due to environmental pollution cannot be ruled out. When chemical substances that are environmental mutagens are absorbed by the body, it is possible for them to accumulate and change chromosomes rather than be easily excreted from the body [2]. If such modified chromosomes were to affect reproductive cells, they could bring about hereditary diseases in offspring that in the worst case would continue for subsequent generations [3]. Therefore, environmental pollutants cannot be seen irrelevant as a cause of genetic disorders and such causality must be closely examined.
Turner syndrome is a genetic condition that is caused by a female chromosomal abnormality in which an aberrance occurs in one of the X-chromosomes. More specifically, Turner syndrome can be diagnosed when chromosomal abnormality only occurs in some cells (which is known as mosaicism) and when accompanied by clinical signs. In other words, an abnormality of the X-chromosome alone is not regarded as Turner syndrome and must be associated with clinical signs [4]. Down syndrome is the most common of the chromosomal abnormality disorders and is caused by the presence of an additional, or third copy, of chromosome 21 [5]. The specific cause of the disease has not been identified, however, there exists a significant correlation between the mother’s age and the occurrence of Down syndrome (with mothers aged 35 and older being at higher risk) [6].
The cause of chromosomal abnormalities in disorders such as Turner syndrome and Down syndrome have not been clearly identified. On the one hand, various environmental factors that cause danger to human ecology have been recently discovered, including water and air pollution due to increased toxic chemical emissions. The emission and discharge of toxic chemicals can cause birth defects, expedite DNA damage to the fetus, and bring about chromosomal abnormalities (which may negatively impact cytological genetics) [7]. This study examines whether water and air pollutants impact the increase in occurrence of congenital chromosomal abnormality disorders such as Turner syndrome and Down syndrome.
METHODS
This study used samples of Korea’s metropolitan councils between 2012 and 2014, a dataset from the Korea Informative Classification of Disease (KOICD) [8] and the Korean Statistical Information Service (KOSIS) [9]. The dependent variables were the number of Turner syndrome and Down syndrome patients in 17 metropolitan councils of Korea (i.e., Seoul, Busan, Incheon, Daegu, Gwangju, Daejeon, Ulsan, Jeju, Sejong). The reason that the dependent variable was measured by the number of cases, instead of prevalence rate, was that the dataset was not a cohort and floating population was not reflected in this dataset. Therefore, this study used raw data published by the KOICD as a dependent variable. The independent variables were the factors regarding water and environmental pollutants such as the number of wastewater discharge companies, the amount of chemical emissions from local businesses, the amount of chemical emissions consigned for processing, the generation amount of fine dust (particulate matter less than 10 μm in aerodynamic diameter), the amount of ozone, and the amount of nitrogen dioxide and carbon dioxide emissions. These factors were available on the KOSIS. According to this service, those variables were categorized as factors causing pollution. Stress recognition by region was also considered as an additional variable. The dataset of stress recognition was also available on the KOSIS. The reason this article considered stress recognition by region an additional variable was that excessive stress has the possibility of causing sequelae to fetuses and pregnant women [10].
Since the differences among the units of the variables were large, a logarithm was applied to the variables. Additionally, a panel regression analysis that reflected change over time was conducted [11]. A random effect model was carried out in order to control the confounding variable, which was not considered in this panel regression analysis. The random effect model refers to Yit = βXit+α+uit+εit, where uit represents the between-entity error, and εit represents the within-entity error. This model assumes, cov (xit, ui) = 0, which means no correlation exists between explanatory variables and error terms. All analyses were performed by using the Stata version 12 (StataCorp., College Station, TX, USA).
RESULTS
Table 1 indicates the descriptive statistics of variables. As mentioned above, using the logarithm unified the units of variables.
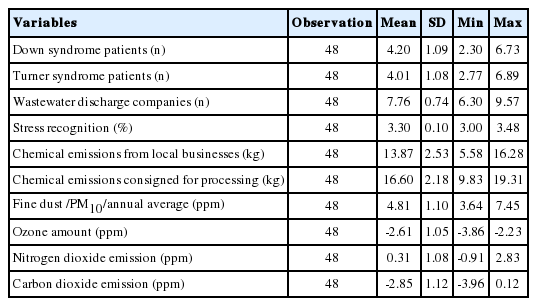
Descriptive statistics of logarithmed variables
In this article, the independent variables were the logarithm numbers of Turner syndrome and Down syndrome patients and key explaining variable was the logarithm number of waste-water discharge facilities. The means of the logarithm numbers of Turner syndrome and Down syndrome patients among metropolitan councils in Korea were 4.20 and 4.01, respectively, and the standard deviation (SD) of the logarithm numbers of Turner syndrome and Down syndrome patients was 1.09 and 1.08, respectively, for 2012 to 2014. The mean of the logarithm number of wastewater discharge facilities was 7.76 and the SD of the logarithm number of wastewater discharge facilities was 0.74.
As seen in Table 2, wastewater discharge companies have a significant association with the increase of Turner syndrome and Down syndrome patients. Meanwhile, stress, air pollutants, the amount of chemical emissions from local businesses, and the amount of chemical emissions consigned for processing did not show associations with the increase of Turner syndrome and Down syndrome patients.
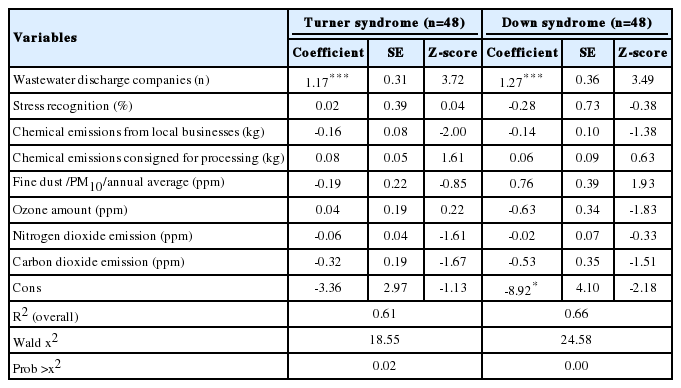
Regression analysis between environmental pollutants and the number of Turner syndrome and Down syndrome patients for 2012–2014 in Korea
DISCUSSION
In the present study, the number of local wastewater discharge companies shows a statistically significant association with the increase in Turner syndrome and Down syndrome cases. The result also implies the possibility that environmental pollutants can cause genetic mutations. Wastewater from various facilities may contain various toxic substances including mutagens and carcinogens [12]. Wastewaters cannot be released unless the level of pollution meets the guidelines or standard values stipulated by law [13].
Therefore, a close examination of the types of industries that emit toxic substances in wastewater must be conducted through proper management of wastewater discharge companies. In addition, a succeeding in-depth study regarding the potential path that such toxic substances may cause cytological genetic abnormalities is necessary. Also, future studies with cohort data are needed to support this hypothetic study.
Acknowledgements
The author would like to thank Professor Mina Ha for her valuable remarks on this article.
Notes
The author has no conflicts of interest associated with the material presented in this paper.