| Home | E-Submission | Sitemap | Contact Us |  
top_img
Environ Anal Health Toxicol > Volume 39:2024 > Article
Nduka, Umeh, Kelle, Okeke, Iloka, and Okafor: Ecological pollution features and health risk exposure to heavy metals via street dust and topsoil from Nkpor and Onitsha in Anambra, Nigeria

Abstract

The manuscript presents the investigation results on the pollution and risk of metal mines, and it is considered an important report on environmental pollution near mines in Nigeria, with archival value. The research involved soil sampling and heavy metal analysis for about 12 months in three metal mines. Based on these results, the paper provides information on pollution levels and hazards using well-known methods like pollution and ecological risk indexes. The increasing population in urban communities attracted by various industrial, economic and social activities causes contamination of atmospheric environment that can affect human health. We investigated heavy metal distributions, correlation coefficient among elements, ecological indices and probable health risk assessment in street dust and topsoil from Nkpor and Onitsha urban suburb, Nigeria. The mean concentration of heavy metals in car dust from Onitsha and Nkpor suburb follows thus: Fe > Mn > Cu > As > Pb > Ni > Cr. The decreasing trend of heavy metal in rooftop dust from both area: Fe > Mn > Cu > Pb > As > Ni > Cr whereas metal contents in topsoil were: Fe > Mn > Cu > Pb > Ni > Cr > As for both areas. The degree of pollution indices was characterized by contamination factor (CF), geo-accumulation factor (I-geo), pollution load index (PLI), Nemerow (PN), ecological and potential ecological risk index (ER and PERI) which indicated low pollution in the urban street environment. The results of Principal Component Analysis (PCA) and Hierarchical Cluster Analysis (HCA) showed that the estimated heavy metals displayed sources from atmospheric deposition, natural origin and anthropogenic sources. Risk assessment revealed that ingestion of dust and soil was the significant route for heavy metals exposure to the populace followed by inhalation, then dermal contact. Considering all factors, non-cancer risk was more prominent in children than adults and no significant health hazard could be attributed to both aged groups as of the period of study except for As and Ni that needs constant monitoring to avoid exceeding organ damaging threshold limit of 1 × 10⁻⁴.

Introduction

Geometrical population growth, auto - traffic emissions, manufacturing concerns, urban and municipal wastes issues, have led to severe environmental degradation in built up urban environment that are intermixed with toxic inorganic and organic pollutants of air, soil, dust and water [1-3]. Potentially toxins and other emerging pollutants are the major cause of uneasiness in environment, as they considerably deteriorate the ecological quality of the ecosystem [4]. The soil and dust serve as the sinks for the source, release and accumulation of these pollutants due to their non-degradable nature in the environment [5]. The evenly distribution of heavy metals in topsoil and dust may pose health threat to humans via long and short-term exposure by direct oral, inhalation and dermal absorption [6, 7]. The bioaccumulation of heavy metals and metalloids in the internal body organelles can be persistent and bio-toxic which may demean the biological function of the kidney, liver and other sensitive organs leading to skeletal and cardiovascular diseases [8, 9]. Previous studies have documented the level of heavy metals contaminations in urban street and roadside soil and dust [1] [10-19]. In view of the aforementioned studies, urban dust and soil are known contributors to high degree of environmental heavy metals that can damage the ecosystem. The toxicity of these metallic pollutants builds and move up in the body system as in tropic level via bioaccumulation routes and are known detriment to public health [20, 21]. Therefore, it is important to investigate the pollution level of heavy metals in urban street dust and topsoil and probable health risk for the safety of exposed subjects and the existing environment [22]. In order to curb the toxicological effects caused by accumulated heavy metals in dust and soil, it is paramount to identify and assess the pollution sources, especially those emanating from anthropogenic activities [23]. Several studies have been conducted in recent years on the spatial distribution of heavy metals in dust and soil, their source identifications, ecological and public health effects [2][6] [15] [24-28]. Abandoned cars and rooftops of small buildings of shops, workshops, informal sector buildings harbor dusts, thus heavy metal pollution within and around the spots of low-income city dwellers may draw serious concern. Topsoil from densely populated urban areas can take up metallic pollutants which are based on metal chemical fractions. The active physical activities undertaken by children and adults, especially artisans and informal sector workers such as auto – mechanics, welders, auto – electricians, painters, welders, brick layers, transporters, market men and women, with questionable hygienic lifestyle and repetitive hand/finger sucking by children exposes them to environmental pollution from dust and soil. Thus it will be an ideal option to investigate the heavy metal pollutions from dust and topsoil in the urban streets. The main objectives of the study are to evaluate the concentrations of heavy metals (Cr, As, Pb, Mn, Ni, Cu, Fe) in dust from abandoned cars and rooftops and topsoil from urban streets in Onitsha and Nkpor, to identify the anthropogenic source of heavy metals in soil and dust; explore the ecological availability and assess the human health risk through different exposure routes. The results of this research can supply vital information needed for environmental quality management in urban streets and thus provide help for pollution control and urban planning.

Materials and Methods

Study area

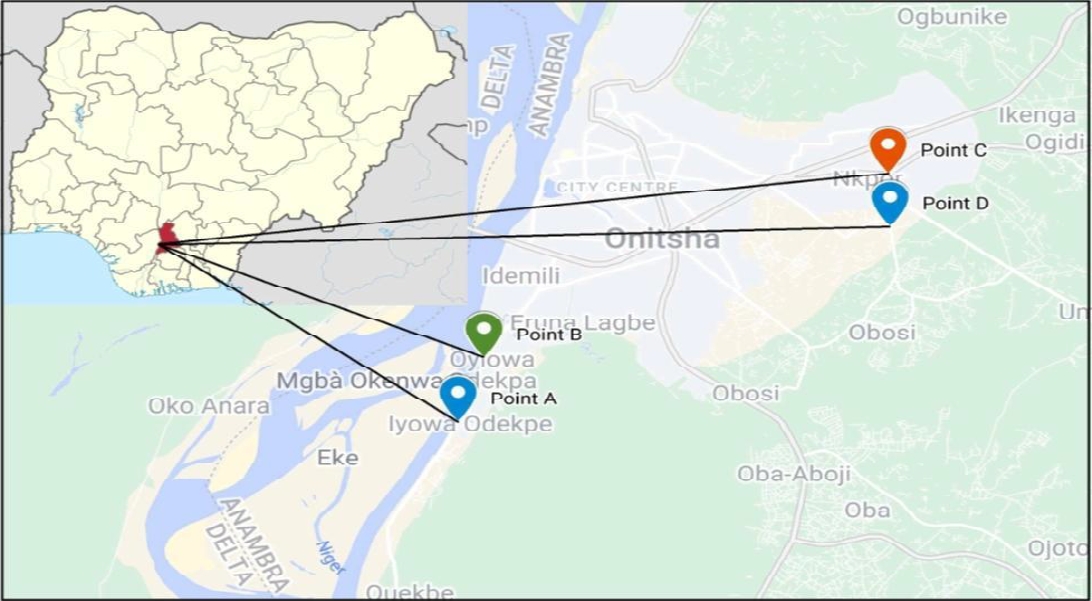
Nkpor and Onitsha are two commercial towns in Anambra province, Southeastern Nigeria. Nkpor is located at Coordinates 6°14’62” N, 6°82’97’’E. Nkpor community is the home of schools, and other highly rated commercial business with a few newly crude oils producing wells in the Omambala and Ogbaru areas that surround it. The climate is hot wet equatorial with average maximum temperature of 30°C and the average minimum of 24°C depending on the season of the year. It is a small town in the periphery of Onitsha whereas Onitsha metropolis is located between latitude 06o51N and 06°161N and longitude 06°421E and 06°531E, it is bounded by Nkpor to the East (Fig 1). Onitsha and Nkpor are commercial and historical towns with thriving informal sector businesses, small and medium scale industries. Onitsha and Nkpor are among the fast-growing economic regions in Nigeria due to their rapid urbanization and enormous business engagements that attracts rapid population growth. The total population of inhabitants in Onitsha is about 1,553,000 and that of Nkpor is 109,377 [29]. Onitsha is known to house the largest urban market in Anambra State, also a major commercial town East of the popular River Niger with moribund River port. Over the years, industrial estates and multinational firms have continued to spring up and city keep expanding leading to a new lexicon ‘‘Greater Onitsha’’, skilled jobs, chain of lucrative businesses, foreign direct investments etc. are springing up, but artisanal and informal sector activities are still dominant.

Sampling and sample preparations

Two (2) streets/roads each from Onitsha (Ukpor and Kara) and Nkpor (Achaputa and Mechanic) with high concentration of artisanal and informal sector activities were selected for the study. Street dust i.e particulate matters that accumulated on packed and abandoned vehicles over a period of time, and topsoil samples were collected at some designated points from the artisanal streets within the urban areas of Nkpor and Onitsha cities considering land use and the presence of potential polluting sources (residential, industrial, commercial, and high traffic routes).
A total of 24 composite dusts samples of 4 subsamples, 96 at Achalputa and Mechanic streets (Onitsha) dust and 96 at Kara and Ukpor streets (Nkpor), totaling 192 samples. Also, a total of 6 composites topsoil of 3 subsamples, 18 at Achalputa and Mechanic streets (Onitsha) and 18 Kara and Ukpor streets (Nkpor), the streets consists of closely built houses of between 18 – 25 buildings. 500 g of topsoil samples were collected from four artisanal streets at depth of 15cm during the period of January 2021 – March 2021. The sampling points were approximately about 50 m apart from each other. Each of the soil samples was a composite of 3-subsamples. Topsoil were air-dried, ground, sieved through 2mm pore size, and stored for further chemical analysis. The dust samples were collected by sweeping the rooftops and car roofs using a clean plastic brush and placed in polyethylene bags and transferred to the geology laboratory where they were first air-dried at room temperature, sieved and then stored for further chemical analysis. The total heavy metals (Fe, Mn, Cu, Ni, As, Pb, and Cr) contents in soil and dust were determined in triplicates using atomic absorption spectrophotometer (AAS, Agilent FS240AA, Varian manufacturing Co. Ltd, Australia) prior to digestion method in HNO3- HCl- HF at the ratio of 1:3:3 following further standard processing [10].

Chemical analysis

The soil samples were air-dried, ground and passed through 2mm pore size to remove debris whereas dust samples were only air-dried. In the analysis, 1g of homogenized and powered soil and dust samples was acid digested with 3 mL of 10M HNO3, 9 mL of 10M HCl and HF in Teflon digestion vessel at 180 °C for about 3 h, and allowed to cool at ambient temperature. Before the chemical analysis, the vessels used were decontaminated using 10 % nitric acid solution and rinsed further with distilled water. All the solutions prepared were then immediately assayed for potential toxic elements using Atomic Absorption Spectroscopy (AAS, Agilent FS240AA, Varian manufacturing Co. Ltd, Australia) equipped with air/acetylene flame were used. The metal standards were prepared from their respective salts and used for the calibration curve for the elemental determination. The limit of detection (LOD) and the limit of quotation (LOQ) for the elements were calculated thrice the standard deviation for the digested blanks. The accuracy and precision of HMs analysis in agricultural soil were checked by analyzing a SRM 2709 standards (certified reference materials of the National Institute of Standards and Technology) for the respective potentially heavy metals in both soil and dust. The percentage recoveries of soil after spike analysis were within the range 83.08 - 96 % (Cr = 89.8 %, Fe = 91.2 %, Mn = 83.03 %, Ni = 93 %, Pb = 92.1 %, Cu = 95 %, and As = 96 %) and average recovery of 93 % for dust HMs in reference, which indicates high accuracy of the analytical/ method for validation of the quality of assessment.

Quality assurance

Quality assurance and quality control were carried out according to standard reference materials (SRM 2709), analyzing blank samples and repetitive analysis. Relative standard deviations between triplicate sets of data were less than 10 %. The percentage recoveries after spike analysis were within the range of 83.08 – 96 %, thus indicating good accuracy and precision.

Estimated intensity of contamination

The intensity of soil and dust contamination by heavy metals was assessed by the following indices; contamination factor (CF), pollution load index (PLI), the geo-accumulation index (I-geo), Ecological risk (ER), potential ecological risk index, and Nemerow pollution index (PN). Their principle is based on the comparison of estimated values against reference values.

Contamination Factor (CF)

The contamination factor is a major tool for identifying the pollution and the contamination level in the environmental matrix. The level of contamination of the street soil and dust by heavy metal was expressed in terms of contamination factor (CF) and determined by employing the model [30, 31]:
(1)
CF=concentration of the metals in soilTarget (background values)
Classes of contamination used to define the contamination factor are thus: CF < 1, low contamination;1 ≤ CF < 3, moderate contamination; 3 ≤ CF ≤ 6, considerable contamination and CF > 6, very high contamination; Background values used were from Alloway, [32] and Rahman et al. [33].
(2)
Igeo=log2Cn1.5Bn
Where Cn is the measured metal concentrations in the examined sample; Bn is the geochemical background while the factor 1.5 is introduced to minimize the effect of possible variations in the background or control values which may be attributed to lithological variations [34] [36]. Seven contamination classes are used to define the degree of pollution intensity based on the increasing value of the index of geo-accumulation as follows: I-geo ≤0 uncontaminated; 0 ≤ I-geo < 1 uncontaminated to moderately contaminated; 1 ≤ I-geo < 2 moderately contaminated; 2 ≤ I-geo < 3 moderately to strongly contaminated; 3 ≤ I-geo < 4 strongly contaminated; 4 ≤ I-geo < 5 strongly to extremely contaminated; I-geo > 5 extremely contaminated [37].

Ecological and Potential ecological risk index (PERI)

The PERI is specially proposed to assess the contamination levels of car dust, rooftop dust and topsoil from an urban street with respect to toxicity of some selected contaminants [38, 39].
(3)
PERI=E
(4)
Er=Tri×CFi
Tri represents toxicity response coefficient for individual heavy metal. The toxic-response factors for Cr, As, Ni, Cu, Mn and Pb were 2, 10, 5, 5, 1 and 5, respectively [40, 41]. Er < 40, low ecological risk; 40 ≤ Er < 80, mild ecological risk; 80 ≤ Er < 160, considerable ecological risk; 160 ≤ Er < 320, high ecological risk; Er > 320, very high ecological risk. PERI < 110, low potential ecological risk; 110 ≤ PERI < 200, moderate potential risk; 200 ≤ PERI < 400, considerable potential risk; PERI ≥ 400, very high potential risk [42].

Pollution load index (PLI)

The pollution load index (PLI) as used by Rahman et al. [33], as shown by equation 5, was used to evaluate the extent of metal pollution level of each urban street.
(5)
PLI=CF1×CF2×   ×CFnn
Where, CF is the contamination factor and n is the number of heavy metals studied. The PLI provides relative means for assessing a site quality. In general, (i) PLI < 1 is considered as perfection, (ii) PLI = 1 is considered as only reference line levels of pollutants are present and (iii) PLI > 1 is considered as worsening of site quality.

Nemerow pollution index

The widespread effect of toxic contaminants and its interpretation at a particular soil and dust environment are revealed using Nemerow pollution index. The equation for calculating Nemerow pollution index (PN) is as used by Huiying et al. [43] and given below
(6)
PN=Cf¯2+Cfmax22
PN is the Nemerow pollution index, Cf the arithmetic mean of contamination factor of all traced elements, and Cfmax the maximum contamination factor among the metals. The PN Nemerow index can be grouped into these classes: PN < 1 (unpolluted); 1 < PN ≤ 2 (slightly polluted); 2 < PN ≤ 3 (moderately polluted); PN > 3 (highly polluted) [43].

Risk assessment

Heavy metal levels in topsoil and dust can pose severe negative impact to humans and environment. Suspension of soil and dust particulates in the atmosphere gets absorbed into the internal body system via inhalation, ingestion and skin contact, therefore, it is important to access the extent of risk to the potential recipient. Non-carcinogenic and carcinogenic risk assessment of heavy metal contaminations in topsoil and dust was evaluated according to United States Environmental Protection Agency theory [44-46]. Average daily dose (ADD) (mg/kg/day) of heavy metals in soil and dust media through ingestion, inhalation and dermal pathways are calculated as follows:
(7)
ADDing=CS×IRing×EF×ED×CFBW×AT
(8)
ADDinh=CS×IRinh×EF×EDPEF×BW×AT
(9)
ADDder=CS×SA×AF×DAF×EF×ED×CFBW×AT
Cs is the concentration of the heavy metals in soil and dusts (mg kg-1); IRing is the ingestion rate (100 mg/day for adult and 200 mg/day for children); EF is exposure frequency of the people (day year-1); ED is the exposure duration (years); CF is the conversion factor in kg/mg, IRinh is the inhalation rate (20 m3/day for adult and 10 m3/day for children); PEF is the particulate emission factors (1.36 × 10⁹ m3 kg-1 for both age groups); SA is the skin surface area (cm2); AF is the skin adherence factor (0.7 mg/cm2 for adult and 0.2 mg/cm2 for children); DAF is the dermal absorption factor (0.1 for both age groups); BW and AT are the body weight (kg) and average exposed time (years), respectively.
Hazard quotient was utilized to estimate the non-carcinogenic health risk of heavy metal in soil and dust through different exposures; hence HQ was computed as the ratio of the average daily dose (ADD) and a reference dose (RfD) as follows:
(10)
HQ=ADDRfD
RfD is the reference dose of heavy metal through ingestion, inhalation, and dermal contact pathways (mg (kg day)-1). The RfDing values of Cu, Fe, Cr, As, Hg, Pb, Mn and Ni are 0.04, 8.40, 0.003, 0.0003, 0.0003, 0.0035, 0.046 and 0.02. The RfDinh values of Cu, Fe, Cr, As, Hg, Pb, Mn and Ni are 4.02E-02, 2.20E-04, 2.86E-05, 3.01E-04, 8.57E-05, 3.52E-03, 1.43E-05 and 2.06E-02 whereas the RfDder values of Cu, Fe, Cr, As, Hg, Pb, Mn and Ni are 1.20E-02, 7.00E-02, 3.00E-03, 1.23E-04, 2.10E-05, 5.25E-04, 1.84E-03 and 5.40E-03. The overall non-carcinogenic risk of selected heavy metals can be evaluated from the HQ values of threefold exposure pathways and is expressed as a hazard index (HI). HI < 1, means non-carcinogenic health risk whereas HI > 1, is assumed to be an occurrence of adverse non-carcinogenic health risk.
(11)
HI=HQder+HQing+HQinh
The tendency of an individual developing cancer over prolonged exposure to the potential carcinogen can be assessed by cancer risk. Carcinogenic risk (CR) is computed using the following equation
(12)
CR=ADD×SF
(13)
TCR=CRi
ADD is average daily dose and SF is cancer slope factor, where i stand for the exposure pathway. Oral SF values of Cr, As, Pb and Ni are 5.01E-01, 1.50, 8.50E-03 and 1.70; Inhalation SF values of Cr, As, Pb and Ni are 4.20E+01, 4.30E-03, 4.20E-02 and 8.40E-01; and dermal SF values of Cr, As, and Ni are 2.00E+01, 3.66, and 4.25E+01. Carcinogenic risk values ranging from 1 x 10⁻⁶- 1 x 10⁻⁴ are considered as a safe limit for human health but when CR exceeds 1 x 10⁻⁴, there is probability of lifetime cancer risk to the human body.

Statistical analysis

The MS Excel 2010, Origin 2021, and SPSS version 26 software (Inc. Chicago, USA) were used for statistical calculations, interpretation of data and Pearson correlation matrixes at significance level. Correlation statistics was used to explain the relationship between the variables and the samples.

Results and Discussion

Elemental analysis in dust and topsoil samples

The elemental concentration in car dust, rooftop dust and topsoil from a representative area of two towns in Anambra, Nigeria alongside with generated basic descriptive data were presented in Table 1. The heavy metal levels in both car and rooftop dust varied widely from 0.000-0.018, 0.160-0.475, 0.000-0.699, 0.000-2.040, 0.000-0.130, 0.000-0.925, 8.484-23.163 mg/kg for Cr, As, Pb, Mn, Ni, Cu and Fe respectively collected from Ukpor in Onitsha. The mean contents of studied heavy metals from Kara in Onitsha for car dust and rooftop dust includes (0.002; 0.000 mg/kg), (0.337; 0.339 mg/kg), (0.378; 0.437 mg/kg), (1.926; 2.469 mg/kg), (0.187; 0.374 mg/kg), (0.877; 0.873 mg/kg), (18.391; 18.697 mg/kg) for Cr, As, Pb, Mn, Ni, Cu and Fe respectively. The mean concentrations of heavy metals recorded in topsoil from Ukpor (Onitsha) and Achalputa (Nkpor) were far below the acceptable limit which depicts insignificant effect of those analyzed metals in soil. The metal contents in topsoil from Achalputa were higher than those from Ukpor except Ni probably because of higher density of human activities in Achalputa than Ukpor. Again, the level of mean heavy metal contents in car and rooftop dust collected from Achalputa at Nkpor were: (0.000; 0.008 mg/kg), (0.396; 0.287mg/kg), (0.295; 0.595 mg/kg), (1.853; 2.938mg/kg), (0.023: 0.117 mg/kg), (0.606; 1.289 mg/kg), (18.621; 17.179 mg/kg) for Cr, As, Pb, Mn, Ni, Cu and Fe respectively. Similarly, in mechanic road (Nkpor), the following mean values were recorded for Cr, As, Pb, Mn, Ni, Cu and Fe in car and rooftop dust: (0.002; 0.001mg/kg), (0.303; 0.012 mg/kg), (0.284; 1.291 mg/kg), (1.853; 3.128 mg/kg), (0.108; 0.144 mg/kg), (0.578; 1.067 mg/kg), (18.621, 16.766 mg/kg). The order of heavy metal contents in car dust from Onitsha and Nkpor area was Fe > Mn > Cu > As > Pb > Ni > Cr. The decreasing trend of heavy metal contents in rooftop dust from both study area was Fe > Mn > Cu > Pb > As > Ni > Cr whereas metal contents in topsoil appeared in this order: Fe > Mn > Cu > Pb > Ni > Cr > As for both areas of study. Relatively abundant elements such as Fe and Mn in the Earth’s crust are produced by altercation (friction) and transport by wind blow and can be associated with dust [47, 48]. The measured heavy metals in different media from both areas were lower than the background standard outlined by Alloway, [32] and Rahman et al. [33], except for arsenic in car and rooftop dust. The high concentration of arsenic may be generated from combustion of diesel and gasoline fuel in automobiles within the sampled locality. The level of Fe, Mn, Cu, As, Pb, Ni and Cr in car and rooftop dust from the sample areas are lower than similar studies carried out within the vicinity of traffic volume, gasoline stations and school buildings [25, 26], [33]. The analyzed metals in topsoil were below some similar reports from urban topsoil [49], urban park and school [5], and park soil [6], and upland soil [22]. Narrow ranges between the minimum and maximum values were observed for all the heavy metals in sample media due to insignificant variation in composition of materials and natural processes or similar level of anthropogenic impact.

Source identification of heavy metals

Correlation analysis

Table 2 gave the Pearson correlation coefficient of heavy metals in car and rooftop dust from both Onitsha and Nkpor. The Pearson correlation analysis of heavy metals in the topsoil was not observed as a result of unavailability of significant values in most sampled points from both urban areas. The Cr metal recorded no correlation in dust with other elements due to its negligible content in the sampled points. The correlation analysis also indicated that Mn-Pb, Cu-Mn, Cu-Pb, Fe-Cu and Fe-Mn were positively correlated with each other at the 0.01 level. Significant correlation indicates common source of heavy metals. When the strong correlation coefficient between the studied factors is positive, it implies these factors may have common source, mutual dependence, and identical behavior during the transport [50]. Accordingly, it can be suggested that the major origin was crustal and anthropogenic contributions. Again, the correlation among Ni-Mn, and Cu-Ni are statistically significant (**p < 0.01), which showed that they might share a common source, such as traffic emission, decomposed auto parts and tyre wear. The significant negative correlations exist between Pb-As, Mn-As, and Cu-As with maximal negative correlation coefficient occurring between Pb-As (r = -0.929).

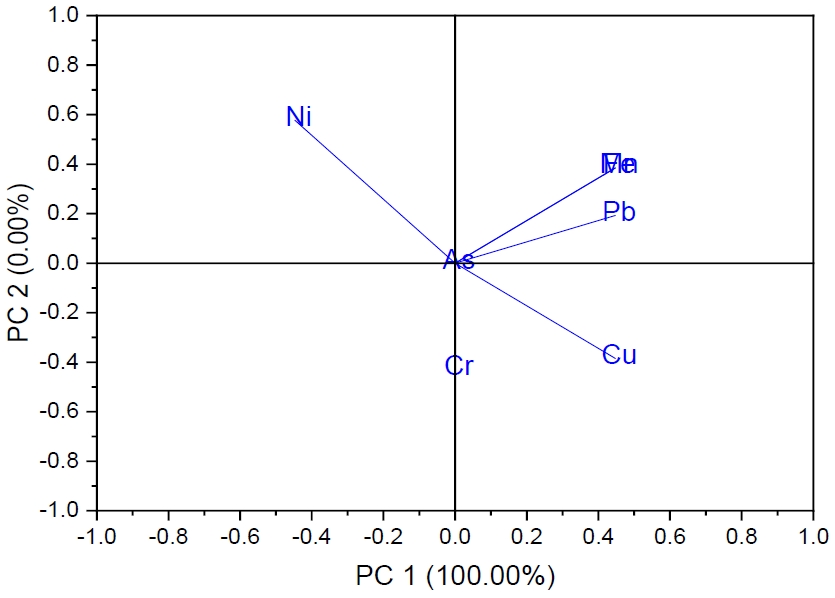
Principal component analysis (PCA)

The deduction sources of heavy metals in street dust and topsoil from both cities using PCA analysis (Figs 2 and 3). Two principal components were extracted in dust and soil which explained 86.79 % and 100 % of total variance. The first principal component in dust explained 66.18 % of total variance with significant loadings of Mn, Pb, Cu with variation coefficients greater than 0.5 whereas the second component depicted total variance of 20.61 % with significant component loading of Fe. The results from both PC1 and PC2 suggest anthropogenic and natural enrichment of the metals in the studied media. Pb and Cu pollutants in dust originate from engine wears, automobile breaking, leaded gasoline, and other traffic pollutions [51, 52]. In the topsoil, the first component contribution rate was 100 % and no higher loadings of heavy metals was observed while the second principal component with variance of 0 % experienced a remarkable loading Ni value above 0.5 which indicates influence of human activities. Ni might be associated with natural sources usually present in soil parent materials.

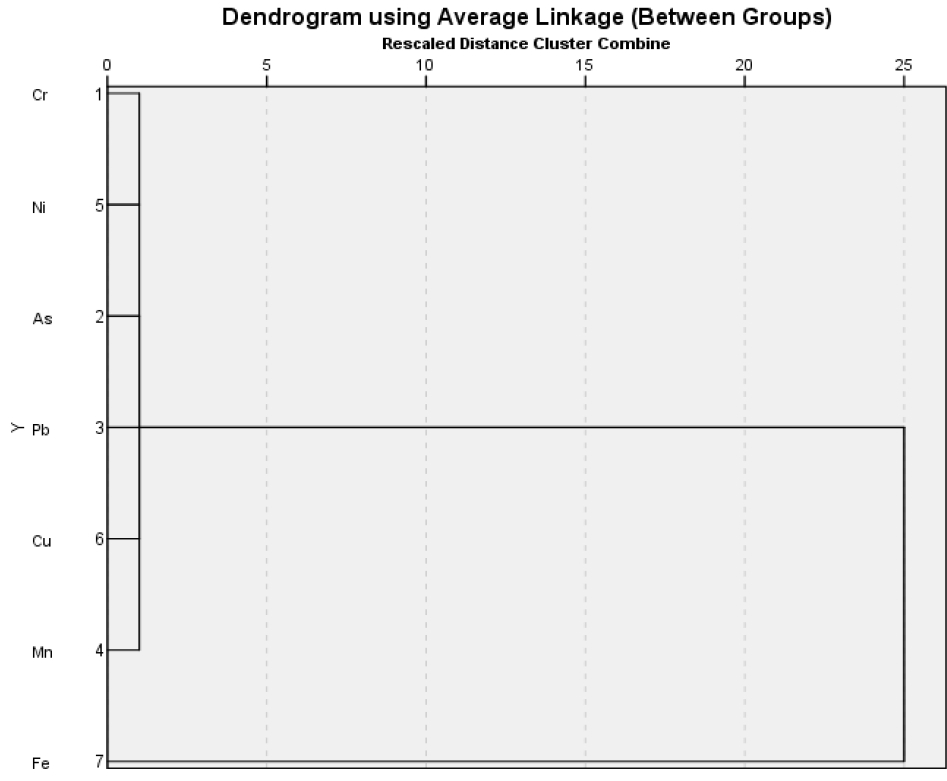
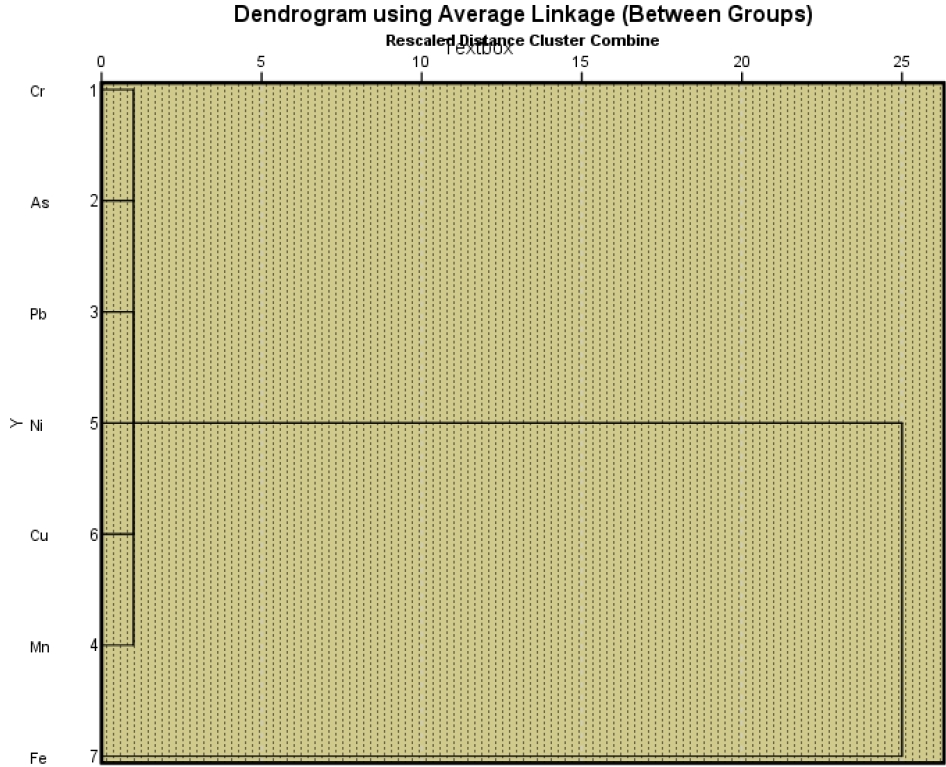
Hierarchical cluster analysis (HCA)

The distribution of metals in dust and soil samples from combined semi urban area (Nkpor and Onitsha) was analyzed using cluster analysis as shown in Figs 4 and 5. Cluster analysis (CA) is a method used to classify a group of metals with reference to variable space into classes. Cluster analysis classified the studied metals into clusters based on similarities within a group and dissimilarities between different groups. Seven studied metals were classified into two main clusters on the basis of spatial similarities and dissimilarities (Figs 4 and 5). HCA enabled the differentiation of the metals based on their composition in the analyzed samples. In summary, the CA results, similarly to factor analysis, can distinguish the levels of the metals according to their composition, which is important for the assessment of their contamination levels. Agreement of the results of PCA and HCA demonstrated that Pb, Cu and Mn had the same sources in dusts.

Pollution assessment

Descriptive statistical analysis results of pollution indices, CF, ER, and I-geo are presented in Table 3. The CF values suggested moderate As contamination in car dust at Ukpor/Onitsha and in rooftop dust at Achuputa/Nkpor. Considerable contamination of As was observed in car and rooftop dust from Kara/Onitsha and car dust from Achuputa and mechanic at Nkpor; whereas high As contamination was recorded in rooftop dust from Ukpor/Onitsha which depicts As mobility potential and higher risk to the local environment population [14]. The rest of the metals showed low contamination in sampled media from different locations.
Calculations of I-geo showed that the mean values of studied heavy metals in different locations were mainly uncontaminated (I-geo ≤ 0) except arsenic metal in car and rooftop dust from all the studied areas that ranged from low contamination (0 ≤ I-geo < 1) to moderate contamination (1 ≤ I-geo < 2) with tendency of upper than 1 and lower than zero. Based on the results from correlation analysis, it was expected that As was impacted by anthropogenic origins.
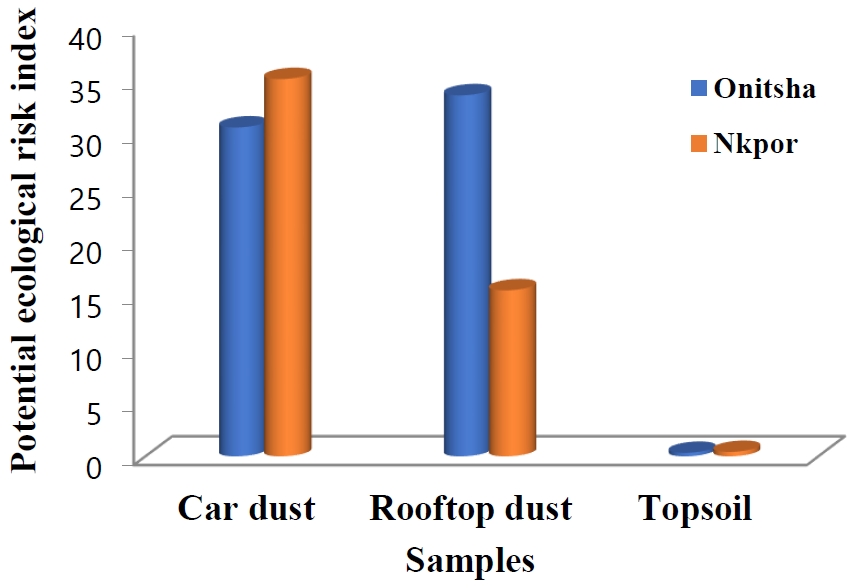
The results of ecological risk assessment obtained from elemental concentrations in the car dust, rooftop dust and topsoil samples in Onitsha and Nkpor semi urban area are summarized in Table 3. All elements introduced low risks due to the indicated levels were < 40 for the ER index. Specifically, As has the highest ecological risk among other heavy metals with total PERI values of 30.72 and 35.22 in car dust for Onitsha and Nkpor; 33.71 and 15.58 in rooftop dust for Onitsha and Nkpor; and insignificant PERI values in topsoil for both cities (Fig 6). The high As levels in the study area may be the result of its previous use as farmland, with the application of sewage irrigation; phosphate fertilizers; and As-containing pesticides and herbicides, such as calcium arsenate and sodium arsenite. Arsenic is more soluble under high or low pH values. In reducing environment, as arsenate is reduced to arsenite, it binds less strongly to the hydroxide solids, which increase the bioavailability of arsenic. Again, arsenic may also be bound to the organic matter in soils, in which case it is released into soil solution as the organic matter is oxidized. Thus, high level of arsenic pollution in the studied area can be related to the industrial and agricultural activities. After serial combination of ecological risk values of all the metals in each location, the potential ecological risk index was low for the sampled areas in both cities.
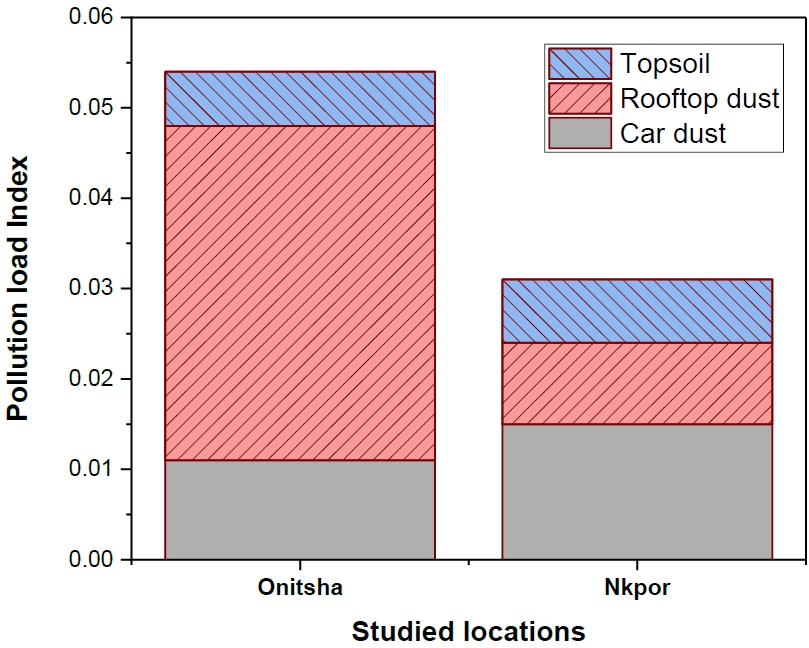
The pollution load index -calculated results of metals in dusts and soil samples collected from different spots in Nkpor and Onitsha are presented in Fig. 7. The PLI of overall heavy metals in car dust, rooftop dust and topsoil from individual locations in both cities are less than one (PLI < 1) which depicts perfection i.e no pollution effect was observed.
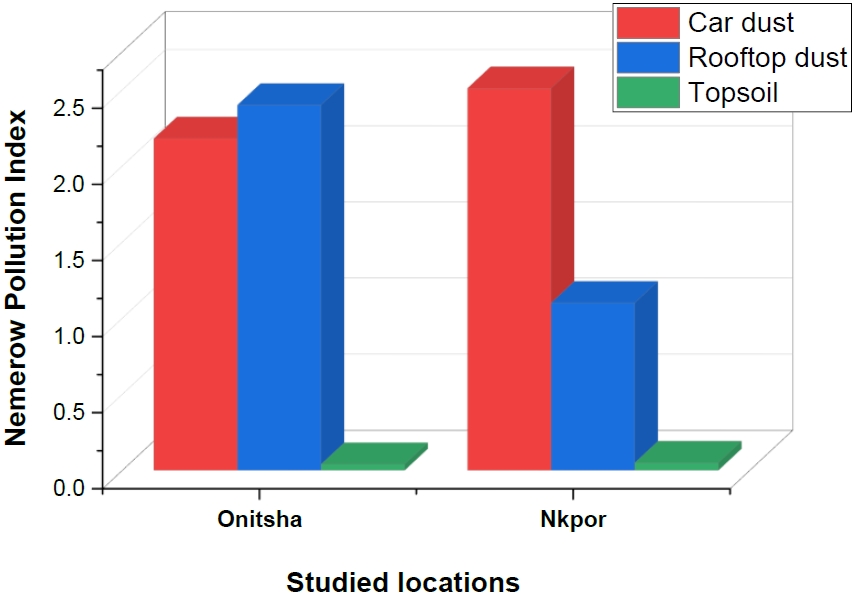
The results of Nemerow pollution index (Fig 8) showed that the assessment level of terrestrial ecosystem ranged from unpolluted (PN < 1) to moderately polluted (1 < PN ≤ 3). Topsoil from the studied locations is unpolluted with these traced elements whereas car dust and rooftop dust are slightly and moderately polluted because of lower retention time of the metals leading to potential mobility in dust medium. Nemerow index is an incorporated approach for evaluation of pollutants in study locations as it takes inputs from other pollution indicators. Nevertheless, the assessed soil and dust environments are safe for societal purposes at the moment but should be monitored within long-term exposure [10].

Health risk assessment

Air pollution resulting from dust particles, vehicular emission, soot, inorganic particles can exacerbates and promotes progression of atherosclerosis and elevate cardiovascular events, including regularity of non-communicable respiratory diseases (NCRDs) with asthma, chronic bronchitis, pulmonary and bronchiole effects, obstructive respiratory disease, and allergic rhinitis [53, 54] To ascertain the accurate risk assessment of human exposure to heavy metals through street dust and topsoil; oral, inhalation and dermal route of each heavy metal were taken into consideration for both cancer and non-cancer risk. The evaluation of health hazard effects of the studied heavy metals in both dust and soil for both aged groups are displayed. Health risk assessment was evaluated to deduce the risk impact of trace heavy metal (Cr, As, Ni, Pb, Mn, Cu and Fe) contents in dust and soil re-suspended from a populated busy street using data from Table 1 depicted in Tables 4-7, which provides enrichment of metals into the bulk soil and dust samples from urban street and the loose fraction of these soil-dust with its metal content may be in air, occasioned by favorable weather (air/wind) [55], may be inhaled, ingested or adhere to the skin. The number of particles deposited in body organs is a function of the particle’s air aerodynamics, resulting in respiratory system cellular tissue damage [56]. The exposed risk consideration on children (1-17 years) and adults (18-70 years) was explained via non-carcinogenic and carcinogenic health risk of the heavy metals to ascertain possible toxicity to humans. Non-cancer and cancer risk values through ingestion, inhalation and dermal routes associated with different exposure media at different locations are deduced from average daily dose (ADD) (Table 4).

Non-carcinogenic risk

The absorption fractions of the heavy metals in the dust and soil samples were used to estimate the average daily dose for the risk assessment exposure of the metals (Table 4). Considering Onitsha/Ukpor street, Average daily dose (ADD) in adult ingestion exposure via car dust range from 3.96 × 10-09 – 1.85 × 10-05; rooftop dust (1.97 × 10-09 – 3.57 × 10-06), topsoil (2.11 × 10⁻¹⁰ – 3.87 × 10-06), for children, contact through car dust is the range of 2.96 × 10-08 – 1.85 × 10-06, rooftop dust (1.84 × 10-08 – 3.33 × 10-05) and topsoil (1.97 × 10-09 – 3.62 × 10-05 89 ) as via inhalation and dermal contact. Similar range results were depicted in Onitsha/Kara, Nkpor/Achuputa and Nkpor/Mechanic streets via the three exposure routes as applicable with insignificant variation. From non-carcinogenic risk results, ingestion of soil and dust particles appear to be the major pathway for exposure risk to heavy metals to both populations in urban street dust and topsoil among the residents of Ukpor and Kara at Onitsha and Achuputa and Mechanic areas at Nkpor. Inhalation adsorption is next in hierarchy of exposure risk pathway, and the dermal absorption of suspended particles tend to be least risk pathway. The order of exposure route (ingestion > inhalation > dermal) is consistent with Ma et al. [57] for non-cancerous health assessment in children.
The probability distribution of calculated hazard quotient (HQ), total hazard quotient (THQ) and hazard index (HI) were as depicted in Tables 5 and 6. Hazard quotient (HQ) (Table 5) shows that for adult exposure via ingestion of car dust particulates ranged from 1.11 × 10-07 – 1.93 × 10-04; rooftop dust (4.25 × 10-07 – 2.32 × 10-04), topsoil (7.03 × 10-08 – 1.35 × 10-05). Children: car dust (1.40 × 10-06 – 1.80 × 10-03), rooftop dust (3.97 × 10-06 - 2.21 × 10-03) and topsoil (6.57 × 10-07 – 1.25 × 10-04) observed at Onitsha/Ukpor street via ingestion, no significant variation was found for inhalation and dermal contact (as applicable) and at Onitsha/Kara, Nkpor/Achuputa and Nkpor/Mechanic streets. Total hazard quotient (THQ) of adult in all the studied area via ingestion of car dust ranged as 7.03 × 10-07 – 4.31 × 10-04, rooftop dust (6.59 × 10-07 – 4.79 × 10-05), topsoil (7.03 × 10-08 – 1.35 × 10-05). Children show minor variation of ingestion via car dust (6.70 × 10-06 – 4.02 × 10-03), rooftop dust (6.15 × 10-06 – 4.43 × 10-03) topsoil (6.57 × 10-07 – 1.25 × 10-04 109 ), same for inhalation and dermal contact (as applicable) for other areas of study. Hazard index (HI) for Onitsha area, adult via car dust (1.81 × 10-06 – 4.31 × 10-04), rooftop dust (8.76 × 10-07 – 4.72 × 10-04), topsoil (7.39 × 10-08 – 3.28 × 10-05), children via car dust (1.62 × 10-05 – 4.02 × 10-03), rooftop dust (6.21 × 10-06 – 4.43 × 10-03) and topsoil (7.39 × 10 -08 – 3.28 × 10-05). Similarly, hazard index (HI) for Nkpor area, adult via car dust (1.23 × 10-07 – 4.93 × 10-04), rooftop dust (9.14 × 10-07 – 4.67 × 10-04), topsoil (8.84 × 10-08 – 6.75 × 10-05), children via car dust (1.11 × 10-06 – 4.60 × 10-03), rooftop dust (4.67 × 10-06 – 8.25 × 10-05) and topsoil (3.32 × 10-06 – 1.99 × 10-04 ). The HQ and HI values of the heavy metals (Tables 5 and 6) implied that ingestion and inhalation pathways are the major risk exposure to the local populations via soil and dust. Evaluation of car dust, rooftop dust and topsoil, the heavy metals were found safe to human exposure through different exposure route and none of the metals was associated with non-cancer risk, also, the mean HI values were below the USEPA’s guideline value of 1 (HI < 1) for all the age groups indicating no potential non-carcinogenic risks. Meanwhile, the non-cancer risk from all the pathways in both dust and topsoil are higher in children than in adult. Children might suffer from a prolong accumulative non-carcinogenic risk when compared with adults owing to inadvertently display of hand-to-mouth behavior [6, 8, 57], therefore children’s hygiene while playing in an urban street is important.

Carcinogenic risk

The sensitivity of the heavy metals exposure in dust and soil to children was confirmed and reflected by higher cancer risk (CR) and total cancer risk (TCR) as seen in Table 7. The calculated values for As in car dust (1.10 × 10⁻⁶) and rooftop dust (1.98 × 10⁻⁶) in children and Ni in rooftop dust (1.44 ×10⁻⁶) in children via ingestion pathway at studied area of Onitsha were at the edge of acceptable carcinogenic risk: USEPA; 1 × 10⁻⁴ - 1 × 10⁻⁶ estimate, whereas at Nkpor, the calculated values for As (2.07 × 10⁻⁶) and Ni (2.39 × 10⁻⁵) in car dust for children via ingestion are also within the acceptable limit but Ni could shift on either side. Total cancer risk (TCR) of all the studied sites (Table 7) for selected carcinogenic heavy metals (As, Cr, Ni, Pb) for Onitsha, TCR for adult from car dust ranged from 8.72 × 10⁻¹⁰ – 1.94 × 10-07, rooftop dust (1.25 × 10-09 – 2.11 × 10-07) and topsoil (1.10 × 10⁻¹⁰ – 7.39 × 10-08), considering children via car dust (8.12 × 10-09 – 1.10 × 10-06), rooftop dust (9.29 × 10-09 – 1.44 × 10-06), topsoil (9.95 × 10⁻¹⁰ – 6.88 × 10-07). For Nkpor vicinity, the TCR for adult from car dust ranged from 1.77 × 10⁻¹⁰ – 2.52 × 10-07, rooftop dust (1.28 × 10-09 – 9.73 × 10-08) and topsoil (6.38 × 10⁻¹⁰ – 6.30 × 10-08), considering children via car dust (1.65 × 10-09 – 2.39 × 10-05), rooftop dust (8.66 × 10-09 – 9.07 × 10-07), topsoil (5.32 × 10⁻¹⁰ – 5.88 × 10-08). Total cancer risk (TCR) estimations also depicted similar results for As and Ni at both location for children through ingestion due to wide margin of values of the metals in both inhalation and dermal contacts. Results above indicate that children are more susceptible to cancer risk of As and Ni than adults in dust and could be as a result of incessant ingestion of substantial quantity of non-food objects from soil and dust during several game activities, soil eating habit (geophagy), weak immune system and relatively developing body system [16] [58, 59] resulting in their inability to detoxify and excrete contaminants [57]. As and Ni can influence the skin, liver, kidney, respiratory tract, cardiovascular tract, gastrointestinal tract, hematopoietic and sensory systems [60, 61]. Therefore, strict attention should be focused on heavy metals exposure especially to children living in urban street especially As and Ni towards prevention and control of health risk. The carcinogenic risk assessment results generated from the study emphasized that the risk of human exposure to these heavy metals should not be ignored and neglected as long-term public health impact will be intense if remedial action were not considered.

Conclusions

In this present study, geochemical indices, statistical analysis, and health risk assessment were exploited to estimate the level of heavy metals in street dust and topsoil from Nkpor and Onitsha cities, Nigeria. The results of the mean concentrations showed that the selected spots from the cities have lower heavy metal contents in both dust and topsoil than the background values except arsenic in car and rooftop dusts. The Pearson correlation analysis also indicated that Mn-Pb, Cu-Mn, Cu-Pb, Fe-Cu and Fe-Mn were positively correlated with each other at the 0.01 level while significant negative correlations exist between Pb-As, Mn-As, and Cu-As. In addition, two main source identifications for heavy metals in soil and dust were ascertained with PCA and HCA analysis. Assessment of pollution indices indicates that most dust and soil samples were unpolluted by metals. Factor and cluster analysis depicted atmospheric deposition, natural and anthropogenic (traffic emissions, engine wears, automobile breaking and leaded gasoline) enrichment of the metals. Hazard index values for children and adults were more projecting for children than that for adults. No carcinogenic health risk was found for both aged groups except for Ni and As with carcinogenic values occurring within the range of 1.0E-04 to 1.0E-06 for possible cancer effects.
Nevertheless, there is need for continuous heavy metal monitoring in urban street dust and soil from the studied locations to assess the cancer and non-cancer effects due to intake of these toxic metals that can deteriorate the internal body organs.

Notes

CRediT author statement
TCU, PCO: Conceptualization, Methodology, Software; FCO: Data curation, Writing- Original draft preparation. HIK, OGC: Visualization, Investigation; JKN: Supervision, Writing- Reviewing and Editing.

References

1. Abbasi S, Keshavarzi B, Moore F. Fractionation, source identification and risk assessment of potentially toxic elements in street dust of the most important center for petrochemical products, Asaluyeh County, Iran. Environmental Earth Sciences 2018;77(19):673 https://doi.org/10.1007/s12665-018-7854-z.
crossref
2. Fan X, Lu X, Yu B, Zuo L, Fan P, Yang Y, et al. Risk and sources of heavy metals and metalloids in dust from university campuses: A case study of Xi'an, China. Environ Res 2021;202: 111703 https://doi.org/10.1016/j.envres.2021.111703.
crossref pmid
3. Yu B, Lu X, Fan X, Fan P, Zuo L, Yang Y, et al. Analyzing environmental risk, source and spatial distribution of potentially toxic elements in dust of residential area in Xi’an urban area, China. Ecotoxicology and Environmental Safety 2021;208: 111679 https://doi.org/10.1016/j.ecoenv.2020.111679.
crossref pmid
4. Al-Khashman OA. Assessment of heavy metals contamination in deposited street dusts in different urbanized areas in the city of Ma’an, Jordan. Environmental Earth Sciences 2013;70(6):2603-2612 https://doi.org/10.1007/s12665-013-2310-6.
crossref
5. Han Q, Wang M, Cao J, Gui C, Liu Y, He X, et al. Health risk assessment and bioaccessibilities of heavy metals for children in soil and dust from urban parks and schools of Jiaozuo, China. Ecotoxicol Environ Saf 2020;191: 110157 https://doi.org/10.1016/j.ecoenv.2019.110157.
crossref pmid
6. Huang J, Wu Y, Sun J, Li X, Geng X, Zhao M, et al. Health risk assessment of heavy metal(loid)s in park soils of the largest megacity in China by using Monte Carlo simulation coupled with Positive matrix factorization model. J Hazard Mater 2021;415: 125629 https://doi.org/10.1016/j.jhazmat.2021.125629.
crossref pmid
7. Wang M, Han Q, Gui C, Cao J, Liu Y, He X, et al. Differences in the risk assessment of soil heavy metals between newly built and original parks in Jiaozuo, Henan Province, China. Sci Total Environ 2019;676: 1-10 https://doi.org/10.1016/j.scitotenv.2019.03.396.
crossref pmid
8. Yang S, Zhao J, Chang SX, Collins C, Xu J, Liu X. Status assessment and probabilistic health risk modeling of metals accumulation in agriculture soils across China: A synthesis. Environ Int 2019;128: 165-174 https://doi.org/10.1016/j.envint.2019.04.044.
crossref pmid
9. Lin Y, Ma J, Zhang Z, Zhu Y, Hou H, Zhao L, et al. Linkage between human population and trace elements in soils of the Pearl River Delta: Implications for source identification and risk assessment. Sci Total Environ 2018;610-611: 944-950 https://doi.org/10.1016/j.scitotenv.2017.08.147.
crossref pmid
10. Mmaduakor EC, Umeh CT, Morah JE, Omokpariola DO, Ekwuofu AA, Onwuegbuokwu SS. Pollution status, health risk assessment of potentially toxic elements in soil and their uptake by gongronema latifolium in peri-urban of Ora-Eri, south-eastern Nigeria. Heliyon 2022;8(8):e10362. https://doi.org/10.1016/j.heliyon.2022.e10362.
crossref pmid pmc
11. Wallace DR, Taalab YM, Heinze S, Lovaković BT, Pizent A, Renieri E, et al. Toxic-metal-induced alteration in miRNA expression profile as a proposed mechanism for disease development. Cells 2020;9(4):901 https://doi.org/10.3390/cells9040901.
crossref pmid pmc
12. Yao B, Lu X, Xu L, Wang Y, Qu H, Zhou H. Relationship between low-level lead, cadmium and mercury exposures and blood pressure in children and adolescents aged 8-17 years: An exposure-response analysis of NHANES 2007-2016. Sci Total Environ 2020;726: 138446 https://doi.org/10.1016/j.scitotenv.2020.138446.
crossref pmid
13. Lee PK, Kang MJ, Yu S, Kwon YK. Assessment of trace metal pollution in roof dusts and soils near a large Zn smelter. Sci Total Environ 2020;713: 136536 https://doi.org/10.1016/j.scitotenv.2020.136536.
crossref pmid
14. Li H, Qian X, Hu W, Wang Y, Gao H. Chemical speciation and human health risk of trace metals in urban street dusts from a metropolitan city, Nanjing, SE China. Sci Total Environ 2013;456-457: 212-221 https://doi.org/10.1016/j.scitotenv.2013.03.094.
crossref pmid
15. Lian Z, Zhao X, Gu X, Li X, Luan M, Yu M. Presence, sources, and risk assessment of heavy metals in the upland soils of northern China using Monte Carlo simulation. Ecotoxicology and Environmental Safety 2022;230: 113154 https://doi.org/10.1016/j.ecoenv.2021.113154.
crossref pmid
16. Siddiqui Z, Khillare PS, Jyethi DS, Aithani D, Yadav AK. Pollution characteristics and human health risk from trace metals in roadside soil and road dust around major urban parks in Delhi city. Air Quality, Atmosphere & Health 2020;13(11):1271-1286 https://doi.org/10.1007/s11869-020-00874-y.
crossref
17. Guo G, Zhang D, Wang Y. Source apportionment and source-specific health risk assessment of heavy metals in size225 fractionated road dust from a typical mining and smelting area, Gejiu, China. Environ Sci Pollut Res Int 2021;28(8):9313-9326 https://doi.org/10.1007/s11356-020-11312-y.
crossref pmid
18. Hilal K Al-Shidi HK, Sulaiman H, Al-Reasi HA, Jamil F, Aslam M. Human and ecological risk assessment of heavy metals in different particle sizes of road dust in Muscat, Oman. Environ Sci Pollut Res Int 2021;28(26):33980-33993 https://doi.org/10.1007/s11356-020-09319-6.
crossref pmid
19. Priya GS, Deep R, Subodh KM. Risks assessment of heavy metal pollution in roadside soil and vegetation of national highway crossing through industrial area. Environmental Processes 2020;7: 1197-1220 https://doi.org/10.1007/s40710-020-00463-2.
crossref
20. Men C, Liu R, Xu L, Wang Q, Guo L, Miao Y, et al. Source-specific ecological risk analysis and critical source identification of heavy metals in road dust in Beijing, China. J Hazard Mater 2020;388: 121763 https://doi.org/10.1016/j.jhazmat.2019.121763.
crossref pmid
21. Zheng N, Hou S, Wang S, Sun S, An Q, Li P, et al. Health risk assessment of heavy metals in street dust around a zinc smelting plant in China based on bioavailability and bioaccessibility. Ecotoxicol Environ Saf 2020;197: 110617 https://doi.org/10.1016/j.ecoenv.2020.110617.
crossref pmid
22. Jin Y, O’Connor D, Ok YS, Tsang DCW, Liu A, Hou DY. Assessment of sources of heavy metals in soil and dust at children's playgrounds in Beijing using GIS and multivariate statistical analysis. Environ Int 2019;124: 320-328 https://doi.org/10.1016/j.envint.2019.01.024.
crossref pmid
23. Capolongo S, Rebecchi A, Dettori M, Appolloni L, Azara A, Buffoli M, et al. Healthy design and urban planning strategies, actions, and policy to achieve Salutogenic Cities. International Journal of Environmental Research and Public Health (IJERPH) 2018;15(12):2698 https://doi.org/10.3390/ijerph15122698.
crossref pmid pmc
24. Liu L, Liu Q, Ma J, Wu H, Qu Y, Gong Y, et al. Heavy metal(loid)s in the topsoil of urban parks in Beijing, China: Concentrations, potential sources, and risk assessment. Environ Pollut 2020;260: 114083 https://doi.org/10.1016/j.envpol.2020.114083.
crossref pmid
25. Zhang Zhaoyong Z, Mamat A, Simayi Z. Pollution assessment and health risks evaluation of (metalloid) heavy metals in urban street dust of 58 cities in China. Environ Sci Pollut Res Int 2019;26(1):126-140 https://doi.org/10.1007/s11356-018-3555-0.
crossref pmid
26. Malakootian M, Mohammadi A, Nasiri A, Asadi AMS, Conti GO, Faraji M. Spatial distribution and correlations among elements in smaller than 75 μm street dust: ecological and probabilistic health risk assessment. Environ Geochem Health 2021;43(1):567-583 https://doi.org/10.1007/s10653-020-00694-0.
crossref pmid
27. Li HH, Chen LJ, Yu L, Guo ZB, Shan CQ, Lin JQ, et al. Pollution characteristics and risk assessment of human exposure to oral bioaccessibility of heavy metals via urban street dusts from different functional areas in Chengdu, China. Sci Total Environ 2017;586: 1076-1084 https://doi.org/10.1016/j.scitotenv.2017.02.092.
crossref pmid
28. Naraki H, Keshavarzi B, Zarei M, Moore F, Abbasi S, Kelly FJ, et al. Urban street dust in the Middle East oldest oil refinery zone: Oxidative potential, source apportionment، and health risk assessment of potentially toxic elements. Chemosphere 2021;268: 128825 https://doi.org/10.1016/j.chemosphere.2020.128825.
crossref pmid
29. Royal Geographical Society (Great Britain). A Gazetteer of the world: or, Dictionary of geographical knowledge, compiled from the most recent authorities, and forming a complete body of modern geography -- physical, political, statistical, historical, and ethnographical. [cited April 4, 2023]. Available from: https://archive.org/details/agazetteerworld00unkngoog.

30. Masto RE, George J, Rout TK, Ram LC. Multi element exposure risk from soil and dust in a coal industrial area. Journal of Geochemical Exploration 2017;176: 100-107 https://doi.org/10.1016/j.gexplo.2015.12.009.
crossref
31. Gope M, Masto RE, George J, Balachandran S. Tracing source, distribution and health risk of potentially harmful elements (PHEs) in street dust of Durgapur, India. Ecotoxicol Environ Saf 2018;154: 280-293 https://doi.org/10.1016/j.ecoenv.2018.02.042.
crossref pmid
32. Alloway B. Heavy metals in soil. Trace metals and metalloids in soil and their bioavailability. 3rd Edition. Springer; 2010, 614.

33. Rahman MS, Kumar P, Ullah M, Jolly YN, Akhter S, Kabir J, et al. Elemental analysis in surface soil and dust of roadside academic institutions in Dhaka city, Bangladesh and their impact on human health. Environmental Chemistry and Ecotoxicology 2021;3: 197-208 https://doi.org/10.1016/j.enceco.2021.06.001.
crossref
34. Benabid A, Benmbarek N, Mansouri T, Merdas A. Influence of highway traffic on contamination of roadside soil with heavy metals. Civil Engineering Journal 2021;7(8):1459-1471 https://doi.org/10.28991/cej-2021-03091736.
crossref
35. Umeh CT, Nduka JK, Omokpariola DO, Morah JE, Mmaduakor EC, Okoye NH, et al. Ecological pollution and health risk monitoring assessment of polycyclic aromatic hydrocarbons and heavy metals in surface water, southeastern Nigeria. Environ Anal Health Toxicol 2023;38(2):e2023007. https://doi.org/10.5620/eaht.2023007.
crossref pmid pmc
36. Gope M, Masto RE, George J, Hoque RR, Balachandran S. Bioavailability and health risk of some potentially toxic elements (Cd, Cu, Pb and Zn) in street dust of Asansol, India. Ecotoxicol Environ Saf 2017;138: 231-241 https://doi.org/10.1016/j.ecoenv.2017.01.008.
crossref pmid
37. Men C, Liu R, Xu F, Wang Q, Guo L, Shen Z. Pollution characteristics, risk assessment, and source apportionment of heavy metals in road dust in Beijing, China. Sci Total Environ 2018;612: 138-147 https://doi.org/10.1016/j.scitotenv.2017.08.123.
crossref pmid
38. Adikaram M, Pitawala A, Ishiga H, Jayawardana D, Eichler CM. An ecological risk assessment of sediments in a developing environment-Batticaloa Lagoon, Sri Lanka. Journal of Marine Science and Engineering 2021;9(1):73 https://doi.org/10.3390/jmse9010073.
crossref
39. Kang X, Song J, Yuan H, Duan L, Li X, Li N, et al. Speciation of heavy metals in different grain sizes of Jiaozhou Bay sediments: Bioavailability, ecological risk assessment and source analysis on a centennial timescale. Ecotoxicol Environ Saf 2017;143: 296-306 https://doi.org/10.1016/j.ecoenv.2017.05.036.
crossref pmid
40. Emenike PC, Tenebe I, Ogarekpe N, Omole D, Nnaji C. Probabilistic risk assessment and spatial distribution of potentially toxic elements in groundwater sources in Southwestern Nigeria. Sci Rep 2019;9(1):15920 https://doi.org/10.1038/s41598-019-52325-z.
crossref pmid pmc
41. Ganiyu SA, Oyadeyi AT, Adeyemi AA. Assessment of heavy metals contamination and associated risks in shallow groundwater sources from three different residential areas within Ibadan metropolis, southwest Nigeria. Applied Water Science 2021;11: 81 https://doi.org/10.1007/s13201-021-01414-4.
crossref
42. Hakanson L. An ecological risk index for aquatic pollution control.a sedimentological approach. Water Research 1980;14(8):975-1001 https://doi.org/10.1016/0043-1354(80)90143-8.
crossref
43. Wu H, Yang F, Li H, Li Q, Zhang F, Ba Y, et al. Heavy metal pollution and health risk assessment of agricultural soil near a smelter in an industrial city in China. Int J Environ Health Res 2020;30(2):174-186 https://doi.org/10.1080/09603123.2019.1584666.
crossref pmid
45. United States, Environmental Protection Agency (US EPA). Risk assessment guidance for superfund, Volume I: Human health evaluation manual. [cited April 4, 2023]. Available from: https://semspub.epa.gov/work/HQ/140530.pdf.

46. United States, Environmental Protection Agency (US EPA). Reference dose (RfD): Description and use in health risk assessments. [cited April 4, 2023]. Available from: https://www.epa.gov/iris/reference-dose-rfd-description-and-use315 health-risk-assessments.

47. Al-Khashman OA. Determination of metal accumulation in deposited street dusts in Amman, Jordan. Environ Geochem Health 2007;29(1):1-10 https://doi.org/10.1007/s10653-006-9067-8.
crossref pmid
48. Hunt A, Johnson DL, Brooks J, Griffith DA. Risk remaining from fine particle contaminants after vacuum cleaning of hard floor surfaces. Environ Geochem Health 2008;30(6):597-611 https://doi.org/10.1007/s10653-008-9183-8.
crossref pmid
49. Li F, Zhang J, Liu W, Liu J, Huang J, Zeng G. An exploration of an integrated stochastic-fuzzy pollution assessment for heavy metals in urban topsoil based on metal enrichment and bioaccessibility. Sci Total Environ 2018;644: 649-660 https://doi.org/10.1016/j.scitotenv.2018.06.366.
crossref pmid
50. Li F, Huang J, Zeng G, Liu W, Huang X, Huang B, et al. Toxic metals in topsoil under different land uses from Xiandao District, middle China: distribution, relationship with soil characteristics, and health risk assessment. Environ Sci Pollut Res Int 2015;22(16):12261-12275 https://doi.org/10.1007/s11356-015-4425-7.
crossref pmid
51. Dao L, Morrison L, Zhang H, Zhang C. Influences of traffic on Pb, Cu and Zn concentrations in roadside soils of an urban park in Dublin, Ireland. Environ Geochem Health 2014;36(3):333-343 https://doi.org/10.1007/s10653-013-9553-8.
crossref pmid
52. Du X, Zhu Y, Han Q, Yu Z. The influence of traffic density on heavy metals distribution in urban road runoff in Beijing, China. Environ Sci Pollut Res Int 2019;26(1):886-895 https://doi.org/10.1007/s11356-018-3685-4.
crossref pmid
53. Glenn BE, Espira LM, Larson MC, Larson PS. Ambient air pollution and non-communicable respiratory illness in sub331 Saharan Africa: a systematic review of the literature. Environ Health 2022;21(1):40 https://doi.org/10.1186/s12940-022-00852-0.
crossref pmid pmc
54. Azzouz M, Xu Y, Barregard L, Fagerberg B, Zöller B, Molnár P, et al. Air pollution and biomarkers of cardiovascular disease and inflammation in the Malmö Diet and Cancer cohort. Environ Health 2022;21(1):39 https://doi.org/10.1186/s12940-022-00851-1.
crossref pmid pmc
55. Nduka JKC, Orisakwe OE, Ezenweke LO, Abiakam CA, Nwanguma CK, Maduabuchi UJM. Metal contamination and infiltration into the soil at refuse dump sites in Awka, Nigeria. Arch Environ Occup Health 2006;61(5):197-204 https://doi.org/10.3200/AEOH.61.5.197-204.
crossref pmid
56. Nduka JK, Kelle HI, Amuka JO. Health risk assessment of cadmium, chromium and nickel from car paint dust from used automobiles at auto-panel workshops in Nigeria. Toxicology Reports 2019;6: 449-456 https://doi.org/10.1016/j.toxrep.2019.05.007.
crossref pmid pmc
57. Ma Q, Han L, Zhang J, Zhang Y, Lang Q, Li F, et al. Environmental risk assessment of metals in the Volcanic soil of Changbai Mountain. Int J Environ Res Public Health 2019;16(11):2047 https://doi.org/10.3390/ijerph16112047.
crossref pmid pmc
58. Mohmand J, Eqani SAMAS, Fasola M, Alamdar A, Mustafa I, Ali N, et al. Human exposure to toxic metals via contaminated dust: Bio-accumulation trends and their potential risk estimation. Chemosphere 2015;132: 142-151 https://doi.org/10.1016/j.chemosphere.2015.03.004.
crossref pmid
59. Nduka JK, Kelle HI, Akpunonu EO, Amuka JO, Iloka GC. Mobility pattern, risk assessment of heavy metals in soil-dust and hazards of consuming vegetables at auto-body workshops. International Journal of Environmental Science & Technology 2023;20(5):4943-4958 https://doi.org/10.1007/s13762-022-04288.
crossref
60. Rasmussen PE, Levesque C, Chénier M, Gardner HD. Contribution of metals in resuspended dust to indoor and personal inhalation exposures: Relationships between PM10 and settled dust. Building and Environment 2018;143: 513-522 https://doi.org/10.1016/j.buildenv.2018.07.044.
crossref
61. Nduka JK, Umeh TC, Kelle HI, Mgbemena MN, Nnamani RA, Okafor PC. Ecological and health risk assessment of heavy metals in roadside soil, dust and water of three economic zone in Enugu, Nigeria. Urban Climate 2023;51: 101627 https://doi.org/10.1016/j.uclim.2023.101627.
crossref

Figure 1.
Study map showing the sampled locations.
eaht-39-1-e2024005f1.jpg
Figure 2.
Principal component analysis of heavy metals in dust
eaht-39-1-e2024005f2.jpg
Figure 3.
Principal component analysis of heavy metals in topsoil
eaht-39-1-e2024005f3.jpg
Figure 4.
Hierarchical cluster analysis of heavy metal concentrations in dust
eaht-39-1-e2024005f4.jpg
Figure 5.
Hierarchical cluster analysis of heavy metal concentrations in topsoil
eaht-39-1-e2024005f5.jpg
Figure 6.
Potential ecological risk index of overall metals in sampled media
eaht-39-1-e2024005f6.jpg
Figure 7.
Pollution load index of total analyzed metals in dust and topsoil
eaht-39-1-e2024005f7.jpg
Figure 8.
Nemerow pollution index of overall metals in dust and soil from different sampled location
eaht-39-1-e2024005f8.jpg
Table 1.
Heavy metal concentrations (mg/kg) in street dust and topsoil.
City Locations Heavy metals Car dust
Rooftop dust
Topsoil
Background value1, 2
Min Max Mean ± SD Min Max Mean ± SD Min Max Mean ± SD
Onitsha Ukpor Cr 0.003 0.005 0.015 ± 0.005 0.000 0.018 0.009±0.001 0.000 0.005 0.001±0.001 42
As 0.214 0.368 0.273 ± 0.001 0.160 0.475 0.329±0.017 0.000 0.000 0.000±0.000 0.1
Pb 0.000 0.000 0.000 ± 0.000 0.080 0.699 0.355±0.032 0.084 0.317 0.223±0.035 25
Mn 0.000 0.178 0.004 ± 0.009 1.600 2.040 1.806±0.046 2.148 3.938 2.795±0.079 418
Ni 0.000 0.050 0.019 ± 0.003 0.002 0.130 0.055±0.008 0.079 0.460 0.253±0.440 18
Cu 0.000 0.055 0.021 ± 0.007 0.417 0.925 0.620±0.017 0.543 0.761 0.652±0.026 14
c Fe 8.484 10.000 9.214 ± 0.182 12.787 23.163 16.908±0.353 14.261 23.146 18.335 ± 0.205 19,100
Kara Cr 0.000 0.050 0.002 ± 0.002 0.000 0.000 0.000±0.000 42
As 0.266 0.391 0.337 ± 0.071 0.208 0.373 0.339±0.015 0.1
Pb 0.104 0.741 0.378 ± 0.050 0.160 0.793 0.437±0.036 25
Mn 1.372 2.550 1.926 ± 0.059 1.824 3.244 2.469±0.070 418
Ni 0.114 0.305 0.187 ± 0.039 0.112 0.675 0.374±0.080 18
Cu 0.400 1.374 0.877 ± 0.024 0.480 1.175 0.873±0.091 14
Fe 14.628 21.966 18.391 ± 1.117 15.857 20.242 18.697 ± 0.239 19,100
Nkpor Achalputa Cr 0.000 0.000 0.000 ± 0.000 0.000 0.018 0.008±0.006 0.010 0.020 0.005±0.002 42
As 0.300 0.464 0.396 ± 0.023 0.257 0.344 0.287±0.016 0.000 0.000 0.000±0.000 0.1
Pb 0.200 0.369 0.295±0.038 0.360 0.874 0.595±0.035 0.144 0.673 0.353±0.037 25
Mn 0.900 2.040 1.853±0.049 2.286 3.844 2.938±0.085 2.930 3.450 3.174±0.073 418
Ni 0.000 0.050 0.023±0.006 0.058 0.200 0.117±0.022 0.066 0.430 0.176±0.031 18
Cu 0.514 0.706 0.606±0.027 0.477 1.983 1.289±0.235 0.640 1.120 0.805±0.024 14
Fe 14.798 20.816 18.621 ± 0.231 15.064 18.436 17.179 ± 0.322 18.989 20.496 19.588 ± 0.110 19,100
Mechanic Cr 0.000 0.008 0.002±0.001 0.000 0.002 0.001±0.001 42
As 0.163 0.382 0.303±0.014 0.000 0.041 0.012±0.003 0.1
Pb 0.192 0.454 0.284±0.024 0.520 4.200 1.291±0.094 25
Mn 0.900 2.400 1.853±0.049 2.866 3.488 3.128 ±0.085 418
Ni 0.090 0.143 0.108±0.015 0.083 0.275 0.144 ± 0.030 18
Cu 0.343 0.871 0.578±0.025 0.786 1.184 1.067 ± 0.026 14
Fe 17.547 20.088 18.621±0.231 14.238 18.620 16.766 ± 0.219 19,100

1 Alloway, 2010;

2 Rahman et al., 2021

Table 2.
Pearson correlation matrix for studied metals in car and rooftop dust from selected streets in both cities
Heavy metals Cr As Pb Mn Ni Cu Fe
Cr -
As - 1
Pb - -0.929** 1
Mn - -0.758** 0.944** 1
Ni - -0.064 0.223 0.384* 1
Cu - -0.863** 0.986** 0.983** 0.342* 1
Fe - 0.073 0.292 0.566** 0.230 0.408** 1
Table 3.
Pollution indices of selected Heavy metals in street dust and topsoil
City Location H. M. Car dust
Rooftop dust
Topsoil
CF Igeo ER CF Igeo ER CF Igeo ER
Onitsha Ukpor Cr 3.57E-4 -12.40 7.15E-4 2.22E-4 -13.47 2.02E-4 2.38E-5 -4.79 4.77E-5
As 2.74 0.84 27.37 6.07 1.02 33.00 - - -
Pb - - - 0.01 -7.13 0.07 7.93E-3 -7.55 0.04
Mn 1.34E-4 -9.72 1.34E-4 4.32E-3 -8.44 4.32E-3 6.69E-3 -7.86 6.69E-3
Ni 1.04E-3 -11.66 3.98E-3 0.01 -9.68 0.01 8.34E-3 -7.34 0.05
Cu 1.50E-3 -10.88 8.69E-3 0.04 -5.16 0.22 0.05 -5.02 0.23
Fe 4.82E-4 -11.60 - 8.85E-4 -10.77 - 9.61E-4 -10.62 -
Onitsha Kara Cr 2.22E-4 -8.73 4.45E-4 - - - - - -
As 3.73 1.16 33.73 3.38 1.17 33.83 - - -
Pb 0.02 -6.65 0.11 0.02 -6.67 0.10 - - -
Mn 4.61E-3 -8.39 4.61E-3 5.90E-3 -8.02 5.90E-3 - - -
Ni 8.85E-3 -7.24 0.04 9.50E-3 -6.43 0.09 - - -
Cu 0.06 -4.74 0.32 0.06 -4.63 0.32 - - -
Fe 1.01E-3 -10.57 - 9.80E-4 -10.59 - - - -
Nkpor Achaputa Cr - - - 1.99E-4 -8.20 3.97E-4 - - -
As 3.96 1.39 39.63 2.88 0.93 28.80 - - -
Pb 9.72E-3 -7.01 0.05 0.02 -6.05 0.12 - - -
Mn 3.72E-3 -8.68 3.72E-3 7.03E-3 -7.77 7.03E-3 - - -
Ni 1.26E-3 -10.91 8.07E-3 6.89E-3 -7.98 0.03 - - -
Cu 0.04 -5.12 0.22 0.10 -4.16 0.50 - - -
Fe 9.34E-4 -10.66 - 8.99E-4 -10.71 - - - -
Nkpor Mechanic Cr 3.94E-5 -4.54 7.93E-5 7.93E-6 -5.31 1.59E-5 1.19E-4 -4.01 2.38E-4
As 3.04 0.93 30.37 0.12 -0.7 11.67 - - -
Pb 0.01 -7.31 0.06 0.05 -5.16 0.1 0.01 -6.98 0.06
Mn 4.43E-3 -8.53 4.43E-3 7.48E-3 -7.65 7.48E-3 7.59E-3 -7.63 5.52E-3
Ni 6.00E-3 -7.97 0.03 6.94E-3 -7.63 0.04 9.50E-3 -7.70 0.05
Cu 0.04 -5.26 0.22 0.08 -4.32 0.38 0.06 -4.75 0.30
Fe 9.77E-4 -10.59 - 8.78E-4 -10.75 - 1.03E-3 -10.52 -
Table 4.
ADD of all the metals via ingestion, inhalation and dermal contact on adult and children at different locations.
Locations Exposure route Heavy metals Adult
Children
Car dust Rooftop Dust Topsoil Car dust Rooftop Dust Topsoil
Onitsha/Ukpor street Ingestion Cr 1.83E-5 1.97E-9 2.11E-10 2.96E-8 1.84E-8 1.97E-9
As 5.78E-8 6.97E-8 - 5.46E-7 6.51E-7 -
Pb - 7.52E-8 4.71E-8 - 7.00E-7 4.39E-7
Mn 1.18E-8 3.76E-7 5.91E-7 3.80E-6 3.56E-6 5.52E-6
Ni 3.96E-9 1.67E-8 4.34E-8 3.68E-8 1.09E-7 4.05E-7
Cu 1.86E-7 1.31E-7 1.38E-7 4.14E-8 1.22E-6 1.29E-6
Fe 1.89E-6 3.57E-6 3.87E-6 1.82E-5 3.33E-5 3.62E-5
Onitsha/Kara street Ingestion Cr 1.83E-5 - - 1.84E-4 - -
As 7.13E-8 7.15E-8 - 6.65E-7 6.67E-7 -
Pb 1.02E-7 9.01E-8 - 9.48E-7 8.63E-7 -
Mn 4.07E-7 5.22E-7 - 3.80E-6 4.87E-6 -
Ni 3.95E-8 7.90E-8 - 3.69E-7 7.39E-7 -
Cu 1.85E-7 1.84E-7 - 1.73E-6 1.72E-6 -
Fe 4.09E-6 3.95E-6 - 3.82E-5 3.69E-5 -
Nkpor/Achalputa Ingestion Cr - 1.76E-9 - - 1.64E-8 -
As 8.38E-8 6.09E-8 - 7.82E-7 5.68E-7 -
Pb 6,24E-8 1.27E-7 - 5.83E-7 1.18E-6 -
Mn 3.29E-7 6.21E-7 - 3.07E-6 5.80E-6 -
Ni 4.79E-9 2.48E-8 - 4.47E-8 2.31E-7 -
Cu 1.28E-7 2.92E-7 - 1.20E-6 1.60E-6 -
Fe 3.77E-6 3.63E-6 - 3.51E-5 3.39E-5 -
Nkpor/Mechanic Ingestion Cr 3.53E-10 7.03E-21 1.06E-9 3.29E-9 6.57E-10 9.87E-9
As 6.42E-8 2.47E-9 - 5.99E-7 2.30E-8 -
Pb 6.00E-8 2.73E-7 7.46E-8 5.59E-7 3.80E-6 6.97E-7
Mn 3.92E-7 6.61E-7 6.71E-7 3.42E-6 6.17E-16 6.27E-6
Ni 2.28E-8 3.24E-8 3.71E-8 2.13E-7 3.02E-7 3.47E-7
Cu 1.22E-7 2.26E-7 1.70E-7 1.25E-6 2.10E-6 1.59E-6
Fe 3.94E-6 3.54E-6 4.14E-6 3.50E-5 3.31E-5 3.86E-5
Onitsha/ukpor Inhalation Cr 1.55E-12 6.25E-12 1.04E-13 2.76E-12 1.71E-12 5.17E-13
As 2.84E-11 3.42E-10 - 5.03E-11 6.06E-11 -
Pb - 3.68E-10 2.31E-11 - 6.52E-11 4.09E-11
Mn 5.80E-12 5.80E-9 2.90E-10 1.03E-11 3.32E-10 5.13E-10
Ni 1.94E-12 5.69E-11 2.13E-11 3.43E-12 1.01E-11 3.77E-11
Cu 2.18E-12 6.43E-10 6.76E-11 3.49E-12 1.14E-10 3.23E-11
Fe 9.55E-10 1.75E-8 1.90E-9 1.69E-9 3.11E-9 1.39E-10
Onitsha/Kara street Inhalation Cr 8.97E-10 - - 1.70E-12 - 3.37E-9
As 3.50E-11 3.51E-10 - 6.20E-11 6.21E-11 -
Pb 5.01E-11 4.52E-10 - 8.88E-11 8.01E-11 -
Mn 2.00E-10 2.56E-9 - 3.54E-10 4.54E-10 -
Ni 1.94E-11 3.88E-10 - 3.44E-11 6.87E-11 -
Cu 3.54E-11 9.03E-10 - 3.62E-5 1.60E-10 -
Fe 2.00E-9 1.93E-8 - 3.55E-9 3.43E-9 -
Nkpor/Achalputa Inhalation Cr - 8.63E-12 - ¬ 1.53E-12 -
As 4.10E-11 2.99E-10 - 7.28E-11 5.29E-11 -
Pb 3.06E-11 6.17E-10 - 5.43E-11 1.09E-10 -
Mn 1.61E-10 3.04E-9 - 2.86E-10 5.40E-10 -
Ni 2.35E-12 1.21E-10 - 4.16E-12 2.15E-11 -
Cu 6.28E-11 1.43E-9 - 1.12E-10 2.53E-10 -
Fe 1.85E-9 1.78E-8 - 3.28E-9 3.16E-9 -
Nkpor/Mechanic Inhalation Cr 3.45E-12 3.47E-14 9.20E-13 3.06E-13 6.13E-14 1.84E-13
As 2.46E-11 1.21E-11 - 5.60E-11 2.14E-12 -
Pb 2.91E-11 5.67E-10 3.59E-11 5.21E-11 2.37E-10 6.48E-11
Mn 1.92E-10 3.24E-9 3.29E-10 3.35E-10 5.75E-10 5.82E-10
Ni 1.09E-11 1.59E-10 1.82E-11 1.98E-11 2.82E-11 3.23E-11
Cu 5.97E-11 1.11E-9 8.34E-11 1.06E-10 1.96E-10 1.48E-10
Fe 1.93E-9 1.81E-6 2.03E-9 3.43E-9 3.08E-9 3.60E-9
Onitsha/Ukpor street Dermal Cr 3.10E-19 1.93E-19 2.07E-20 7.10E-21 4.42E-21 4.73E-22
As 5.66E-18 6.82E-18 - 1.30E-19 1.56E-19 -
Pb - 7.32E-18 4.60E-18 4.16E-12 1.68E-19 1.05E-19
Mn 1.16E-18 3.73E-17 5.78E-17 2.65E-20 8.56E-19 1.32E-18
Ni 3.85E-19 1.14E-18 4.24E-18 8.84E-21 2.61E-20 9.74E-20
Cu 4.31E-19 1.28E-17 1.35E-17 9.95E-21 4.41E-19 3.09E-19
Fe 1.93E-16 3.49E-16 3.79E-16 4.36E-18 8.03E-18 8.68E-18
Onitsha/Kara street Dermal Cr 1.93E-19 - - 4.42E-21 - -
As 6.97E-18 6.99E-18 - 1.60E-19 1.60E-19 -
Pb 1.00E-17 9.04E-18 - 2.29E-19 2.07E-19 -
Mn 3.98E-17 5.10E-17 - 9.14E-19 1.17E-18 -
Ni 3.87E-18 7.75E-18 - 8.87E-20 1.77E-19 -
Cu 1.81E-17 1.80E-17 - 4.16E-19 4.14E-19 -
Fe 4.00E-16 3.86E-16 - 9.17E-18 8.86E-18 -
Nkpor/Achalputa Dermal Cr - 1.72E-19 - ¬ 3.95E-21 -
As 8.19E-18 5.95E-18 - 1.88E-19 1.36E-19 -
Pb 2.37E-13 1.23E-17 - 1.40E-19 2.82E-19 -
Mn 3.21E-17 6.07E-17 - 7.27E-19 1.39E-18 -
Ni 4.68E-19 2.43E-18 - 1.07E-20 5.56E-20 -
Cu 1.25E-17 2.85E-17 - 2.87E-19 6.54E-19 -
Fe 3.69E-16 3.55E-16 - 8.45E-18 8.14E-18 -
Nkpor/Mechanic Dermal Cr 3.43E-20 6.90E-21 1.03E-19 7.90E-22 1.58E-22 2.37E-21
As 6.28E-18 2.41E-19 - 1.44E-19 5.53E-21 -
Pb 5.86E-18 2.67E-17 7.30E-18 1.34E-19 1.79E-18 1.67E-19
Mn 3.83E-17 6.46E-17 6.56E-17 8.79E-19 1.48E-18 1.50E-18
Ni 2.05E-18 3.17E-18 3.63E-18 5.12E-20 7.28E-20 8.32E-20
Cu 1.19E-17 2.21E-17 1.66E-17 2.73E-19 5.05E-19 3.81E-19
Fe 3.85E-16 3.46E-16 4.05E-16 8.82E-18 7.95E-18 9.28E-18
Table 5.
Hazard quotient of all the metals via ingestion, inhalation and dermal contact on adult and children at different locations
Locations Exposure route Heavy metals Adult
Children
Car dust Rooftop Dust Topsoil Car dust Rooftop Dust Topsoil
Onitsha/Ukpor street Ingestion Cr 1.06E-6 6.59E-7 7.03E-8 9.86E-6 6.15E-6 6.57E-7
As 1.93E-4 2.32E-4 - 1.80E-3 2.21E-3 -
Pb - 2.15E-5 1.35E-5 - 2.00E-4 1.25E-4
Mn 2.52E-7 7.99E-6 1.26E-5 2.35E-6 7.58E-5 8.85E-5
Ni 1.97E-7 1.37E-5 2.17E-6 1.84E-6 5.41E-6 2.03E-5
Cu 1.11E-7 3.28E-6 3.45E-6 1.40E-6 3.06E-5 4.83E-5
Fe 2.25E-7 4.25E-7 4.61E-7 2.16E-6 3.97E-6 4.30E-6
Onitsha/Kara street Ingestion Cr 6.57E-7 - - 6.14E-6 - -
As 2.38E-4 2.38E-4 - 2.22E-3 2.22E-3 -
Pb 1.54E-4 2.64E-5 - 2.73E-4 2.46E-4 -
Mn 8.67E-6 7.55E-6 - 8.08E-5 1.03E-4 -
Ni 1.98E-6 3.96E-6 - 1.84E-5 3.69E-5 -
Cu 4.63E-6 4.61E-6 - 4.33E-5 4.31E-5 -
Fe 5.05E-7 4.70E-7 - 4.54E-6 4.39E-6 -
Nkpor/Achalputa Ingestion Cr - 5.87E-7 - - 5.48E-6 -
As 2.79E-4 2.03E-4 - 2.61E-3 1.89E-3 -
Pb 1.78E-5 3.59E-5 - 1.66E-4 3.35E-4 -
Mn 6.99E-6 1.32E-5 - 6.53E-5 1.23E-4 -
Ni 2.40E-7 1.24E-7 - 2.24E-6 1.16E-5 -
Cu 3.20E-6 7.30E-6 - 2.99E-5 6.81E-5 -
Fe 4.49E-7 4.32E-7 - 3.19E-6 4.04E-6 -
Nkpor/Mechanic Ingestion Cr 1.17E-7 2.35E-8 3.53E-7 1.10E-6 2.19E-7 3.29E-6
As 2.14E-4 8.23E-6 - 1.99E-3 7.67E-5 -
Pb 1.71E-5 7.80E-5 2.13E-5 1.60E-4 6.99E-4 1.99E-4
Mn 8.32E-6 1.41E-5 1.43E-5 7.78E-5 1.31E-4 1.33E-4
Ni 1.14E-6 1.62E-6 2.37E-5 1.06E-5 1.51E-5 1.73E-5
Cu 3.04E-6 5.63E-6 4.25E-6 2.84E-5 5.26E-5 3.97E-5
Fe 4.86E-7 4.22E-7 4.93E-7 4.37E-6 3.94E-6 6.90E-6
Onitsha/ukpor Inhalation Cr 5.43E-8 2.17E-7 3.63E-9 9.64E-8 5.99E-8 6.43E-9
As 9.43E-8 1.14E-6 - 1.18E-7 2.01E-7 -
Pb - 1.04E-7 6.55E-9 - 1.85E-8 1.16E-8
Mn 4.06E-7 1.31E-4 2.02E-5 7.20E-7 2.32E-5 3.59E-5
Ni 9.37E-11 2.76E-9 1.03E-9 1.67E-10 4.90E-10 1.83E-9
Cu 5.43E-11 1.60E-8 1.68E-9 8.69E-11 2.84E-9 3.47E-9
Fe 4.34E-6 7.97E-5 8.65E-6 7.69E-6 1.41E-5 1.09E-5
Onitsha/Kara street Inhalation Cr 3.38E-8 - - 5.99E-8 - -
As 1.16E-7 1.16E-6 - 2.06E-7 2.06E-7 -
Pb 1.42E-6 1.29E-7 - 2.53E-8 2.28E-8 -
Mn 1.39E-5 1.79E-4 - 2.47E-5 3.17E-5 -
Ni 9.40E-10 1.88E-8 - 1.67E-10 3.34E-9 -
Cu 2.26E-9 2.25E-8 - 4.01E-9 3.99E-9 -
Fe 9.10E-6 8.81E-5 - 1.62E-5 1.56E-5 -
Nkpor/Achalputa Inhalation Cr - 3.02E-7 - ¬ 5.35E-8 -
As 1.36E-7 9.91E-7 - 2.42E-7 1.76E-7 -
Pb 8.71E-9 1.75E-7 - 1.54E-8 3.10E-8 -
Mn 1.13E-5 2.13E-4 - 2.00E-5 3.77E-5 -
Ni 1.14E-10 5.90E-9 - 2.02E-10 1.05E-9 -
Cu 1.57E-9 3.56E-8 - 2.77E-9 6.31E-9 -
Fe 8.40E-6 8.09E-5 - 1.49E-5 1.44E-5 -
Nkpor/Mechanic Inhalation Cr 6.04E-9 1.21E-9 1.81E-8 1.07E-8 2.14E-9 3.21E-8
As 1.04E-7 4.00E-7 - 1.86E-7 7.31E-8 -
Pb 8.36E-9 1.61E-7 1.02E-8 1.14E-8 6.73E-8 1.84E-8
Mn 1.34E-5 2.27E-4 2.30E-5 2.38E-5 4.02E-5 4.08E-5
Ni 5.43E-10 7.70E-9 8.83E-10 9.62E-10 1.37E-9 1.57E-9
Cu 1.48E-9 2.75E-8 2.08E-9 2.63E-9 4.88E-9 3.68E-9
Fe 8.77E-6 8.21E-5 9.22E-6 1.56E-5 1.40E-5 1.64E-5
Onitsha/Ukpor street Dermal Cr 6.18E-15 3.86E-15 4.31E-16 6.82E-17 8.84E-17 9.47E-18
As 4.60E-14 5.54E-14 - 1.05E-15 1.27E-15 -
Pb - 1.40E-14 8.79E-15 - 3.21E-16 2.01E-16
Mn 6.28E-16 2.03E-14 3.14E-14 1.44E-17 4.65E-16 7.20E-16
Ni 7.16E-17 2.11E-16 7.86E-16 1.64E-18 3.82E-18 1.80E-17
Cu 3.61E-17 3.25E-15 3.74E-16 8.30E-19 2.45E-17 2.57E-17
Fe 2.75E-15 4.99E-15 5.41E-15 6.23E-17 1.14E-16 1.24E-16
Onitsha/Kara street Dermal Cr 3.84E-15 - - 8.83E-17 - -
As 5.67E-14 5.67E-14 - 1.30E-15 1.30E-15 -
Pb 1.90E-14 1.71E-14 - 4.37E-16 3.95E-16 -
Mn 2.03E-14 2.77E-14 - 4.96E-16 6.36E-16 -
Ni 7.17E-16 1.43E-15 - 1.64E-17 3.29E-17 -
Cu 1.51E-15 1.50E-15 - 3.46E-17 3.45E-17 -
Fe 5.72E-15 5.52E-15 - 1.31E-16 1.27E-16 -
Nkpor/Achalputa Dermal Cr - 3.44E-15 - - 7.90E-17 -
As 6.66E-14 4.84E-14 - 1.52E-15 1.11E-5 -
Pb 1.16E-14 2.34E-14 - 2.67E-16 5.37E-16 -
Mn 1.75E-14 3.30E-14 - 4.01E-16 7.57E-16 -
Ni 8.53E-17 4.49E-16 - 1.99E-18 1.03E-17 -
Cu 6.50E-16 2.38E-15 - 2.39E-17 5.45E-17 -
Fe 5.27E-15 5.07E-15 - 1.21E-16 1.17E-16 -
Nkpor/Mechanic Dermal Cr 6.9-E-16 1.38E-16 2.07E-15 1.58E-17 3.16E-18 4.73E-17
As 5.10E-14 1.96E-14 - 3.18E-15 4.50E-17 -
Pb 1.12E-14 5.08E-14 1.39E-14 2.56E-16 1.17E-15 3.19E-16
Mn 2.08E-14 3.51E-14 3.56E-14 2.04E-14 8.05E-16 8.17E-16
Ni 4.13E-16 5.86E-16 6.72E-16 9.33E-18 1.35E-17 1.54E-17
Cu 9.91E-16 1.83E-15 1.39E-15 2.27E-17 4.21E-17 3.18E-17
Fe 5.50E-15 4.95E-15 5.78E-15 1.26E-16 1.14E-16 1.33E-16
Table 6.
Total Hazard Quotient (THQ) and Hazard index (HI) of all the metals via ingestion, inhalation and dermal contact on adult and children at different locations
Locations Exposure route Heavy metals Adult
Children
Car dust Rooftop Dust Topsoil Car dust Rooftop Dust Topsoil
Onitsha Ingestion Cr 1.72E-6 6.59E-7 7.03E-8 1.60E-5 6.15E-6 6.57E-7
As 4.31E-4 4.70E-4 - 4.02E-3 4.43E-3 -
Pb 1.54E-4 4.79E-5 1.35E-5 2.73E-4 4.46E-4 1.25E-4
Mn 8.92E-6 1.55E-5 1.26E-5 8.32E-5 1.79E-4 8.85E-5
Ni 2.18E-6 1.77E-5 2.17E-6 2.02E-5 4.23E-5 2.03E-5
Cu 4.74E-6 7.89E-6 3.45E-6 4.47E-5 7.37E-5 4.83E-5
Fe 7.03E-7 8.95E-7 4.61E-7 6.70E-6 8.36E-6 4.30E-6
Onitsha Ingestion Cr 8.81E-8 2.17E-7 3.63E-9 1.56E-7 5.99E-8 6.43E-9
As 2.10E-7 2.30E-6 - 3.24E-7 4.07E-7 -
Pb 1.42E-7 2.33E-7 6.55E-9 2.53E-8 4.13E-8 1.16E-8
Mn 1.43E-5 3.10E-4 2.02E-5 2.53E-5 5.49E-5 3.59E-5
Ni 1.03E-9 2.16E-8 1.03E-9 3.34E-10 3.83E-9 1.83E-9
Cu 2.31E-9 3.85E-8 1.68E-9 4.10E-9 6.83E-9 3.47E-9
Fe 1.34E-5 1.68E-4 8.65E-6 2.39E-5 2.97E-5 1.09E-5
Onitsha Dermal Cr 1.00E-14 3.86E-15 4.31E-16 1.57E-16 8.84E-17 9.47E-18
As 1.03E-13 1.12E-13 - 2.35E-15 2.57E-15 -
Pb 1.90E-14 3.11E-14 8.79E-15 4.37E-16 7.16E-16 2.01E-16
Mn 2.09E-14 4.80E-14 3.14E-14 5.10E-16 1.10E-15 7.20E-16
Ni 7.89E-16 1.64E-15 7.86E-16 1.80E-17 3.67E-17 1.80E-17
Cu 1.55E-15 4.75E-15 3.74E-16 3.54E-17 5.90E-17 2.57E-17
Fe 8.47E-15 1.05E-14 5.41E-15 1.93E-16 2.41E-16 1.24E-16
Nkpor Ingestion Cr 1.17E-7 6.11E-7 3.53E-7 1.10E-6 4.61E-6 3.29E-6
As 4.93E-4 2.11E-4 - 4.60E-3 8.22E-5 -
Pb 3.49E-5 1.14E-4 2.13E-5 3.26E-4 1.03E-3 1.99E-4
Mn 1.53E-5 2.73E-5 1.43E-5 1.43E-4 2.54E-4 1.33E-4
Ni 1.38E-6 1.74E-6 2.37E-5 1.28E-5 2.67E-5 1.73E-5
Cu 6.24E-6 1.29E-5 4.25E-6 5.83E-5 1.21E-4 3.97E-5
Fe 9.35E-7 8.54E-7 4.93E-7 7.56E-6 7.98E-6 6.90E-6
Nkpor Inhalation Cr 6.04E-9 3.03E-7 3.21E-8 1.07E-8 5.56E-8 3.21E-8
As 2.40E-7 1.39E-6 - 4.28E-7 2.49E-7 -
Pb 1.71E-8 3.36E-7 1.84E-8 2.68E-8 9.83E-8 1.84E-8
Mn 2.47E-5 4.40E-4 4.08E-5 4.38E-5 7.79E-5 4.08E-5
Ni 6.57E-10 1.36E-8 1.57E-9 1.16E-9 2.42E-9 1.57E-9
Cu 3.05E-9 6.31E-8 3.68E-9 5.40E-9 1.12E-8 3.68E-9
Fe 1.72E-5 1.63E-4 1.64E-5 3.05E-5 2.84E-5 1.64E-5
Nkpor Dermal Cr 6.90E-16 3.58E-15 2.07E-15 1.58E-17 8.22E-17 4.73E-17
As 1.18E-13 6.80E-14 - 4.70E-15 1.16E-15 -
Pb 2.28E-14 7.42E-14 1.39E-14 5.23E-16 1.71E-15 3.19E-16
Mn 3.83E-14 6.81E-14 3.56E-14 2.08E-14 1.56E-15 8.17E-16
Ni 4.98E-16 1.04E-15 6.72E-16 1.13E-17 2.38E-17 1.54E-17
Cu 1.64E-15 4.21E-15 1.39E-15 4.66E-17 9.66E-17 3.18E-17
Fe 1.08E-14 1.00E-14 5.78E-15 2.47E-16 2.31E-16 1.33E-16
Onitsha HI Cr 1.81E-6 8.76E-7 7.39E-8 1.62E-5 6.21E-6 6.63E-7
As 4.31E-4 4.72E-4 - 4.02E-3 4.43E-3 -
Pb 1.54E-4 4.81E-5 1.35E-5 2.73E-4 4.46E-4 1.25E-4
Mn 2.32E-5 3.26E-4 3.28E-5 1.09E-4 2.34E-4 1.24E-4
Ni 2.18E-6 1.77E-5 2.17E-6 2.02E-5 4.23E-5 1.73E-5
Cu 4.74E-6 7.93E-6 3.45E-6 4.47E-5 7.37E-5 3.97E-5
Fe 1.41E-5 1.69E-4 9.11E-6 3.06E-5 3.81E-5 1.78E-5
Nkpor HI Cr 1.23E-7 9.14E-7 8.84E-8 1.11E-6 4.67E-6 3.32E-6
As 4.93E-4 2.12E-4 - 4.60E-3 8.25E-5 -
Pb 3.49E-5 1.14E-4 2.13E-5 3.26E-4 1.03E-3 1.99E-4
Mn 4.00E-5 4.67E-4 3.73E-5 1.87E-4 3.32E-4 1.74E-4
Ni 1.53E-5 1.75E-6 2.37E-5 1.28E-5 2.67E-5 1.73E-5
Cu 6.24E-6 1.30E-5 4.25E-6 5.83E-5 1.21E-4 3.97E-5
Fe 1.81E-5 1.64E-4 6.75E-5 3.81E-5 3.64E-5 2.33E-5
Table 7.
Cancer risk (CR) and total cancer risk (TCR) of all the metals via ingestion, inhalation and dermal contact on adult and children at different locations
Locations Exposure route Heavy metals Adult
Children
Car dust Rooftop Dust Topsoil Car dust Rooftop Dust Topsoil
Onitsha CRing Cr 2.58E-9 9.89E-10 1.06E-10 2.40E-8 9.22E-9 9.87E-10
As 1.94E-7 2.11E-7 - 1.10E-6 1.98E-6 -
Pb 8.70E-10 1.39E-9 4.00E-10 8.12E-9 6.11E-12 3.73E-9
Ni 7.39E-8 1.62E-7 7.39E-8 6.90E-7 1.44E-6 6.88E-7
Onitsha CRinh Cr 1.06E-12 2.63E-10 4.37E-12 1.53E-12 7.20E-11 7.70E-12
As 2.72E-13 2.91E-12 - 5.63E-13 2.63E-10 -
Pb 2.11E-12 3.45E-11 9.69E-13 3.73E-12 9.89E-9 1.72E-12
Ni 1.79E-11 7.01E-10 1.97E-11 3.18E-11 6.63E-11 3.17E-11
Onitsha CRdermal Cr 1.01E-17 3.86E-18 4.13E-19 9.51E-20 8.84E-20 5.68E-20
As 4.62E-17 5.05E-17 - 1.06E-18 1.16E-`8 -
Pb - - - - - -
Ni 1.80E-9 3.77E-17 1.80E-10 4.15E-19 8.64E-19 4.13E-19
Nkpor CRing Cr 1.77E-10 9.18E-10 5.30E-10 1.65E-9 8.59E-9 4.93E-10
As 2.52E-7 9.49E-8 - 2.07E-6 8.87E-7 -
Pb 1.04E-9 3.36E-9 6.36E-10 9.71E-9 1.45E-11 5.93E-9
Ni 4.69E-8 9.71E-8 6.30E-8 2.39E-5 9.07E-7 5.88E-8
Nkpor CRinh Cr 7.27E-14 3.64E-10 2.18E-10 1.29E-13 6.68E-11 3.87E-11
As 3.11E-13 1.34E-12 - 5.54E-13 2.37E-13 -
Pb 2.53E-12 4.97E-11 1.51E-12 4.47E-12 3.17E-8 2.72E-12
Ni 1.14E-11 2.36E-10 1.53E-11 2.02E-11 4.18E-11 2.71E-11
Nkpor CRdermal Cr 6.90E-19 3.58E-18 2.07E-18 1.58E-20 1.11E-19 4.73E-20
As 5.30E-17 2.27E-17 - 1.22E-18 5.20E-19 -
Pb - - - - - -
Ni 1.15E-17 2.38E-17 1.54E-17 2.63E-19 5.45E-19 3.54E-19
Onitsha TCR Cr 2.58E-9 1.25E-9 1.10E-10 2.40E-8 9.29E-9 9.95E-10
As 1.94E-7 2.11E-7 - 1.10E-6 1.98E-6 -
Pb 8.72E-10 1.42E-9 4.01E-10 8.12E-9 9.90E-9 3.73E-9
Ni 7.39E-8 1.63E-7 7.39E-8 6.90E-7 1.44E-6 6.88E-7
Nkpor TCR Cr 1.77E-10 1.28E-9 7.48E-10 1.65E-9 8.66E-9 5.32E-10
As 2.52E-7 9.50E-9 - 2.07E-6 8.87E-7 -
Pb 1.04E-9 3.41E-9 6.38E-10 9.71E-9 3.17E-8 5.93E-9
Ni 4.69E-8 9.73E-8 6.30E-8 2.39E-5 9.07E-7 5.88E-8
TOOLS
PDF Links  PDF Links
PubReader  PubReader
ePub Link  ePub Link
XML Download  XML Download
Full text via DOI  Full text via DOI
Download Citation  Download Citation
  Print
Share:      
METRICS
0
Crossref
0
Scopus
355
View
24
Download
Editorial Office
Division of Environmental Science and Ecological Engineering, Korea University
145 Anam-ro, Seongbuk-gu, Seoul 02841, Korea
Tel : +82-32-560-7520   E-mail: envitoxic@gmail.com
About |  Browse Articles |  Current Issue |  For Authors and Reviewers
Copyright © 2024 by The Korean Society of Environmental Health and Toxicology & Korea Society for Environmental Analysis.     Developed in M2PI