


Introduction
Indonesia is one of the countries where its people's lives depend on agricultural sectors. The reason is that Indonesia itself is a country with strategic geography for its natural resources such as oil, gas, and various kinds of biological diversity caused by Indonesia island's soil rich in nutrients [1, 2]. With those advantages, Indonesian people cultivate their land to produce a wide kind of agricultural products such as rice, vegetables, fruits, etc [3] Therefore, agricultural products become an important sector for the emerging Indonesian economy and compete with outside countries [3]. This statement was strengthened by gross domestic product data (PDB) collected by the Indonesia Central Bureau of Statistics (BPS) (see Figure 1). Indonesian gross domestic product data for agriculture for several years, from 2010 until 2021 had a high distribution percentage of PDB (see Figure 1).
To achieve optimal agricultural production, there are several challenges that farmers in Indonesia must face, including a lack of irrigation sources, climate change, and controlling pest growth [5]. In achieving this optimality, Indonesian farmers rely heavily on pesticides as a tool to prevent, destroy, and reduce pests [6]. Especially pests cause 20-40% of global crop reduction every year approximately [7]. The use of pesticides as an alternative for controlling pests and protecting crops is increasing all the time, as can be seen from the approximately 4000 brands of pesticides that are currently registered with the Indonesian Ministry of Agriculture and are permitted for sale in Indonesia [8]. Heavy reliance on pesticides may be seen as a good way to handle pests around crops, but if the pesticide is used irresponsibly, it might be more harmful to the environment than its effectiveness in controlling pest growth [9]. One of the reasons it may be harmful to the environment is the origin of the pesticide itself.
Origin of pesticides are toxic substances and dangerous compounds for organisms such as pests and humans (farmers) if they are exposed [10]. However, most farmers around the world do not have enough knowledge related to the safe use of pesticides and in actual practice, farmer tends to use excessive doses than the recommended dose of the pesticide [11, 12]. Consequently, the excess dose becomes residues and causes serious contamination to the environment and organisms surrounding it [13, 14]. The residue of pesticides would accumulate in the ground and even affect the nutrition of farm soil by degrading and making crops hard to grow to their potential [15]. This is why pesticide selection and its application need to respectfully follow the guidance of the pesticide from the producer. Because each pesticide produced around the world has different toxicity levels and different effectiveness and cannot be generalized treatment [16, 17, 18].
To further research into the importance of solving the problem of pesticide use, this study conducted a review of journal articles to find out whether there had been any research that was able to provide an effective solution concerning pesticide use and how far along the topic of research was. After reviewing research articles in international journals, this study found 2 research that provided solutions for assessing better and safer pesticide options to use. However, it was found that there were unresolved gaps in the articles, including that the research was focused on assessing the risk of using pesticides in the air [19] and assessing pesticides on only one type of plant [20]. Rather than just building a pesticide assessment model that is only capable of assessing the risk of pesticides for air pollution or focuses on the safe use of tea plants, it would be better to be able to carry out general pesticide assessments for all crops. In this way, the pesticide assessment model can provide broad general guidance to farmers in selecting pesticide solutions that are safer for the environment around all kinds of agriculture.
With the concerns stated above and the need for guidance on pesticide selection, this study presented a decision-support model with the main conception of fuzzy logic method in measuring the level of safety of pesticide use for the environment. This research aims to fill the gap in problems from previous research by building a pesticide assessment model that isn’t only capable of assessing pesticides specifically but capable of assessing pesticides in general and broadly regarding their safety when exposed to the environment around agriculture. In this study, the model created had a scale score from 0 to 10 where the smaller the scale point indicates the pesticide is not safe / not recommended for use and the bigger the scale score indicates the pesticide is safe for use in the agricultural environment. The model created considered several parameters related to pesticide effect on the environment and the behavior of the pesticide itself supported by the discussion of Indonesian experts related to environmental health assessment in the creation of the fuzzy rule used in this study. The model based on fuzzy logic conception was created with the intention for farmers around the world, especially in Indonesia can be assisted in pesticide selection for their farms and for Indonesian-related government in controlling pesticide usage to minimize the potential of the pesticides used being harmful to the environment exposed by the pesticide.
Related Work
Before this research was conducted, there were researches conducted also related to pesticide assessment. In one of the research, pesticide assessment was conducted to develop a fuzzy knowledge-based model for assessing the risk of pesticides into the air [19]. The methods used in the study include a literature study similar to this study, for knowledge gathering for the creation of functions, control rules, and logical inference systems. Parameter input variables used in the fuzzy model for assessing the risk of pesticides into the air include Henry's law constant, droplet size, and current wet bulb temperature depression. Results found from that research showed that the independent model had successfully shown great accuracy fit between simulation risk assessment with the observed values under experimental conditions. Not only by great accuracy fit but also risk values simulated by the model allow identification of environmental conditions that can reduce the risk of pesticides in the air. One other research that also related to pesticide assessment was research that utilized a fuzzy analytic hierarchy process (AHP) to screen the safe use of pesticides for tea plantations [20]. Even though the knowledge used in the creation of the model was the same that is fuzzy, the process of decision in fuzzy was different. The parameters or criteria used in the fuzzy AHP model created in that study include half-life of pesticides on tea plants, water solubility, vapor pressure, acceptable daily intake, LD50 rat, bee, and aquatic organism. The result found from that study was that according to the AHP model created, water solubility was the most important factor in evaluating pesticide safety towards tea plantations and pesticides with a score < 25 were regarded as safe pesticide compounds for tea plantations.
Even though those studies and this study also used the same fuzzy logic for pesticide assessment, the parameters and the purpose of the model were different. After reading the study above, the author found there was a hole, where not only air conditions need to be assessed but also the general environment including the ecosystem surrounding the land pesticide exposed also needed, and fuzzy assessment toward pesticide safety could also be used for other farm plantations. To improve pesticide assessment further and widely, other factors/indicators are needed including beneficial organism exposure and pesticide characteristics.
Research Methodology
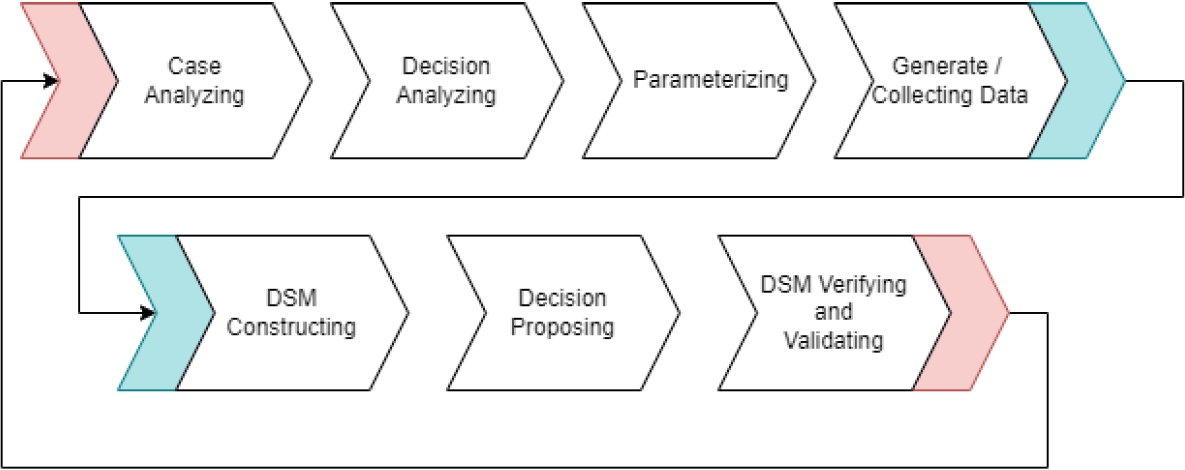
In this study, the methodology consisted of 7 stages of the process including case analysis, decision analysis, parameterizing, generating/collecting data, DSM creation, decision proposing, and DSM verification and validation following the DSM wheel methodology [21] (Figure 2). The original DSM wheel process had 8 stages of the process, but because of the limitation of time in this study, the implementation and evaluation of the decision were skipped and finished by evaluating and validation model.
Case analysis and decision analysis were conducted by using literature study methods. In those processes, a deepening understanding of pesticide cases, all kinds of decisions, and possible indicators and factors that contributed to pesticide assessment were found using literature study methods. The next process that also used literature study as its method was parameterizing. In parameterizing methods, a literature study was conducted to find parameters that could be used in pesticide assessment toward environmental health.
Literature study methods in parameterizing had goals to find which indicator or characteristic of a pesticide could be used in determining whether a pesticide is safe or not. There was also a thing that needed to be considered in indicator searching such as whether the indicator had clear categorization or clear value boundary such as if the value of the parameter getting smaller then it's bad for environment health and vice versa. Another method used in the parameterizing process includes interviews and sharing knowledge with environmental experts. To avoid biased knowledge only based on the author's understanding, interviews and sharing knowledge with environmental experts were needed. Interviews and sharing knowledge with experts were conducted to validate whether the parameter used for the DSM was used correctly and consult about the rate of importance of each parameter. The importance of this study using interviews and sharing knowledge with experts as its proposed method was because of awareness of the author's inexperience in the field of this study and also to avoid any false information given from this study.
The generating/collecting data stages are different from other domains of data science where the existing data is needed, but in DSM research the data can be generated and collected. Data collected in this stage was gathered from several sources such as international databases such as Codex and research articles. Because the source of data needed in this study was scattered, data cleaning and mathematical calculation were needed to find the respective data needed. The data collected in this stage was pesticide value for existing parameters found for example, half-life of pesticide in days. The purpose of generating or collecting data was to be used in DSM testing with real pesticide data to assess whether the DSM could successfully determine pesticide safety level points. In this stage, a mathematical calculation was also used to find the value of the parameter used in the DSM assessment. Mathematical calculation used in this study was general mathematical such as division and multiplying of the formula of the parameter found.
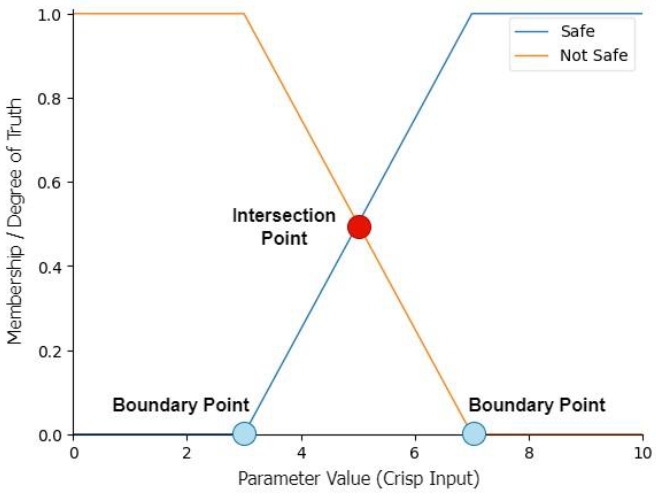
In the stages of DSM creation, the DSM was created by using the theory of fuzzy logic. In fuzzy logic DSM creation, components of fuzzy logic needed to be created such as membership function and fuzzy rule-based. The membership function created in this study was by using two types of combination of fuzzy models called trapezoid-triangular and s-function-z-function. The range of each member in the membership function was created following the range of categorization from parameters found in the research article with the literature study method. To find the intersection, point of each membership function between each member in the membership function (Figure 3), the statistical calculation method was used. The statistical method used in this study was called median to find a point of value where two category lines met and the average was used to determine the weight of each parameter collected from discussions with experts.
The fuzzy rule-based in this study was created by quantitative analysis. Each of the parameters found in this study had its contribution in determining the safety point of pesticides if exposed to the environment. However, each parameter had a different score of the weight of its contribution in the assessment of pesticide safety level points. Quantitative analysis used in this study was used to determine fuzzy rule-based results collected after finding the average weight of each parameter after consultation and knowledge-sharing with the expert.
Quantitative analysis used in this study was by multiplying the point of value found from each parameter value, ex: Low (0), Moderate (0.5), High (1) with each corresponding parameter weight (Formula 1).
In decision-proposing stage (see Figure 2), was the step that was conducted to find whether the DSM can assess correctly whether a pesticide is categorized as safe or not. This stage cannot be processed if the sample data produced in the generating/collecting data stage is not completed correctly. To be able to process the decision-proposing stage, complete sample data is required for each pesticide data (there must be no empty data value). The process of this stage includes input data samples into the DSM and the model would be assessed by whether its output had produced the expected results or not.
The last process of the DSM research process was DSM verifying and validating. This stage's goal was to verify and validate if the DSM was scientifically correct and if there was no false knowledge of the DSM. The DSM verification was conducted by literature study research articles to find any proof that supports the results/outputs of the DSM created. For the DSM validation was conducted simultaneously while interviews and consultation with experts. The validation was conducted by asking the experts whether the used of parameter was correctly used scientifically and parameter rightfully acted as an indicator assessment for determining pesticide safety level.
Results and Discussion
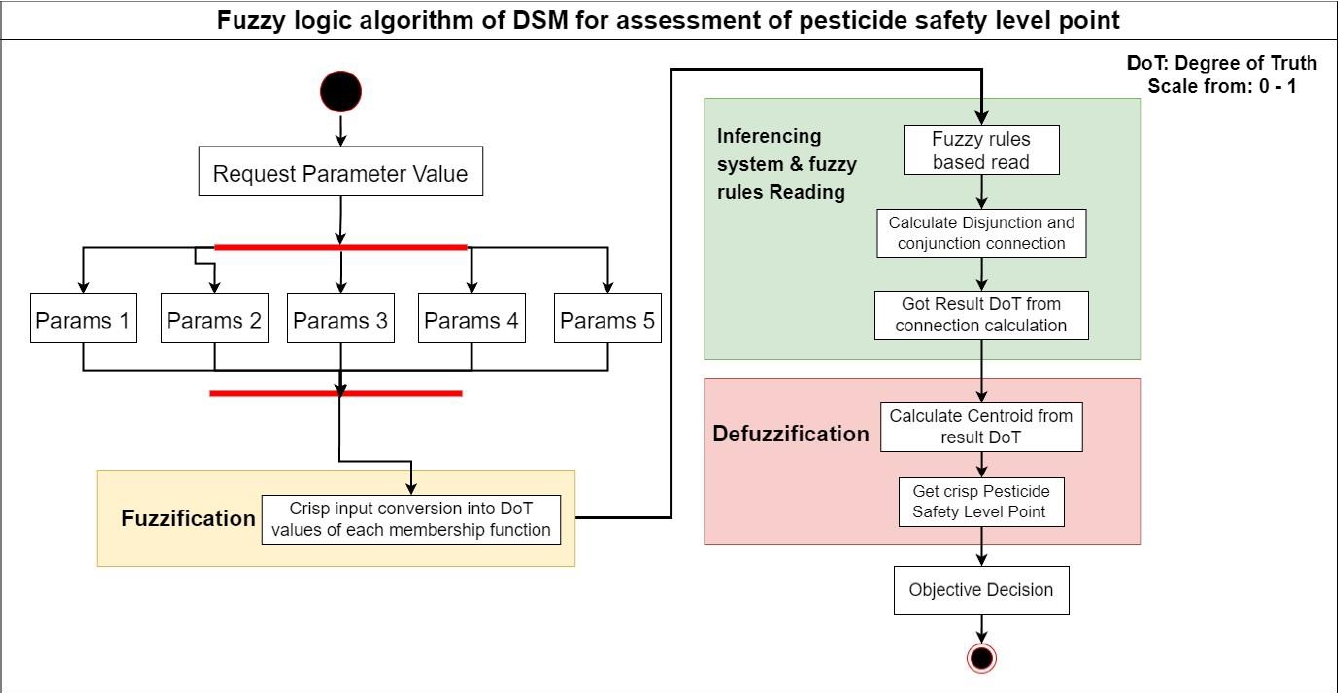
The algorithm used by the DSM for assessing pesticide safety levels in this study was the fuzzy logic algorithm. The workflow of the DSM started with the model requesting each parameter value provided by the user (Figure 4). After the model got the membership value of each parameter, the value itself would be transformed into fuzzy values using the fuzzification method. After the fuzzy value of each parameter was found, then its would underwent an inference system and fuzzy rule-based read. All the possible connections in fuzzy rule-based would be tested from the fuzzy value found and then calculated its disjunction connection value (Formula 3) and continued by conjunction connection (Formula 2).
The result of conjunction and disjunction connection called degree of truth (DoT) would be found and then underwent the next step in fuzzy logic called defuzzification. DoT found in the inference system and based-rule read then calculated to find the center of gravity from the result membership function. The result found then was the final output in the crisp output of pesticide safety level point and presented to the user to objectively propose whether the pesticide was safe for use or not. DSM model with the fuzzy logic method was coded using the scikit-fuzzy library with Python language. For the controller used skfuzzy-control and Fuzzy used skfuzzy.
Before any fuzzy logic calculation can be done and created as a decision support model, there are initial components of fuzzy logic that need to be prepared such as decision support parameters such as fuzzy membership function, fuzzy-based rule, and data sample for simulation.
The parameter used in this study was obtained by literature reviewing journal research to find health or pesticide indicators that are possible for consideration in pesticide assessment. Parameters that could be considered and selected for DSM assessment from journal research are indicators that have complete information including a clear range of boundaries for each categorization, and indicator description and meaning, even if the parameter doesn't have clear boundaries, there need to be clear instructions on whether the value is larger or smaller, it will be categorized as better for the environment or not. From the literature review, 5 decision parameters were used for this model to assess the safety level point of pesticides if it exposed to the environment. Considerations used in determining parameters include pesticide behavior/characteristics toward the environment and pesticide effect on important organisms (honey bees) that contribute to protecting a healthy environment.
The health of an environment depends on many important organisms that contribute to each other in making the environment more nutrient-rich. One of the important organisms for environmental health is bees, especially honey bees [22]. For the health of the agricultural environment, bees have a role as pollinators of various agricultural plants [23]. The pollination activity of a plant carried out by bees when taking nectar allows a plant to reproduce because the plant cannot move and reproduce on its own [24]. Not only as pollinators, bees have also been used in previous studies as indicators to measure the level of health or contamination of an environment. Scientifically it has been proven that bees are indeed excellent bio-monitors because of their bio-accumulation abilities as proven by the high OBI-U value [25]. With the ability of bees to act as bio-indicators, parameter indicators related to bees were used in assessing pesticide safety levels toward the environment.
Each parameter found and used in this decision model has its value range and categorization. For example, the 'persistency' parameters range, for non-persistent pesticides the range starts from 0 to 30 days, moderate persistent between 31 to 99 days, and persistent ranged from 100 to 200 the maximum. The model won't receive input outside the range of value of each parameter, but if the parameter input to the model is bigger than the maximum range, then the number input is the maximum value range of the parameter, ex: 'persistency' parameter value range from 0 to 200, if inputted value data from the model user is 250, then the input into the model will set the number down to 200 (maximum range value). A detailed description of all parameters (see Table 1).
All parameters mentioned above were collected by literature study of several articles in International Journal. Information found in the article includes an explanation about each of the parameters itself and also the range of parameters with the explanation of which score indicates good for the environment and bad for the environment (in Table 1). Some range of parameters used in this study (Table 1) such as maximum residue limit. There was not found in this study a direct range of categorization in whether pesticides considered had low residue limit or high residue limit. That was why to determine the range that was also used in the creation of the membership function, the author suggested using statistical methods called maximum and median from an international database called codex and determined the maximum residue limit by finding the biggest MRL score (number of score chosen also considered for model could be visualized in membership function) and the median from the biggest MRL score.
The weight of each parameter was completed using different methods of interviewing and sharing knowledge with expertise. Expertise was asked to rate the importance of each parameter by direct rating from a range of 0 (less important) to 5 (important). Then the rating from each expert was calculated into weight for each parameter and averaged to get the final weight for each parameter (in Table 2). The weight for each parameter from each expert was calculated by using logical mathematical calculations (Formula 4). Where pi was the scale obtained from each expert for each parameter and divided by the cumulative of all scales.
After all the parameters found with their corresponding ranges of categorization, the next step was done is transforming the range into a membership function (MF). There are two kinds of membership functions created needed as components in fuzzy logic, called antecedent (ctrl.Antecedent in scikit-fuzzy) and consequent (ctrl.Consequent in scikit-fuzzy). Each of the components of membership functions consists of a linguistic variable (LV) and degree of truth (DoT). The linguistic variable of the membership function was created by referencing the categorization of all parameters in Table 1. For example, in the LV for 'persistency' params there were 3 categorizations including 'Non-persistent', 'Moderate Persistent', and 'Persistent', then the membership function of ‘persistency’ LV will have three controllers whether using trapezoidal or triangular shape. After LV was ready, the next step was to map into MF, and LV with DoT references from the range of each value found in the literature study. The MF in this study uses a combination controller of triangular-trapezoidal shapes and z-function with s-function shapes. The triangular-trapezoidal membership function is used when the input variable has a clear boundary between each member region [32] and the z-function with an s-function shape is used when the input variable has a smooth transition between each member region. One of the general knowledge in fuzzy logic is that each membership region would have an intersection point between each member in MF, so to determine the intersection point (Figure 3), this study used median calculation to find the 50 percent intersection between each member in MF [33].
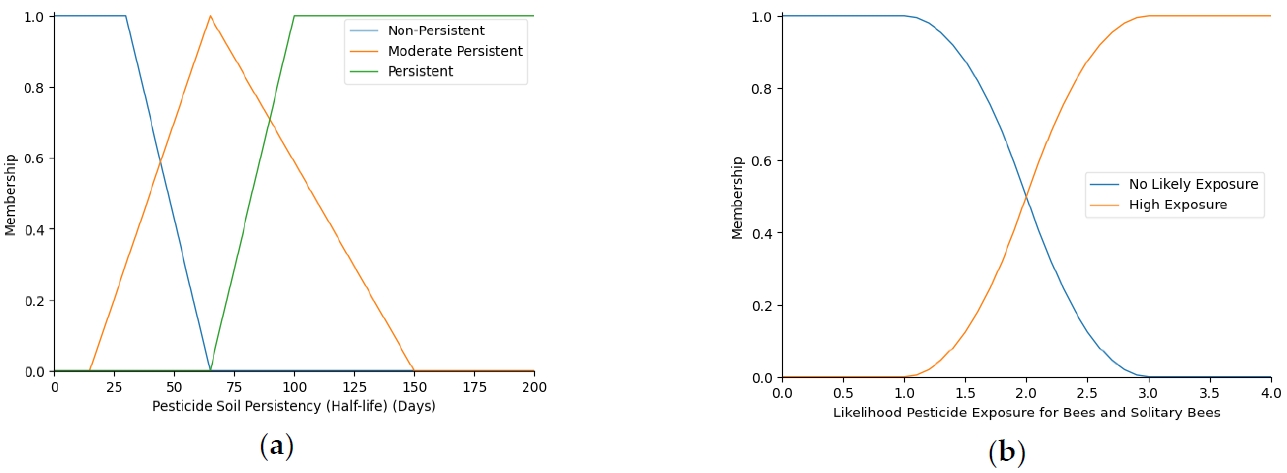
In this study, the model had 3 parameters that used a combination of triangular and trapezoidal controllers, and 2 parameters with a combination of s-shape and z-shape controllers. For example, a parameter that used triangular and trapezoidal shape controllers was the persistency membership function, non-persistent (trapmf [0, 0, 30, 65]), moderate persistent (trimf [15,65, 150]), and persistent (trapmf [65, 100, 200, 200]) (see Figure 5a). The parameter that used an s-shape and z-shape controller was the 'Likely Exposure Bees ' membership function with, no likely exposure (zmf [1,3]) and high exposure (smf [1,3]) (see Figure 5b).
The next important component of fuzzy logic for assessing whether pesticide data is safe is called fuzzy rule-based. Fuzzy rule-based contributed to information and knowledge as well as the interaction and relationship of each parameter in assessing pesticide data safety level points. Fuzzy rules-based modeled the conjunction and disjunction connection which was one of the main calculations in fuzzy logic. Fuzzy rules in this study were created by quantitative analysis and consultation with experts. The weight of each parameter found after consultation and interview with experts (see Table 2) was used to calculate whether a case of fuzzy rules is considered safe or not.
In creating fuzzy rules-based (Table 3), all possible combination of rules was conducted to find the result safety output for each possible combination. To determine the result safety output, each parameter output changed into number categorization. If the parameter has three unique values then categorization was changed into 0, 0.5, and 1 and for two unique parameter values, the categorization changed into 0 and 1. If the parameter value was classified as good / better for the environment, then the value will be close to 0 and vice versa will be close to 1, ex: ‘Non-Persistent’, ‘Moderate Persistent’, and ‘Persistent’ changed into 0, 0.5, and 1 consecutively and for ‘Low Residue Limit’ and ‘High Residue Limit’, changed into 1 and 0.
After each parameter value had changed into each corresponding value, each row of possible combinations was calculated with its weight (Formula 1). If the calculated result value is bigger than 0.5 then the safety result is not safe, but if the result value is smaller or equal to 0.5 then the safety result is safe (Table 4). Pesticide data samples for this study were acquired by data collecting from several sources including international databases and research articles. The collected data were used to simulate the evaluation of the model.
For sample data in Table 5, 'Persistency' column data found from the public databases online article [27, 34] table with column name soil half-life, 'LD50' column data found from previous research regarding pesticide risk assessment in the supplementary material section [35], and 'Likelihood Exposure' column data also found from previous research within table embedded in the main text [30]. Lastly for the MRLs column data were collected from Codex Alimentarius International Food Standards [36]. Different from other data sample parameters stated above that could collected easily, for the AEQ parameter, the value of each pesticide needs to be calculated first beforehand. The formula itself was found in a research article related to the parameter [28]. The formula found in the article was used to calculate the fitness indicator from multiple sums of pesticide residue exposed to bees (Formula 5). However, in this study, the formula was derived to calculate the fitness indicator from a single type of pesticide residue if exposed to a bee (Formula 6).
Before any AEQ calculation (Formula 6) could be done, there was a TUbee (Formula 7) score that needed to be calculated. The concentration formula was calculated with the assumption to find the concentration exposed to a bee (Formula 8). The number of percentages exposed (99 percent of an exposed pesticide does not reach target pests) [37] and the general number of bees in a colony (50,000 individual bees) [38] could be found in research articles and website articles. The value doses per hectare of each pesticide used in the calculation of the concentration of exposed pesticides (Formula 8) were found from several online safe-use instruction leaflets or articles for each pesticide. The doses per hectare for each pesticide can be seen in Table 6 where all the doses per use converted to milliliters.
To find whether the DSM build could assess pesticide safety levels, simulation testing was conducted with several data samples collected (Table 5). Based on the results of DSM testing using data samples, it was found that the pesticides dodine and iprodione were better pesticide choices for the environment than the 10 pesticide data samples tested, as seen from the safety level point which was on a scale of 7 (see Table 7). For the type of pesticide proposed by the model, the most not safe for pesticide include abamectin, chlorpyrifos, and methidalthion (see Table 7). The smaller safety level point means the pesticide was not safe if exposed to the environment and the bigger safety level point means the pesticide was a safer option to use.
The verification process in this research is aimed at assessing the degree of truth of the DSM model which was developed from theoretical concepts collected by reviewing literature related to indicators for assessing pesticides on the environment. Assessment of the degree of truth of verification of DSM was carried out on the number of variables/indicator parameters used, suitability of procedures, formulas used with formulas derived from references, and verification of the accuracy of calculation results of the fuzzy logic DSM system with algorithm procedures in fuzzy logic (consisting of fuzzification, fuzzy rule base reading, and defuzzification).
Table 9 explains the verification assessment process for the DSM model formed in this research. The verification carried out includes assessing whether the use of DSM formulas, procedures, or results using the fuzzy logic method follows the references used in this research. The method for determining the Ve value is represented by a value of 1, meaning that the elements in the model and the reference have the same meaning, and for a value of 0, vice versa. The value of the degree of truth of verification in DSM is 1 or is considered 100 percent of the degree of truth is correct, proven in Table 9 that the number of variables used follows the references found, the fuzzy logic algorithm procedure is also appropriate, namely starting from fuzzification and ending with defuzzification using the centroid method, and the formulas used in pesticide assessment have the same meaning as the reference, and finally the model verification evidence is proven by the DSM result values which are formed with the scikit-fuzzy library which is under the calculation concept in fuzzy logic.
Proving the parity of the DSM results created using the scikit-fuzzy library with the fuzzy logic concept was carried out by manual calculations following the fuzzy logic concept starting with converting the degree of truth value for each membership function, calculating the disjunction and conjunction connection, and end with converting the fuzzy value back to crisp input using the centroid method (result in Table 8). An example of the calculation stage to prove the parity of DSM results will be demonstrated by the abamectin pesticide data in Table 5. Based on the abamectin pesticide data in Table 5, the degree of truth / fuzzy (DoT) value conversion for each membership function was 1 (non-persistent), 1 (high contamination), 1 (high), 1 (high exposure), and 1 (low residue limit) respectively. After converting the DoT (fuzzy value) according to conceptual fuzzy logic, it continued with calculating the conjunction-disjunction connection (Formula 2, Formula 3) and gave a DoT safety result of 1 (not safe). To get the crisp value was obtained using the centroid method and produced a safety level point value for the pesticide abamectin of 2.63 following the DSM results formed with the scikit-fuzzy library, proving that the degree of truth of the verification for the abamectin results was 1.
Calculations to prove the suitability of the centroid calculation results with DSM results were carried out for all pesticide samples and it was found that the DSM algorithm and the fuzzy logic concept algorithm showed the same meaning as proven by verification for all pesticides, which was 1. Respectively the VeTi value for the DSM results was 1.
The result of the simulation tested on DSM for assessing pesticide data had been validated scientifically by research articles that had been conducted. The model of the DSM found that abamectin [49], dimethoate [50, 51], and chlorpyrifos [52] had many issues related to environmental contamination. Even though the pesticides were more effective by usage, because of the persistence and high toxicity component, it raised concern about overcoming toxicity problems caused by highly toxic pesticides.
The validation of the DSM had been done simultaneously when consultation and interviews with experts were conducted. When interviews were conducted, the expert also asked about their opinion about the parameters used in pesticide assessment. The experts agreed with the parameters used and stated above were used correctly and possibly to be used for assessing the parameters. Even though, the experts also stated that the parameters used in this DSM were not one-hundred percent correct the DSM could be improved by adding more detailed parameters for assessment.
The model created in this study can’t be concluded perfectly. The expert and the author agreed that this model can be improved again in the future by adding more parameter indicators and more completed data. This research was completed with 5 parameters for now because of the limitations of research such as time and reference year limits. The five parameters found and used in the model created in this study were used because of the completeness of information found in the articles.
Conclusions
This study has developed a decision support model (DSM) that integrates a fuzzy logic approach to evaluate the safety level of pesticides in agriculture environments. This work provides a new idea for evaluating pesticides and guidance on the safe use of pesticide selection in ensuring environmental sustainability and low impact on environmental health. In structure modeling using a fuzzy logic approach with a combination derived from literature review information and fuzzy rules that emerge from expert knowledge has shown capable of assessing pesticide safeness with validated result. This study successfully filled the gap in pesticide-safe use guidance research and offered a guide model capable of assessing pesticides in general for broad kinds of agriculture. Another improvement of DSM is encouraged with more detailed and specific parameters with detailed data to improve the quality of pesticide assessment in pesticide selection with minimum harm to the environment and support sustainability environmental.