


Introduction
In recent years, humans have experienced increasing exposure to aluminum with potentially relevant consequences for health and disease [1]. Previously, an animal study has evaluated the participation of aluminum in hematologic disorders, mainly anemias [2]. Aluminum affects the nervous, hematopoietic, and skeletal system, thereby causing encephalopathy, anemia, aluminosis, osteomalacia, and osteoporosis, among other adverse health effects [3]. Moreover, in the hematopoietic system, it interferes with iron homeostasis and hinders cellular metabolism [4]. Aluminum also favors the generation of an oxidative environment owing to its ability to create a labile iron pool and interact with membrane lipids of erythrocytes [5]. Aluminum ions can replace iron (Fe3+) and magnesium ion (Mg2+), causing a reduction of the iron ions in ferritin [6]. In addition, the ions released from biological complexes, owing to the effects of aluminum ions, can catalyze hydrogen by decomposing oxides to a hydroxyl radical. The high reactivity to the hydroxyl radical consequently initiates lipid peroxidation [7], leading to a decrease in the fluidity of the erythrocyte membrane by inducing morphological and functional alterations [8].
The interaction between components of plasma membrane is responsible for its elasticity and fluidity. This consequently provides flexibility and deformability to the erythrocyte, which are key characteristics for its structural integrity and shape and is responsible for providing protection from the surrounding environment. This interaction is metabolically active and occurs in the presence of adenosine triphosphate (ATP), among other factors [9]. Al3+ can compete with Mg2+ and interfere with the binding of Mg2+ with ATP (adenosine triphosphate) or GTP (guanosine triphosphate) [10].
There is no single mechanism to explain the systemic effects of aluminum. Some of the effects include cell damage induced by free radicals (aluminum toxicity), alterations in the membrane and biomolecule aggregates, and, as previously mentioned, process of lipid peroxidation in the cell membrane [11].
All the mechanisms by which aluminum can interact with the organism produce alterations or changes, in erythrocyte, leukocyte and/or platelet counts, as well as morphological changes and alterations in hemoglobin, hematocrit, mean corpuscular volume, and mean platelet volume (MPV), among others [11–13]. However, most studies limit their investigations to parameters related to erythrocytes, and do not considerably focus on those related to leukocytes and platelets. On the basis of the abovementioned observation, and with the intention of further exploring the hematological consequences-particularly on erythrocytes, leukocytes, and platelets-of aluminum exposure, we performed the current bioassay in Sprague Dawley (SD) rats exposed to different doses of aluminum trichloride (AlCl3). Although the hematotoxic effects produced by this metal can be determined by routine hematological techniques, such as blood cytometry and differential analysis of blood smears stained with conventional dyes, frontier-based techniques allow for analysis at structural and ultrastructural levels. Such evaluations largely complement the results obtained with conventional techniques, which do not allow the visualization of changes at the cellular level. Scanning electron microscopy (SEM) was used for characterization of morphological and structural integrity, and the ultrastructural integrity analysis was complemented using Raman spectroscopy. This combination of tests helps to acquire information on the chemical structure and composition of the cellular membranes [14]. Currently, exposure to aluminum in its soluble forms has been associated with hematological changes, mainly anemias. Therefore, the present study primarily aimed to evaluate the effects of exposure to aluminum soluble form on the iron kinetic profile and the ultrastructure of erythrocytes, leukocytes, and platelets along with parameters that have not been assessed yet.
Materials and Methods
Bioethical considerations
The study was approved by the Research Ethics Committee of the University of Sonora (CEI-UNISON 10/2018). All procedures were developed in accordance with current official standards for biological testing.
Experimental model
We used 25 female SD rats (body weight, 180–200 g) raised in the vivarium of the Department of Food Research and Postgraduate Studies (DIPA) of the Universidad de Sonora The animals were randomized into groups of five and kept in individual cages, in a mobile rack for subsequent treatment. The rats were kept in 12-hour light/dark cycles at 45%–55% humidity and 24 °C–26 °C, with water and commercial food (LabDiet ® 5001) provided ad libitum. All procedures, including handling and housing, were performed in accordance with national and international regulations [15–17].
Experimental treatments
The experimental treatments consisted of administering increasing doses of AlCl3 (mg Al/kg bw of rats/day) as follows:
Sampling
Peripheral blood was collected in BD Vacutainer® K2 EDTA tubes following the 90-day administration of the experimental treatments. During this procedure, the experimental animals were anesthetized in a halothane chamber and, once the blood sample was obtained, they were euthanized in accordance with the national and international regulations to minimize animal suffering [16,17,20].
Whole blood collected in the K2 EDTA collection tubes was used to determine aluminum content, to perform blood smears for the differential analysis, blood cytometry, and structural and ultrastructural analysis of the blood cells. The serum was aliquoted to evaluate serum iron, total iron binding capacity (TIBC), percent transferrin saturation (%TS), and ferritin levels.
Determination of the kinetic profile of iron in blood serum
Serum iron levels, TIBC, %TS, ferritin levels, blood cytometry, and the differential analysis of the blood smears were assessed at Acuña and Associates Laboratory, SC, Hermosillo, Sonora.
Determination of serum iron
Peripheral blood samples collected from each rat, previously placed in BD Vacutainer® serum tubes with coagulation activator, were centrifuged at 800 g for 10 minutes to obtain the serum. The obtained serum was aliquoted appropriately to measure serum iron levels in a VITROS® DT60 II Chemistry Analyzer [21].
We placed 10 μL of the serum sample on VITROS® iron slides, which consist of a multi-layer colorimetric analytical element coated onto a polyester support, and evenly distributed the samples from the spreading layer to the underlying layers. Iron (Fe3+) is released from the transferrin at an acidic pH and migrates toward the reducing layer, where is reduced by ascorbic acid to its ferrous form (Fe2+). The ferrous ion binds to the dye and forms a colored complex on the reagent layer. After adding the sample, we incubated the slides and measured the reflection density at 630 nm after 1 and 5 minutes. The difference in reflection density is proportional to the concentration of iron in the sample [22].
Determination of TIBC
We used 125 μL aliquots of serum to determine TIBC with the SEAC clinical chemistry photometer at QC Diagnostics [23]. TIBC and iron-chromazurol kits from BioSystem were used. In this technique, serum transferrin was saturated by adding an excess of Fe3+ ions to the sample. Unbound Fe3+ precipitated with magnesium hydroxycarbonate (provided with the TIBC kit). The protein-bound iron in the supernatant was then measured spectrophotometrically at 625 nm using the iron-chromazurol reagent from BioSystem, in which the Fe3+ present in the sample forms a colored complex with chromazurol B and hexadecyltrimethylammonium bromide. The preparation of the reagents and the procedure were performed according to manufacturer instructions [24,25].
Determination of %TS
To calculate %TS, TIBC and serum iron concentrations of the samples were determined and then the %TS was calculated using the following equation [26]:
Determination of ferritin
The peripheral blood collected from each experimental animal, previously placed in BD Vacutainer® serum tubes with coagulation activator, was centrifuged at 800 g for 10 minutes to obtain the serum. The serum was fractioned into 10 μL aliquots for subsequent dilution (1:40) with distilled water, and ferritin was determined by enzyme linked immunosorbent assay with the Abcam ferritin rat (ab157732) kit; the readings were performed in an Eli Read RT-2100C spectrometer [27].
The ferritin present in the samples reacts with the anti-ferritin antibodies adsorbed on the surface of polystyrene microtiter wells. After removing unbound proteins by washing, anti-ferritin antibodies conjugated with horseradish peroxidase were added. These enzyme-labeled antibodies form complexes with the previously bound ferritin. Following another washing step, the amount of enzyme bound to the complex was determined adding a chromogenic substrate, 3,3′,5,5′-tetramethylbenzidine.
The quantity of bound enzyme is directly proportional to the ferritin concentration in the sample tested; therefore, the absorbance value at 450 nm is a measure of the ferritin concentration in the sample. The quantity of ferritin in the sample can be interpolated from the standard curve [28].
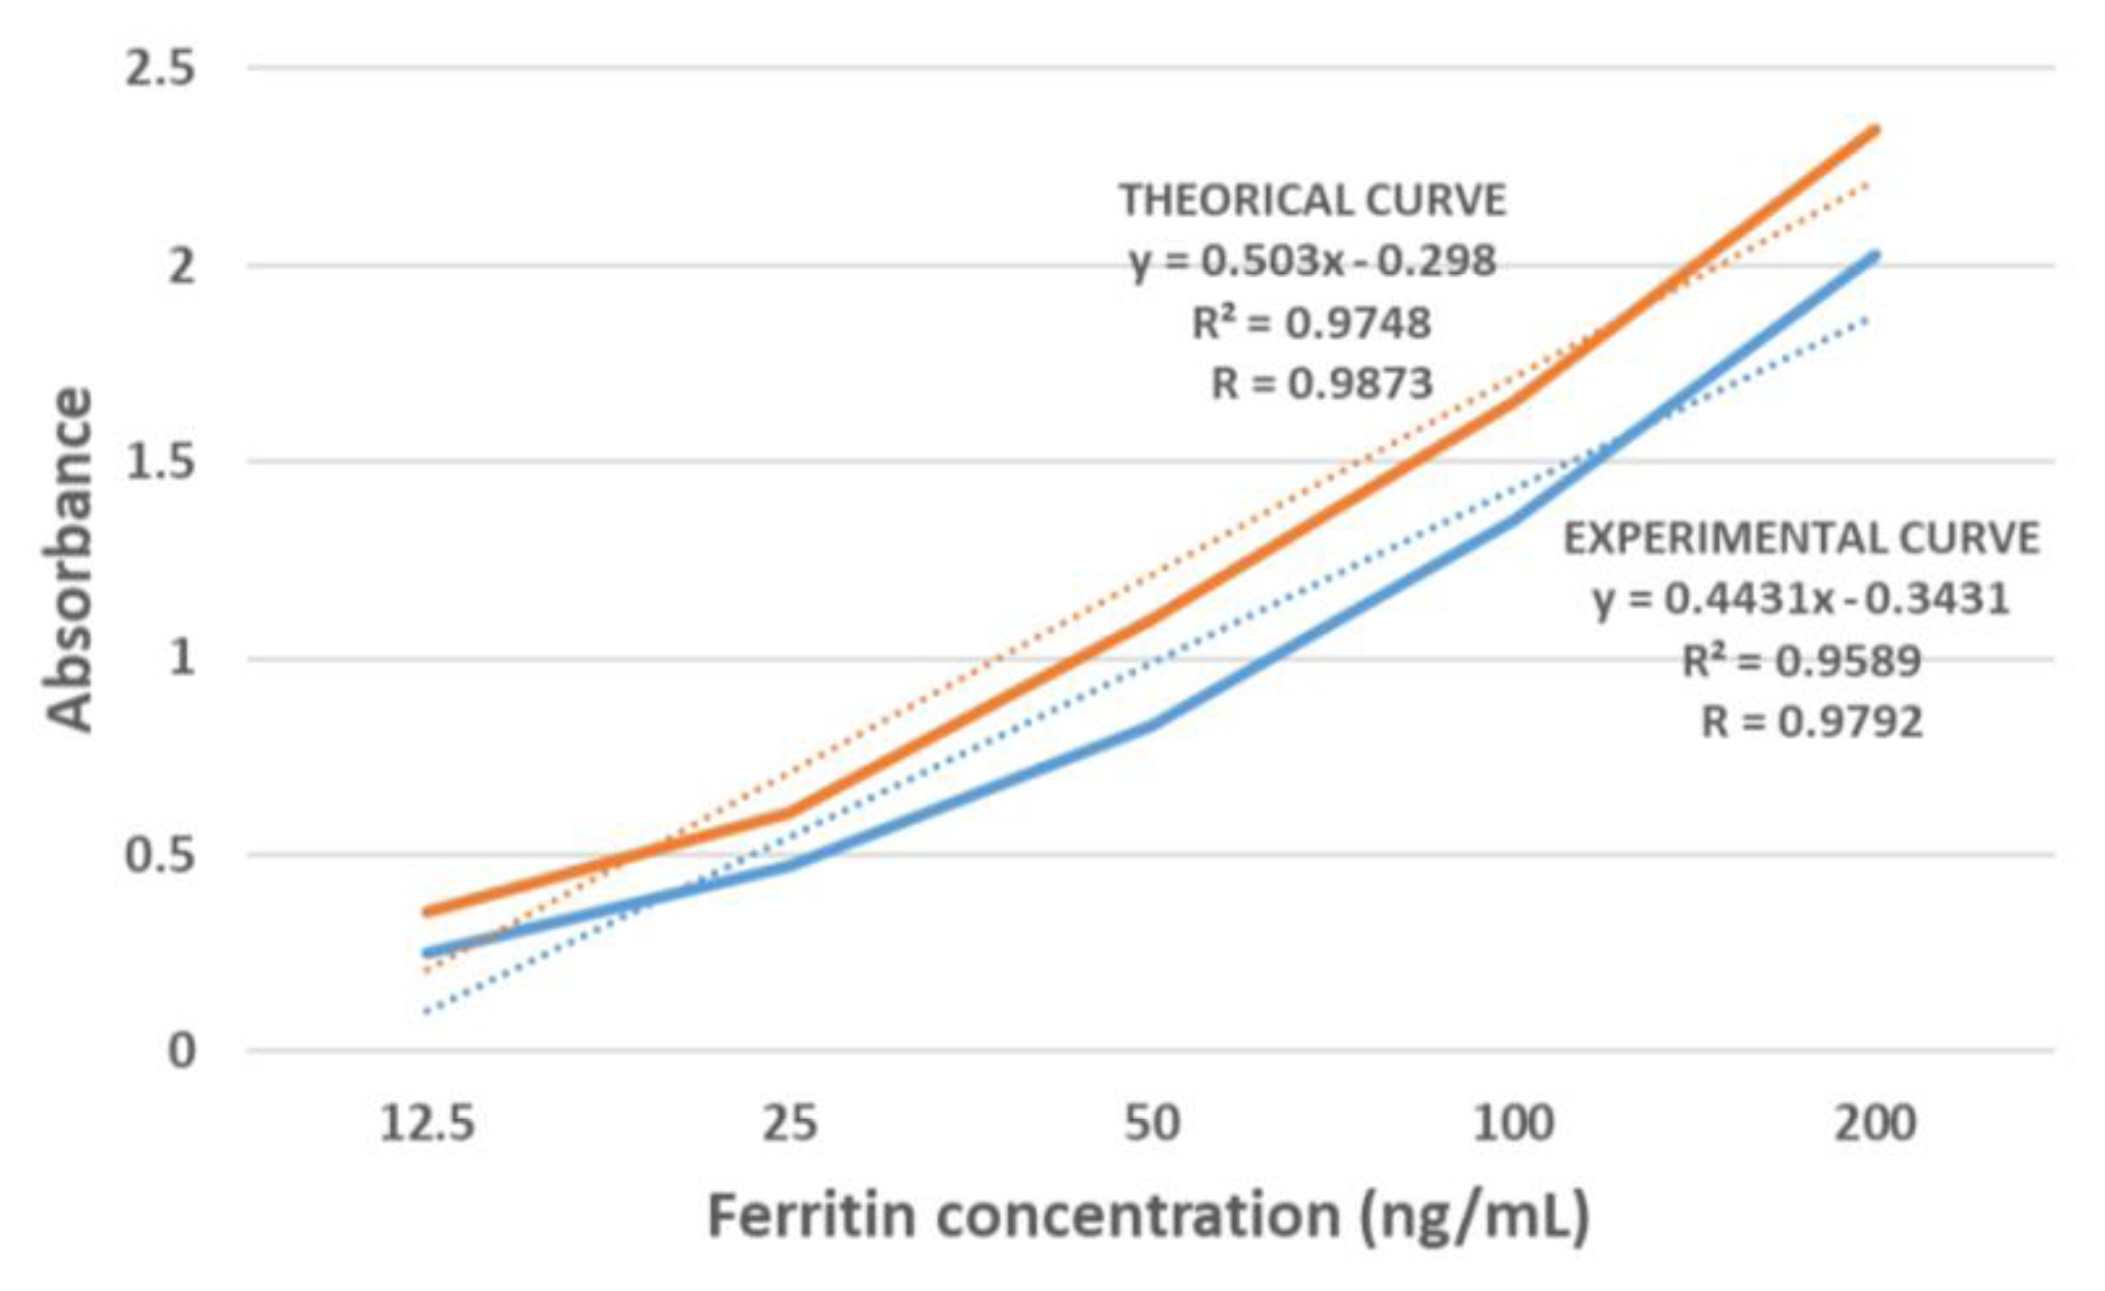
The procedure for verification and validation of ferritin quantification requires a calibration curve with standards for 12.5, 25, 50, 100, and 200 ng/mL of rat ferritin. The ab157732 ferritin rat kit provides a theoretical curve to obtain the correlation coefficient (R) of each curve and then calculate the degree of association between the curves based on the following equation [28]:
Determination of aluminum concentration
The laboratory material used in the determination of aluminum was subjected to sanitary control in accordance with the method recommended by the Mexican Standard NMX-AA-115-SCFI-2015 [29].
The glass equipment-i.e., serological and volumetric pipettes, and Pyrex volumetric flasks-were washed with commercial liquid detergent solution to remove any residue and subsequently subjected to a 20% nitric acid (HNO3) solution (analytical grade 70%, Fermont) for 36 hours. After this time, it was rinsed with deionized water to avoid contamination with trace elements. Finally, the material was dried and stored in clean plastic containers with an airtight lid until further use.
Sample digestion
To perform atomic absorption, the analyte should be placed in acidic aqueous solution for quantification. Therefore, the samples must be previously digested to eliminate any organic components that may interfere in the analysis, taking care that the reagents used do not interfere with the method. The peripheral blood from each rat collected in BD Vacutainer® K2 EDTA tubes and the NIST 1566b standard reference material (MRC) were digested in the MARSX press CEM microwave system of the Metal Contamination Laboratory at the Research Center for Food and Development.
The following blood digestion method was used: 0.4±0.02 g of each blood sample was weighed once and 0.4±0.02 g of the standard reference material was weighed in triplicates and placed in 15×2.5 cm Teflon digestion tubes. Subsequently, 5 mL of concentrated HNO3 (Suprapur Merck) and 2 mL of 30% H2O2 (29%–32% purity, Fermont) were added and the solution was gently homogenized and was let to rest for 30 minutes in the predigestion step.
Subsequently, 5 mL of deionized water was added to each digestion tube in the MARSX press CEM microwave system using the following conditions: ramp to 200 °C for 20 minutes, hold at 200 °C for 15 minutes, and cooled for 30 minutes, all at 35 bar and 1600 watts. The resulting acid extract was diluted to 50 mL with deionized water for subsequent quantification of the aluminum concentration [30,31].
Quantification of aluminum concentration
We determined the aluminum concentration in the standard, standard reference material, and whole blood samples via graphite furnace atomic absorption spectroscopy. This technique has a high sensitivity, with a limit of detection in the range of parts per billion or its equivalent in μg/L, and thus it can be applied to very small sample volumes.
Blood sample analysis
Blood cytometry
Complete blood cytometry was performed in the blood samples obtained from the experimental animals using the Abbott Diagnostics Cell-Dyn-1700 hematology analyzer. The cytometry yielded data on erythrocytes, leukocytes, and platelets, including erythrocyte count, hematocrit quantification, hemoglobin, red cell distribution width (RDW) for the red blood cells; total leukocyte count for the white blood cells; and platelet count and MPV.
Differential blood smear analysis
Blood smears were performed on glass slides. The technique consists of depositing a drop of blood on the edge of a slide, which is extended to the left with the help of another slide, while holding the second slide at the appropriate angle [34]. Once the smears were obtained, they were fixed with 70% methanol and stained with Wright-Giemsa [35]. The slides were analyzed in a Leica DM750 microscope with the 100X objective. During the analysis, erythrocyte and platelet morphology, and leukocyte differentiation were evaluated. Micrographs of the cells were obtained using a Nikon COOLPIx995 camera adapted to the microscope.
Structural analysis of the blood Samples
SEM
For SEM structural analysis of the cells, the blood smears prepared by the slide technique were used. The blood smears were air-dried and then observed under the microscope [36]. The samples were observed in a JEOL JSM-7800F scanning electron microscope under vacuum and micrographs of the blood cells were obtained.
Ultrastructural analysis of the blood samples by Raman spectroscopy
We used air-dried blood smears obtained by slide technique analysis using Raman spectroscopy [37]. A LabRam HR microscope (Horiba) with an Ar+ ion laser (lambda=488) and 50X objective was used to analyze the 700–1800 cm−1 (molecular fingerprint) and 1800–2200 cm−1 regions, specific measurements per cell were obtained with an acquisition time of 300 seconds.
The resulting spectra were exported and analyzed using the Origin Pro program (version 2018); this software was used to average these values, smooth the spectrum, and to adjust the baseline. In addition, the displacements, appearance, and disappearance of bands of the Raman spectrum were studied, as well as intensity variations. SEM and Raman spectroscopy analyses were performed in the postgraduate Nanotechnology Laboratory of the Physics Department of the Universidad de Sonora.
Statistical analysis
Blood cytometry and differential blood smear analysis
The Shapiro-Wilk normality test was used to determine if the blood cytometry data presented Gaussian distribution. [38]. This test was performed on the analyses of samples smaller than 50 [39]. Since the data obtained in the study showed non-normal distribution, the Kruskal–Wallis nonparametric test was performed [40]. p<0.05 indicated statistical significance. All analyses were performed with the IBM SPSS statistics package, version 22.0.
Results and Discussion
Currently, several studies have evaluated hematological parameters in SD rats and the possible effects or hemotoxic risks of exposure to soluble forms of aluminum, mainly aluminum chloride, sulfate, and oxides, at different doses, types of exposure, exposure times, and experimental models, including different sex and age of the experimental animals, among other variables. However, the results obtained are often contradictory [2,41–43].
In this study, in order to assess possible hemotoxic effects of chronic exposure to AlCl3, we evaluated alterations in the kinetic profile of iron, complete blood count, as well as potential morphological changes in erythrocytes, which were contrasted with structural and ultrastructural evaluations using SEM and Raman spectroscopy.
Determination of the kinetic profile of serum iron
The kinetic profile of iron was determined by quantifying serum iron, TIBC, and ferritin, with the corresponding techniques. The %TS was also calculated (Table 1).
Determination of serum iron
There were no significant intergroup differences (p>0.05). This result is consistent with the findings reported by Turgut et al. [44], who administered aluminum sulfate ((Al2SO4)3) to a group of rats and found no significant changes between the groups [44]. Alternatively, our result contrasts with those found by Zhang et al. [45]; they observed, in a 150-day study, that plasma iron decrease between days 60 and 120, but increase at day 150. They stated that this may initially be due to an effect of the aluminum on the iron and that the subsequent increase may be the result of erythrocyte hemolysis caused by alterations in the membrane, thereby resulting in the release of intracellular iron [45].
Determination of TIBC
TIBC is a functional measure of the circulating iron level [46]. Expectedly, no significant difference was found between the groups (p>0.05). This result is in agreement with the findings of Farina et al. [47], which indicated no significant changes in the TIBC as the result of aluminum exposure [47]. This is due to the ability of aluminum to occupy the free iron-binding sites in transferrin [48]. Al3+ does not compete with Fe3+to bind to transferrin; however, since only 30% of the transferrin is saturated by Fe3+, the remaining transferrin sites are available for other metals, such as aluminum [49].
Determination of %TS
%TS gives a measure of plasma iron and iron primary transport protein, transferrin. Transferrin is considered an important biochemical marker of the state of iron in the body [50]. The results did not show significant differences between the groups (p>0.05), which agrees with the results obtained by Turgut et al. [44], which revealed no differences with regard to this parameter [44]. This result could be attributed to the occupation of the free iron-binding sites in transferrin by aluminum, which could have ensured that the transferrin levels remained unchanged [6].
Determination of ferritin
Prior to ferritin quantification, a calibration curve was built using the standards provided in the ab157732 rat ferritin kit. The kit also provided a theoretical curve that served as a base for the construction of the experimental curve (Figure 1). Once the experimental curve was constructed, the correlation coefficient (R)of both curves was obtained. We found a R=0.9873 for the theoretical curve and R=0.9792 for the experimental curve, these values were used to calculate the degree of association between both curves, which was 100.82%.
Table 1 shows that ferritin concentration was significantly different in groups A, B, C, and D with respect to group E, (p<0.05). Moreover, it was observed that ferritin concentration tended to decrease with the increase in aluminum concentration. This indicates that aluminum influences the protein and, therefore, intracellular iron storage. In addition to its role as an iron-storing protein, ferritin is capable of storing other metals, including aluminum [51]. The lower the iron concentration is, the greater is the absorption and accumulation of aluminum in ferritin; concurrently, a decrease in iron is one of the consequences of aluminum exposure [48]. This indicates that ferritin may function as a regulatory protein for metals, which, owing to their concentratio, may be potentially toxic [51].
The interaction of aluminum with ferritin occurs in two phases: the first is characterized by an overload of aluminum onto the ferritin, and a subsequent phase characterized by the release of aluminum into the organs by ferritin due to a possible loss of functionality of the ferritin molecule [51]. This loss of functionality is possibly responsible for the observed decrease in ferritin concentration in the blood with the increase in the concentration of administered aluminum. Ferritin is the protein that reflects the iron reserves of the body [46]; therefore, in conditions of high AlCl3 exposure, the iron reserves of the body will possibly be compromised.
Quantification of aluminum concentration
Table 2 presents the mean aluminum concentration values in μg/L of each treatment group. No significant differences on aluminum concentration (p>0.05) were observed between the experimental treatments. Therefore, aluminum administration does not lead to an apparent accumulation of the element in whole blood. This is consistent with the results obtained by Chahine et al. [52], which state that one of the main activities of aluminum in blood is to be transported through the formation of stable complexes with transferrin [52]. Owing to this property, aluminum can be transported through blood to different organs and tissues such as the brain, lung, liver, kidney, and breasts, among others [53–55].
Blood sample analysis
Blood cytometry
The blood cytometry yielded data on the following parameters: erythrocyte count, hemoglobin concentration, hematocrit, RDW, leukocyte count, platelet count, and MPV. The results are shown in Table 3. No significant differences (p>0.05) were obtained between the experimental treatment groups when compared to previously reported reference values [41,42]. However, these data contradicted previously published results reporting a decrease in the erythrocyte count, hemoglobin concentration and hematocrit [2,41–43]. The decrease in these parameters could be attributable to the interaction of aluminum and iron homeostasis. When aluminum binds to transferrin, the iron remains free, increasing iron intracellular concentration and subsequently causing lipid peroxidation of erythrocytes, which leads to the destruction of these blood cells due to membrane damage [11,56]. However, several authors have pointed out that aluminum is capable of interfering with the production of blood cells, and thus an increase in blood cells is a compensatory mechanism for the damage caused by this metal [41,50]. It is worth pointing out that the changes in the parameters described above were not observed in the present study. In addition, our experimental conditions were different from those used by the mentioned researchers [57,58].
Regarding the leukocyte count, we did not find significant differences and this result contrasts with that previously reported by Sharma et al. [59], who reported an increase in these blood cells, especially, in neutrophils and monocytes due to activation of the immune system in response to a foreign agent [59].
As for the platelets, no significant change in their concentration was observed in the present study. Similar investigations have proposed that the presence of aluminum leads to a reduction and aggregation of these cells [60], owing to the interaction of this metal with zinc, which leads to the inappropriate activation of platelet and thereby resulting in the aforementioned alterations.
Differential blood smear analysis
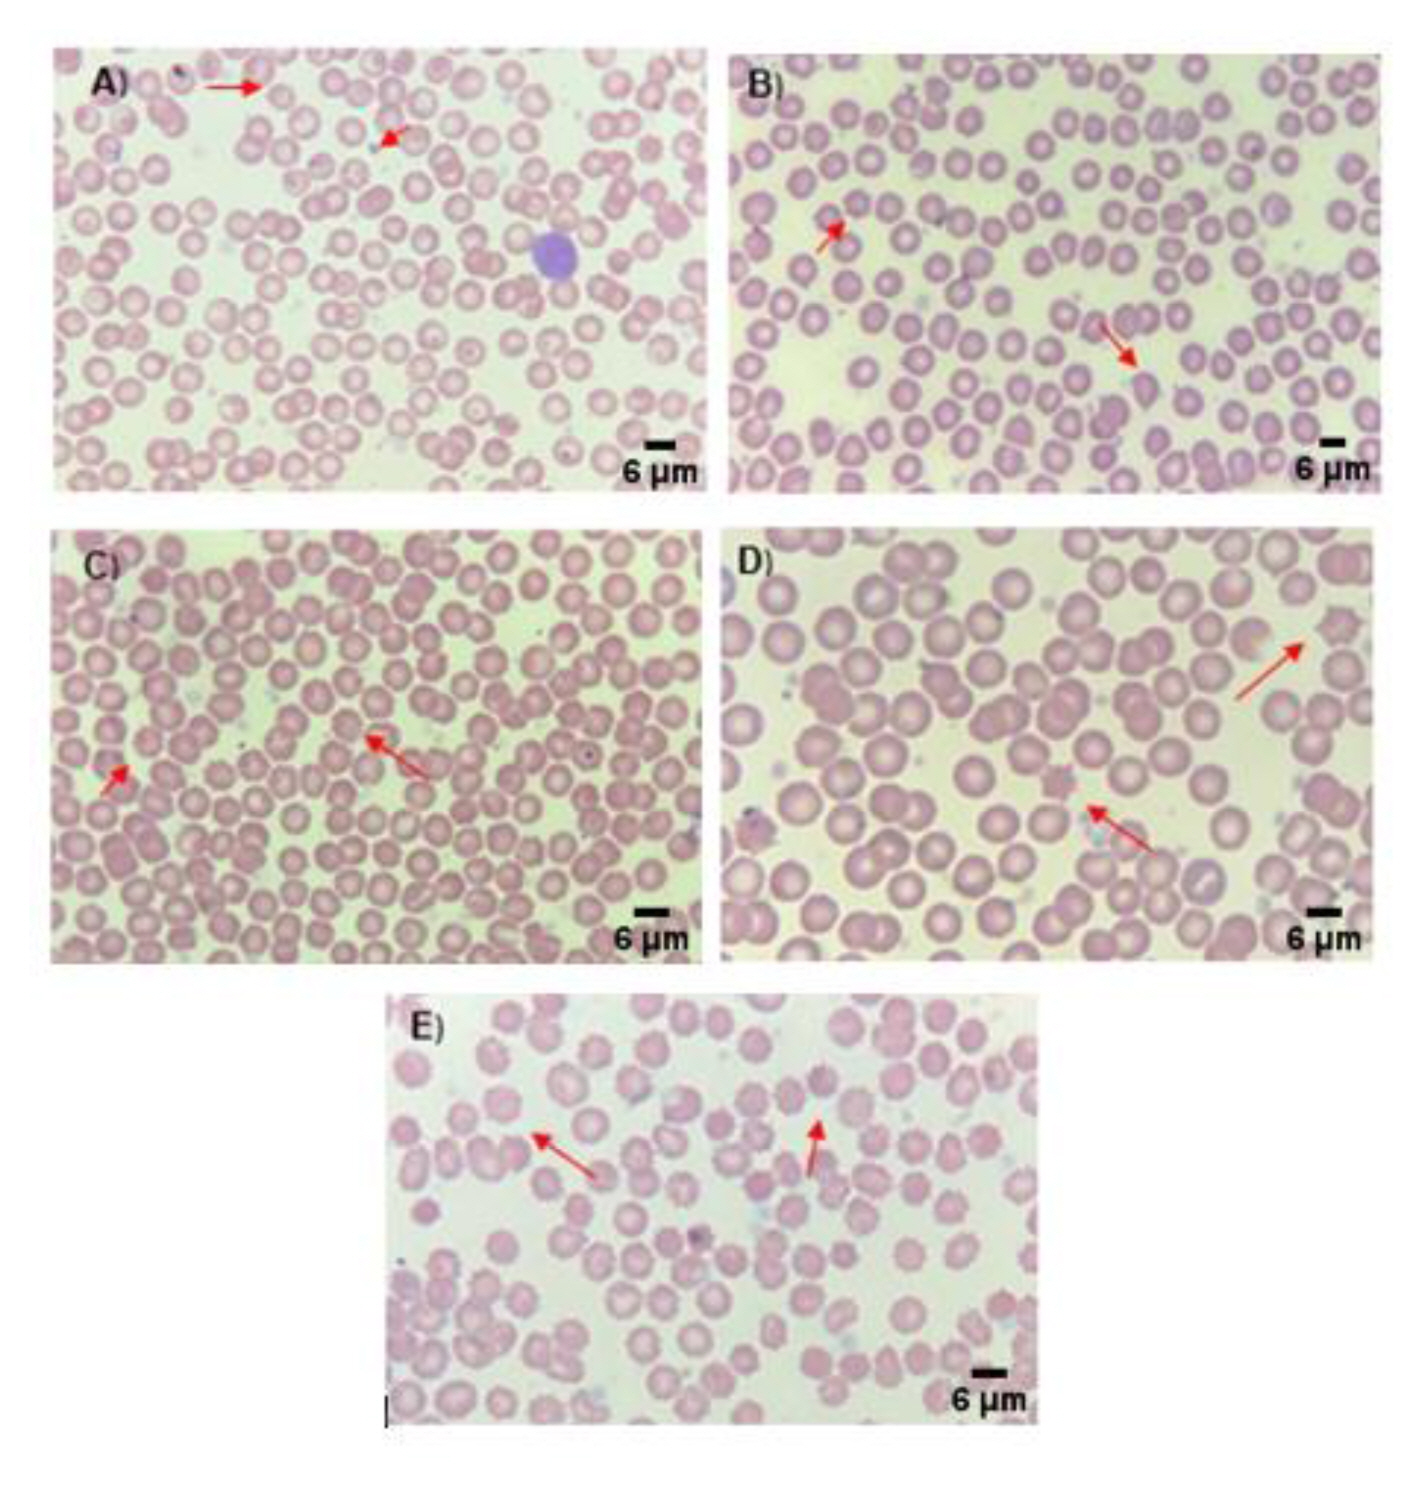
Data analysis of the differential blood smears indicated that there were no significant differences between the groups with p>0.05 (Table 4), with the previously reported reference values [41,42], or the results reported by Kim et al. [61], which did not show significant differences in these hematological parameters when SD rats were treated with aluminum oxide [61]. However, these results differ from those obtained by Sharma et al. [62], which showed an increase in neutrophils and monocytes, and a decrease in lymphocytes. This increase in neutrophils and monocytes reportedly results from the activation of the immune system caused by the detection of aluminum as a foreign agent [62]. Figure 2 shows representative images of the Wright-Giemsa blood smears from the different treatment groups. In these images, no morphological changes were observed in any of the study groups or cell types present in the smears. These results differ from those reported previously, where a high incidence of poikilocytosis was observed in the erythrocytes of the groups treated with aluminum [59,62]. Likewise, Bazzoni et al. [42] observed a predominance of stomatocytes and the study published by Cheng et al. [43] reported the presence of Heinz bodies in erythrocytes.
The slides corresponding to the experimental groups did not show morphological alterations in most of the fields of view. However, changes in erythrocyte morphology were observed in some of the fields of view, in both the slides of the control and the treatment groups (Figure 2). These changes were not related to the administration of aluminum (AlCl3); as reported by Minetti et al. [63] and Choudhary et al. [64] these changes would be considered artifacts [63,64]. In this sense, the correct analysis and interpretation of the blood smears are extremely important for the accurate diagnosis of hematological pathologies and to evaluate cellular changes produced by the administration of a hemotoxic compound [65,66].
As previously mentioned, the so-called artifacts found only in one of the cell types (erythrocytes) in the blood smears of the present study were visible in the 5 experimental groups, including the negative control group; thus indicating that the morphological changes were not the result of the experimental treatments (administration of AlCl3) but could be the result of mechanical damage caused by the smear or the reagents used during staining. The artifacts observed included dacryocytes, crenocytes, and sickle cells, corresponding to morphological changes in the erythrocytes.
A dacryocyte, also known as a teardrop or pear cell, is a mature erythrocyte that retains its central area, losing its round shape and acquiring a drop-like appearance [67]. Its presence in peripheral blood smears is commonly associated with myeloproliferative diseases such as agnogenic myeloid metaplasia. However, it is possible to find dacryocytes as artifacts in blood smears from healthy patients when the smears are not properly performed and, in these cases, when the cells are aligned in the same direction [68].
The crenocyte, also known as echinocyte; is a mature erythrocyte that retains its biconcave shape and its central pallor, showing short spicules distributed throughout its surface [65]. Crenocytes are present in several medical situations, for example, in patients with acute hemolytic anemia, and those who received blood transfusion, among others. These cells can be present as artifacts in peripheral blood smears as a result of a poor blood/anticoagulant ratio, slow drying of the smear, or patient dehydration [34].
A sickle cell is an erythrocyte that appears as an elongated cell with pointed or spiculated ends that resemble a sickle or a crescent [65]. These cells are commonly found in the blood smears of patients with sickle cell anemia (Hb SS).
The finding of the elements described above generates controversy since other studies of this type, where the same animal model, dose, and similar exposure time were used, have reported them as an effect of aluminum on the blood cells and not as artifacts. Nonetheless, the ultrastructural analysis by Raman spectroscopy performed in the current study supports that these elements were artifacts, which is consistent with that reported by other researchers [60–65,68]. This will be further discussed below.
Structural analysis of the blood samples
SEM
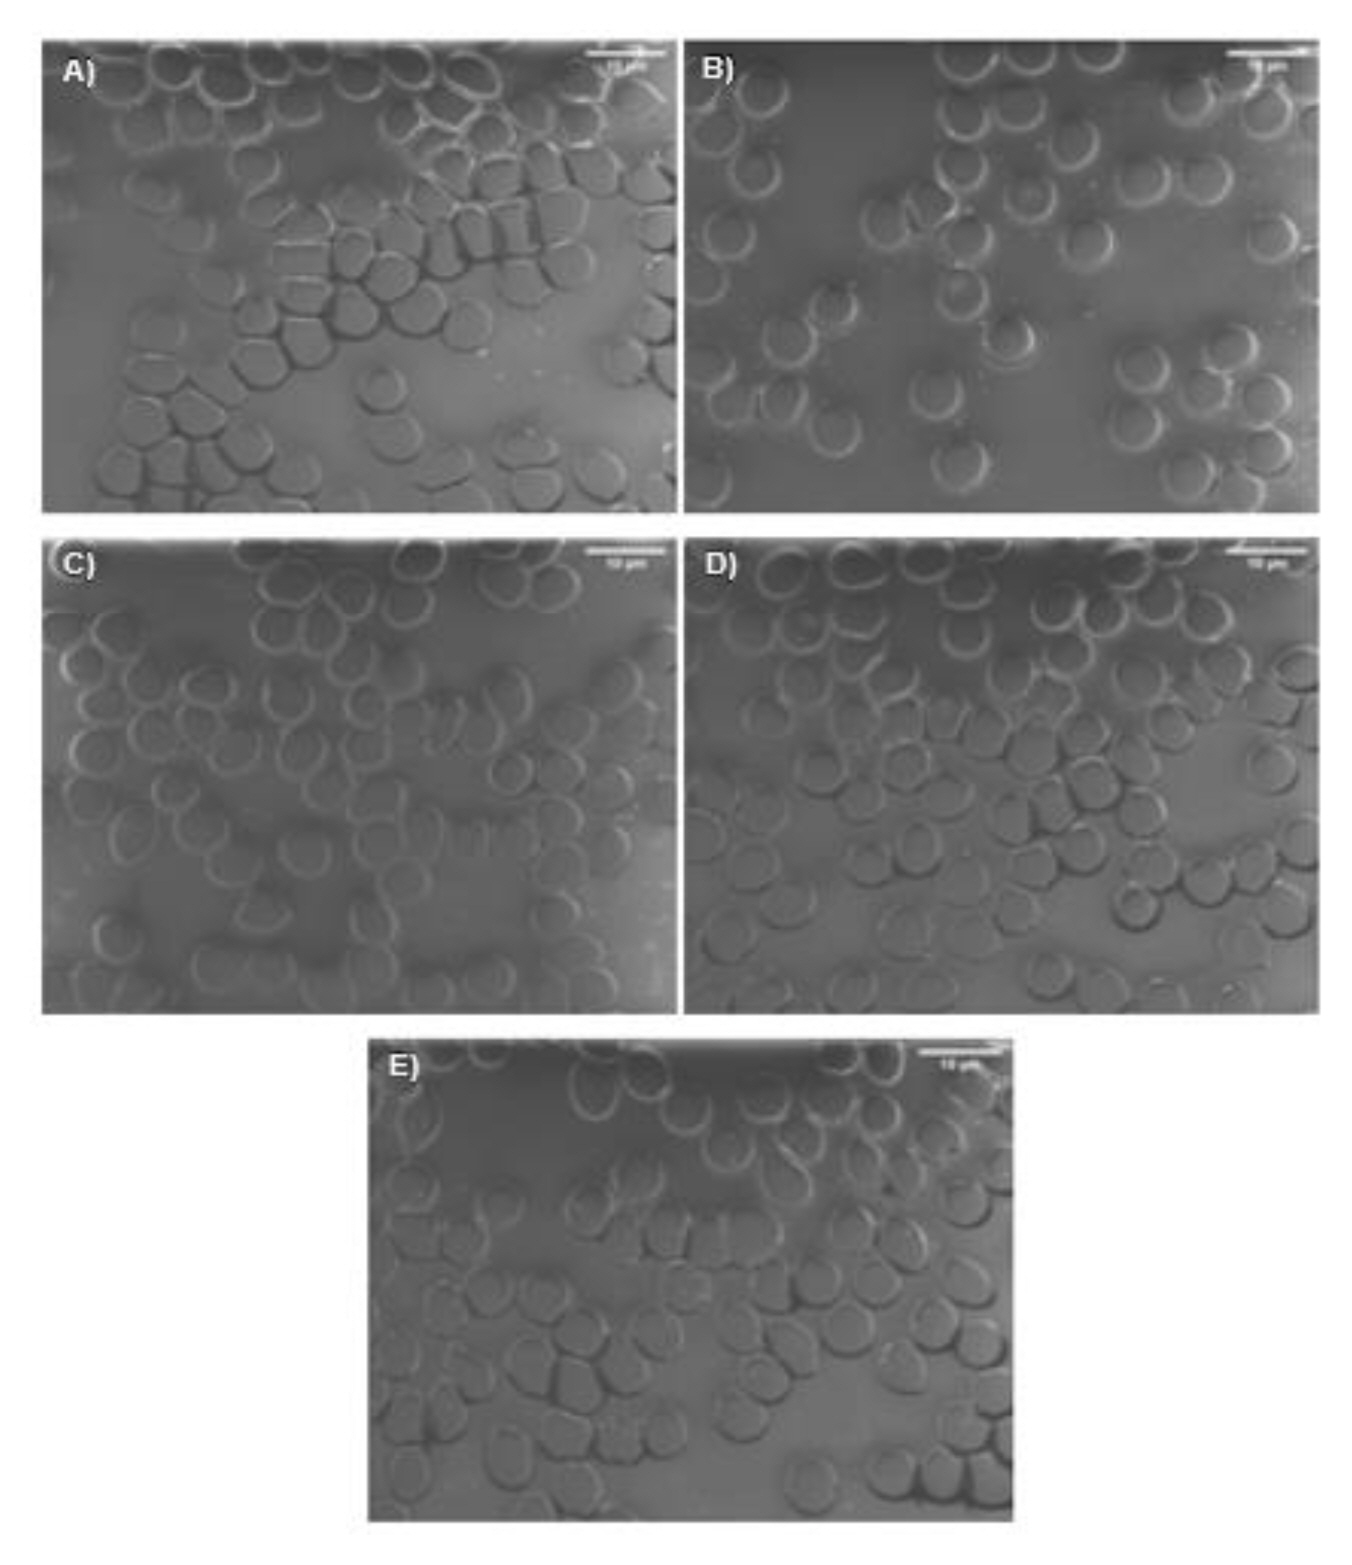
Figure 3 shows representative micrographs for each treatment group obtained in the structural analysis of the blood cells performed by SEM; the morphology of the erythrocytes of the experimental animals can be observed. We found that the majority of the cells did not show any morphological change, indicating that the aluminum administered did not induce changes at the membrane level.
These results are inconsistent with previous findings from similar studies, which show SEM micrographs of erythrocytes with different shapes. In this sense, Vittori et al. [69] reported loss of biconcavity of the erythrocytes, as well as the presence of different erythrocyte shapes, including target cells, stomatocytes, and acanthocytes [69], and reported the presence of different cell sizes. Similarly, the work reported by Cheng et al. [43] reiterates the loss of erythrocyte biconcavity and the presence of erythrocytes in the form of acanthocytes [43].
Notably, despite the fact that the micrographs obtained showed formed elements with no morphological changes, the fields of view were also observed; therefore, the micrographs of altered cells, mainly correspond to crenocytes. These altered cells were observed in the blood smears of the five experimental groups, which suggests that the morphological changes might not be due to the administration of the AlCl3 solutions, but rather to damage induced by the analysis technique.
The morphology observed with this analysis method in conjunction with the morphology observed in the differential blood stained with Wright-Giemsa, disregarding the artifacts found using both analysis techniques, strongly suggest that the aluminum administered under the conditions established in this study does not induce morphological alterations in the peripheral blood cells of experimental rats.
Ultrastructural analysis of the blood samples
Raman spectroscopy
The spectra obtained by Raman spectroscopy of the erythrocytes of the experimental animals are shown in Figure 4. Notably, the analysis was performed by comparing the spectra from the negative control group with those of the experimental groups, with the aim of finding differences between them, such as the appearance or disappearance of bands, band displacement, and changes in band intensity. In addition, we used databases and previously published articles on similar studies containing information on the type of vibration and compound associated with each band present in the spectra of interest.
Initially, comparative analysis of the spectra of the negative control group (group A) and the treatment groups (groups B, C, D, and E) showed no differences between the bands; none of the bands present in the spectra of the treatment groups were displaced or changed in intensity when compared to the control group, nor did bands appear or disappear in the treatment groups. At first, this suggests that the treatments administered did not interfere with the composition of the blood cells studied.
Raman spectra of erythrocytes mainly showed bands corresponding to the vibrational modes of hemoglobin [70] and in some cases it is possible to detect bands corresponding to components of the erythrocyte membrane. The bands associated with rat erythrocytes can be found at 42, 1001, 1123, 1247, 1341, 1368, 1446, 1576, and 1619 cm−1, and derived from compounds such as hemoglobin, albumin, and glucose [71]. These same bands are predominant in the erythrocytes of other animal species such as rats, pigs, dogs, and cats, among others.
Our study identified the following bands: 741, 1123, 1350, 1578, and 1618 cm−1; these are associated with the following vibrational modes and compounds: vibration of the tryptophan ring, asymmetric C-O-C stretching of glucose, C-H curve of tryptophan, C=C stretching of the heme group, and C-N stretching of the heme group, respectively [70–72].
As mentioned above, the comparative analysis of the Raman spectra obtained in this study suggests that the aluminum administered to the experimental animals did not alter the chemical composition of the erythrocyte membranes analyzed, which strongly indicative of the fact that the administration of this metal under our experimental conditions does not cause damage at the ultrastructural level, as affirmed by other researchers [11,73,74]. In addition, the Raman spectra obtained corroborated the fact that the morphological alterations found in the erythrocytes (dacryocytes, crenocytes, and drepanocytes), would be artifacts produced by the processing of the samples, and not an effect of the experimental treatments with AlCl3.
Conclusions
The results on aluminum concentration ranged 12.38–16.24 μg/L, with no significant differences between the experimental treatments (p>0.05). In the kinetic profile for serum iron, ferritin value was 29.81±6.1 ng/mL at a concentration of 40 mg Al/kg bw of rats/day (p<0.05). The blood cytometry parameters analyzed ranged 6.45–7.11×10⁶ cells/μL for erythrocytes, 37.38–41.93 g/dL for hemoglobin, 37.38–41.93% for the hematocrit, 8.91–9.32×10³ cells/μL for leukocytes, and 477.2–736.3×10³ cells/μL for platelets, showing no significant difference (p>0.05) between experimental treatments. The structural analysis of the erythrocytes by SEM showed no differences between experimental treatments, whereas ultrastructural evaluations using Raman spectroscopy identified the following bands: 741, 1123, 1350, 1578, and 1618 cm−1, which were associated with the following vibrational modes and compounds: vibration of the tryptophan ring, asymmetric C-O-C stretching of glucose, C-H curve of tryptophan, C=C stretching of the heme group, and C-N stretching of the heme group, respectively. No significant differences were noted between experimental treatments (p>0.05). Based on the results obtained, it can be concluded that the administration of AlCl3, at the evaluated doses, does not cause changes in the assessed hematological parameters, with the exception of ferritin, whose activity decreased at the AlCl3 dose of 40 mg Al/kg bw of rats/day.