


Introduction
A woman’s ovarian function reserve, which reflects the reduction in the ovarian follicle pool and the quality of oocytes, is called the ovarian reserve, and the lack of this function is called the Diminished Ovarian Reserve (DOR) [1, 2]. The decline in ovarian function becomes more pronounced with increasing age in women, and studies evaluating this phenomenon have utilized various markers such as follicle stimulating hormone (FSH), inhibin B, antral follicle count (AFC), and anti-Müllerian hormone (AMH) [3, 4]. FSH and AMH are widely used as major regulators of follicle development, and AMH is closely related to the ovarian condition.
A decline in the ovarian function in women can greatly impact not only fertility, but also their health, resulting in premature menopause. The known causes of premature menopause, a condition of ovarian function decline and amenorrhea before the age of 40 years, include chromosomal or genetic abnormalities, autoimmune diseases, viral infections, and chemotherapy. However, the cause is only identified in 25% of all cases, and it is believed that smoking, drinking, stress, and increased exposure to environmental pollutants are associated with premature menopause [5, 6]. Among these, environmental pollutants that can be commonly encountered in daily life are being studied as one of the contributing causes of premature menopause. For example, personal care products and sanitary products mostly used by women contain endocrine-disrupting chemicals (EDCs), such as phthalate, bisphenol A (BPA), and volatile organic compounds (VOCs), which have been suggested to have a significant influence on the reproductive function [7–9].
Karwacka et al. (2019) summarized the relationship between EDCs and markers used for the evaluation of ovarian function in various previous prospective cohort studies [10]. These studies confirmed that a decline in the AFC, estradiol levels, oocyte quality, and embryo quality was linked to exposure to high levels of BPA and phthalate. In another study, the DOR group, defined as those having an AMH level < 25% showed a significant increase in BPA exposure when compared to the non-DOR group [11]. However, most of these studies evaluated the relationships between ovarian function (by measuring hormone levels) and level of exposure to environmental pollutants only by cross-sectional studies. In addition, these studies only targeted infertile women or women in menopausal transition; thus, studies evaluating the impact of exposure to pollutants on the rate of decline in ovarian function in women within the reproductive stage are insufficient.
Rosen et al. (2012) confirmed the relationships between five types of ovarian reserve markers and age in a study targeting a large group of women aged 25–45 years and identified the patterns between each marker and age, which could not be explained by age alone [12]. In particular, AFC and AMH, markers that most closely reflected the reduction of oocytes in the study, showed that over 70% of the results could not be explained by age while considering the coefficient of determination (R2, 27.34 and 22.65%, respectively). Based on these results, we aimed to evaluate the linear relationship between age and markers of ovarian function in women with intervening exposure to environmental pollutants to determine the impact of environmental exposure on the rate of decline in ovarian function with age.
Materials and Methods
Study subjects
A questionnaire was distributed through an online announcement, and participants between the ages of 26 and 40 years were recruited. All participants were healthy subjects who have no reproductive disease including menopause. The questionnaire related to female reproduction included menarche age, menstrual cycle, and questions related to environmental exposure included smoking and drinking status as well as lifestyle. Subsequently, the participants visited Korea University Anam Hospital, and all voluntarily consented verbally and in writing to participate in the study after being informed about the study.
Blood and urine collection
Blood and urine samples were collected when the participants visited the hospital. The blood sample was transferred to GC Pharma (Gyeonggi-do, Republic of Korea), a specialized analysis institution, by the hospital diagnostic laboratory and analyzed for FSH and AMH using the electrochemiluminescence immunoassay method. In addition, the FSH/AMH ratio was calculated using the values of the two hormones. The urine samples were transferred to sterile tubes and stored in a −70 °C freezer after centrifugation, and then transferred to Smartive Corporation (Seoul, Republic of Korea) for the analysis of 16 environmental pollutants. Phthalate metabolites (mono(2-ethyl-5-hydroxyhexyl) phthalate [MEHHP], mono(2-ethyl-5-oxohexyl) phthalate [MEOHP]), environmental phenols (bisphenol A [BPA], methyl paraben [MP], ethyl paraben [EP], propyl paraben [PP] and 2,4-dichlorophenoxyacetic acid [2,4-DCP]), volatile organic compounds (VOCs: trans, trans-muconic acid [tt-MA], N-Acetyl-S-(benzyl)-L-cysteine [BMA], phenylglyoxylic acid [PGA] and mandelic acid [MA], 2,3,4-methylhippuric acid [MHA], hippuric acid [HA]) were analyzed using high-performance liquid chromatography-triple tandem mass detector (HPLC-MS/MS, 6410B, Agilent, Santa Clara, CA), and polycyclic aromatic hydrocarbons (PAHs; 1-hydroxypyrene and 2-hydroxynaphthalene) and cotinine (COT) were analyzed using gas chromatograph-mass spectrometer (GC-MS, Clarus 680T, PerkinElmer, Waltham, MA). An additional creatinine analysis was performed to normalize the concentrations of metabolites in urine. Environmental pollutant values less than the limit of detection (LOD) were set to LOD/2.
Statistical analysis
IBM SPSS Statistics Version 21 and R Version 3.6.2 were used for statistical analysis. The participants were divided into two groups: low- or high-level groups based on whether they had below or above the median level of exposure respectively of each of the 16 environmental pollutants. All environmental pollutants, and the values of FSH, AMH, and FSH/AMH ratio had a right-skewed individual distribution; thus, they were converted into natural log (ln) values for subsequent analysis. Correlation analysis was performed for age, FSH level, AMH level, FSH/AMH ratio, and environmental pollutants. Linear regression and multivariate linear regression analyses were performed between age and FSH level, AMH level, and the FSH/AMH ratio with other variables, including environmental pollutants. In addition, to compare the hormonal changes between the low- and high-level exposure groups, linear regression analysis was performed per group, and the difference in the slope change was confirmed through the following formula:
Results
Of the total of 107 women who agreed to participate in the study, 9 were excluded owing to omission of the questionnaire data, insufficient blood and urine samples, and outlier data; a total of 98 participants were confirmed. The general characteristics of the participants are presented in Table 1.
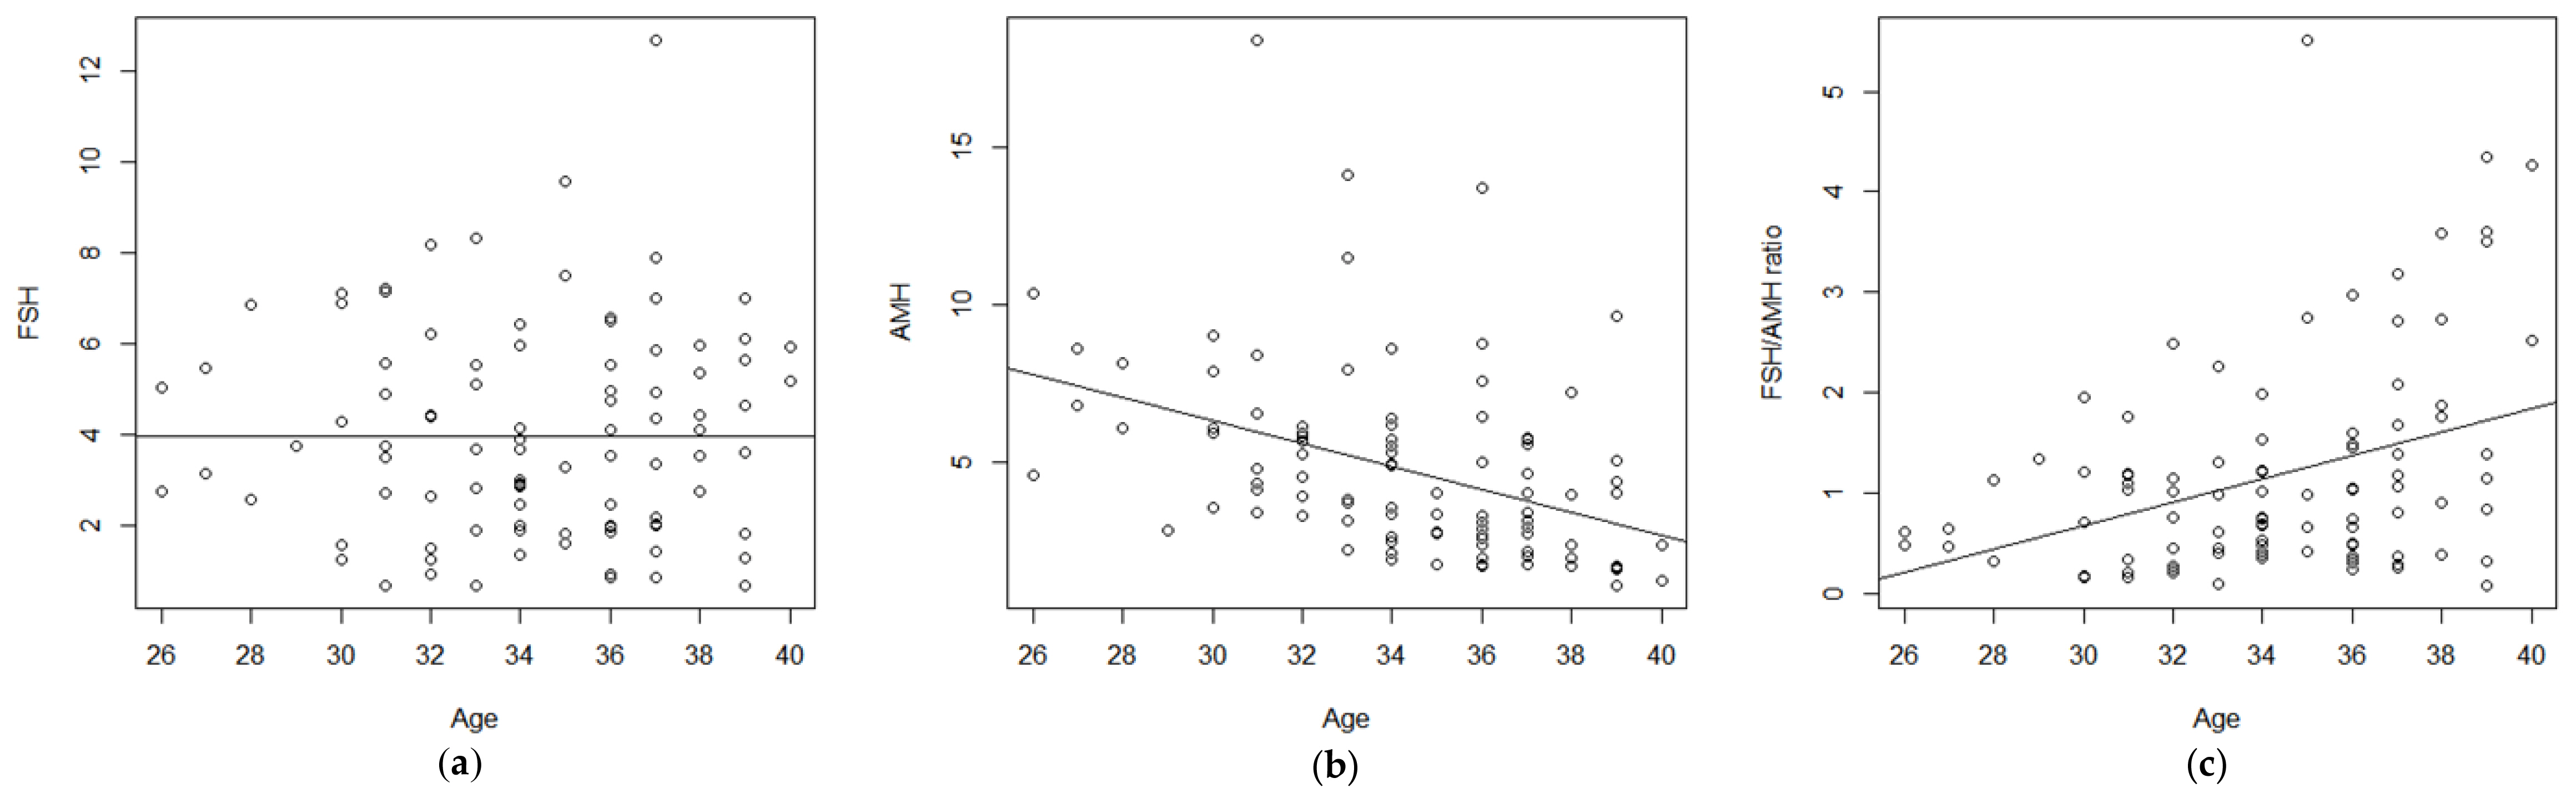
Linear regression analysis was performed to evaluate changes in the hormonal levels according to age, which confirmed that the AMH level decreased by 0.37 ng/mL (p=0.001) with increasing age, whereas no relationship was observed between FSH and age. The FSH/AMH ratio increased by 0.12 (p=0.001) with increasing age (Figure 1).
Exposure levels to 16 environmental pollutants were identified in the participants’ urine samples. To determine the relationship between age and hormone levels according to exposure levels, the low and high exposure groups were established by setting the exposure level at the median value. The results of the Mann–Whitney U test performed to confirm the exposure difference between the two groups showed a statistically significant difference (p=0.000) for all substances. But, no differences in age or body mass index (BMI) were observed between the two groups (data not shown). Among FSH, AMH, and FSH/AMH ratio values between the two groups, no difference was observed for FSH; for AMH, a statistically significant difference was observed in 2,4-DCP, BMA, and HA (p=0.027, 0.013, and 0.043, respectively); for FSH/AMH, a statistically significant difference (p=0.033) was confirmed only for HA (Table 2).
To confirm the correlation between environmental pollutants, hormones, and age, Pearson correlation analysis was performed for each exposure group. For the high exposure group, positive significant correlations were confirmed between age and tt-MA or MA; FSH and BPA or BMA; and FSH/AMH ratio and BPA or MA. A negative correlation was confirmed between the AMH and MA. In the low-exposure group, only 2,4-DCP and 1-OHP were positively correlated with age, and BMA had a negative correlation with age. Overall, positive correlations were confirmed between FSH and BPA or tt-MA; the FSH/AMH ratio and BPA, or 2,4-DCP, tt-MA, and BMA; and a negative correlation was confirmed between AMH and 2,4-DCP. No correlation with age was observed for any of the 16 environmental pollutants (data not shown).
Multivariate regression analysis using 16 environmental pollutants, menarche age, smoking and drinking status, age, and BMI was performed to identify the factors influencing each hormone. The results showed that the AMH level decreased with increasing age and 2,4-DCP level (p=0.000, R2=45.4%); and the FSH/AMH ratio increased with increasing age and BMA exposure (p=0.002, R2=41.7%). For FSH, drinking more than one cup of alcohol a week and higher exposure to tt-MA resulted in an increase in the FSH level (R2=31.2%), although it was not statistically significant (Table 3).
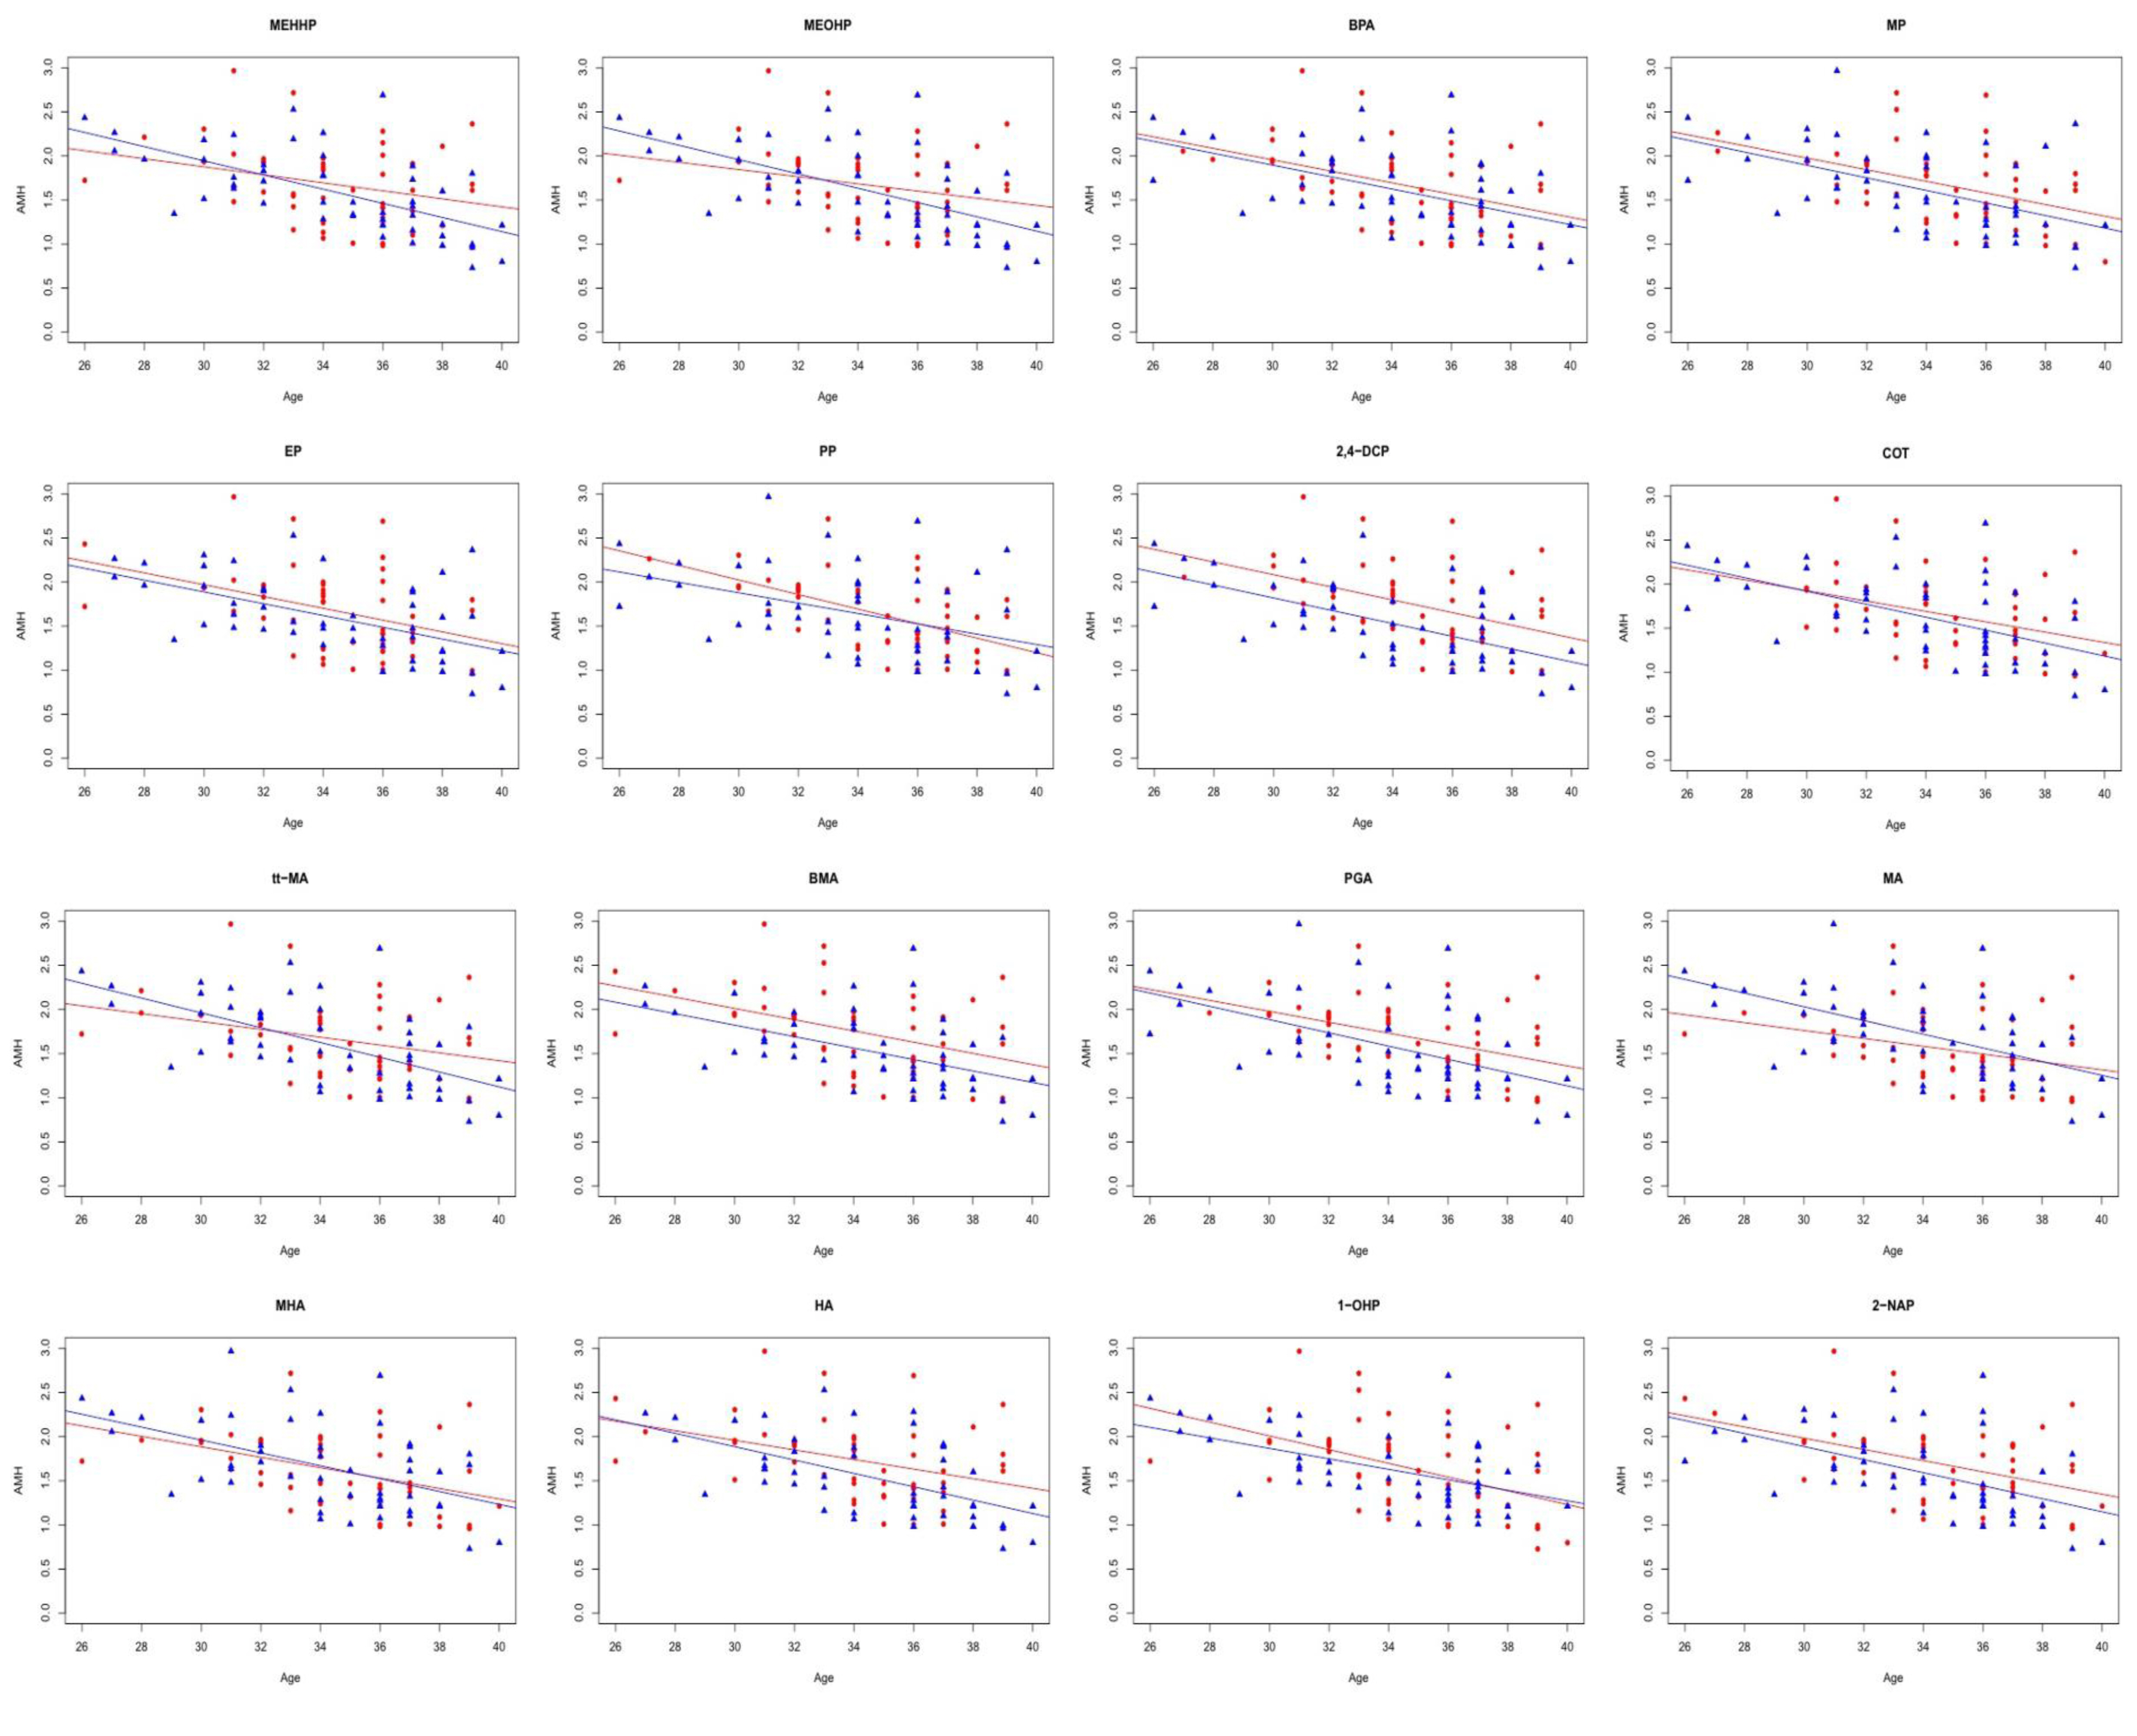
Evaluation of the change in the rate of AMH level and FSH/AMH ratio according to age per exposure group showed that the high exposure group of some pollutants had a higher decreasing rate of AMH and an increasing rate of FSH/AMH ratio with age (Figures 2, 3). However, there was no statistically significant difference in the rate of AMH change with age between the high- and low-exposure groups for MEHHP, MEOHP, PP, COT, tt-MA, MA, MHA, HA, 1-OHP, and NAP (Figure 2). The FSH/AMH ratio according to age was higher in the group exposed to high levels of MEHHP, MEOHP, BPA, COT, tt-MA, MA, HA, and 2-NAP than in the group exposed to low levels by 4.0-, 3.2-, 2.2-, 2.1-, 5.2-, 3.0-, 2.0, and 3.7 times, respectively. In addition, a statistically significant difference in the rate of increase (p< 0.05) was observed between the two groups for tt-MA and 2-NAP (Figure 3). In the case of AMH which showed a decreasing pattern, the rate of change according to age in the group exposed to high levels of MEHHP, MEOHP, tt-MA, and MA were 1.8-, 2.0-, 1.9, and 1.7 times higher than the group exposed to low levels of the same pollutant (Figure 2).
Discussion
Experimental animal models and epidemiological studies have accumulated data on the relationship between environmental pollutants, such as EDCs, and decline in ovarian function, providing an increasing amount of evidence that environmental pollutants can be detrimental to women’s reproductive health by causing premature menopause and premature ovarian failure [6, 10, 13]. However, most of these studies have limitations; for example, the studies focused on women who visited infertility centers or were designed as cross-sectional studies to compare the environmental pollutant exposure levels between cases and controls without considering the rate of change in the ovarian function by environmental pollutants. Although age is the most important variable in women’s reproductive health, studies on the relationship between environmental pollutants and the rate of decline in ovarian function with age are lacking. Therefore, the present study divided environmental pollutant exposure levels into two groups and calculated the rate of change in markers of ovarian function according to age in each group to determine the effect of environmental pollutant exposure levels.
The widely used hormones FSH and AMH were measured as markers of ovarian function decline, and the FSH/AMH ratio was established based on the ratio of the two hormones. The average FSH level in the participants was 3.97 mIU/mL and the relationship with age could not be confirmed. This result is in line with previous studies that showed no correlation between the FSH levels and age from 40 to 42.97 years [1, 14, 15]. For AMH, the average value was 4.73 ng/mL, which decreased by 0.365 ng/mL with increasing age. This result is higher than the values in the two studies performed on Korean women that identified average AMH values of 3.6 ng/mL and 3.54 ng/mL and decrease by 0.26 ng/mL and 0.232 ng/mL, respectively, with increasing age [16, 17]. However, the results of the present study were close to those of a study based on 1,009 Chinese women aged 26–44 years with an average AMH value of 4.18 ng/mL and a decrease of 0.38 ng/mL with increasing age [4].
Several studies have confirmed intracycle variation in the presence of high levels of AMH [18, 19], and the most severe ovarian outcome (e.g., in vitro fertilization success rate) in the case of an imbalance between FSH and AMH [20, 21]. Accordingly, the FSH/AMH ratio has been suggested as a new indicator, and a strong negative correlation with pre-antral, antral, and total follicle counts has been confirmed [22]. Therefore, the present study divided the FSH value by the AMH value to establish the FSH/AMH ratio value, with an average value of 1.18 and an increase in increments of 0.116 was observed with increasing age.
Grindler et al. (2005) utilized data from the National Health and Nutrition Examination Survey (NHANES) of the United States to classify EDCs that disrupt sex hormone function and influence female reproductive function into estrogen, dioxin, phthalate, aromatic hydrocarbons (polyaromatic hydrocarbons), pesticides, polychlorinated biphenyls (PCB), and phenols [23]. Most of these substances are not only widely used in food packaging, medical devices, cosmetics, and personal care products, but can also be easily absorbed into the human body orally or through inhalation from daily life pollutants, such as car exhaust gas, cigarette smoke, and gas from cooking processes through orally or inhalation [24, 25].
In the case of phthalate, a study on the relationship between phthalate metabolites and markers of ovarian function decline in women who visited infertility treatment centers confirmed a negative association between the AFC and inhibin B, but a relationship with AMH was not observed [26, 27]. However, in this study, among phthalate metabolites, MEHHP and MEOHP were measured, an evaluation of rate of AMH hormonal change according to age showed 1.8–2.0 times faster in high exposure group than low group. In particular, for the FSH/AMH ratio, MEHHP and MEOHP in the high-level group changed four- and three-fold faster, respectively. These results suggest that it is necessary to confirm the association between phthalate exposure and hormonal changes in larger populations.
The negative effect of BPA on the decline in ovarian function has been confirmed in experimental animal models [28], and a study on the negative association between BPA, AFC, and FSH in 127 women [29]. In this study, a positive correlation (p<0.05) was also confirmed between BPA and FSH, and FSH/AMH ratios in all groups and the high-exposure group. Evaluation of the rate of hormonal change according to age per group showed a similar decreasing trend in each group for AMH. For the FSH/AMH ratio, a difference of nearly two times was confirmed, but neither of the data was statistically significant.
For PAHs, many studies regarding smoking status have been performed, and a cross-sectional study comparing smokers and non-smokers showed lower serum AMH levels (3.86 ± 1.92 versus 3.06 ± 1.68 μg/L) [30]. In this study, among PAH metabolites, 1-OHP and 2-NAP were measured, and the correlation between exposure level by group and age, FSH level, AMH level, and FSH/AMH ratio was evaluated. The results showed a positive correlation between 1-OHP and age in the low-level group (p<0.05). In addition, results from the evaluation of hormonal change rate according to age per group showed that the FSH/AMH ratio changed 3.7 times (p<0.05) faster in the 2-NAP high-level group. However, for AMH, both 1-OHP and 2-NAP showed a decreasing trend, although no difference was observed between the two groups.
For VOCs, studies confirming a direct relationship between the markers of ovarian function decline are lacking. A study by Alviggi et al. (2014), confirmed that basal FSH levels were high in the group with high levels of benzene, VOC, and well-known air pollutants in follicular fluid [31]. Similarly, among the six VOC metabolites confirmed in this study, tt-MA, the most useful index to evaluate benzene exposure, showed a positive correlation (p<0.05) with the FSH level and FSH/AMH ratios. Evaluation of the rate of hormonal change showed that the FSH/AMH ratio changed 5.2 times (p<0.05) faster; for AMH, although the change was close to two times, and the results were not statistically significant. These data indicate an important relationship between VOCs and ovarian function decline, which is under-researched and requires further study.
This study suggested a significant impact of environmental pollutants on the decrease in AMH or FSH/AMH ratio with age. However, the limitation of the present study was that it was a cross-sectional study; thus, it was difficult to clearly determine the cause and effect according to a temporal relationship. In particular, it was difficult to further identify the exposure period and metabolic pathway of each environmental pollutant. In addition, the sample size of the study was small (98 women), and there is a possibility of bias, as the questionnaire results were based on each of the participants’ individual memories.
Conclusions
This study was conducted to investigate the relationship between exposure of environmental pollutants and reproductive hormones of normal women at their reproductive stage with no disease history such as premature menopause. Exposure levels were identified by 16 types of pollutants in urine. The results showed hormonal pattern changes similar to those observed in large-scale studies. We also confirmed that higher tt-MA and 2-NAP exposure levels resulted in a statistically significant increase in the rate of change of the FSH/AMH ratio according to age per group. To measure the low-level exposure of benzene, tt-MA is used as a biomarker. The main source of benzene is smoking and oil vapors from synthetic compounds used for automobile or home appliances. 2-NAP, a metabolite of naphthalene, is exposed through smoking, automobile exhaust, and indoor and outdoor air pollution. Both pollutants are highly volatile and are mostly into the human body through the respiratory tract from products that are closely used in everyday life. Based on these results, additional studies conducted on larger population groups are necessary to evaluate the effects of environmental pollutants on ovarian function.