


Introduction
Aspergillus flavus is worldwide distribution and probably produce numerous airborne conidia which easily disperse by insects and air movements. In a variety of livestock and agricultural products, aflatoxin B1 are commonly produced by Aspergillus flavus. Aspergillus flavus can be able to grow at optimum temperature of 37 °C and the growth can be observed at temperature ranging from 12–48 °C with water activity (aw) between 0.86 and 0.96 [1]. Aflatoxins are mainly produced by Aspergillus flavus and Aspergillus parasiticus, which are especially found in areas with hot and humid climates; and hence frequent contaminants of agricultural products from tropical countries [2]. Contamination caused by species of Penicillium also occur under unsuitable storage conditions, where water activity (aw) drops slightly below 0.95, promoting the growth of xerophilic species [3]. Several mould fungi are capable of contaminating various foods and feeds by toxic secondary metabolites, which have adverse effects on human and animal consumers following consumption of these contaminated food or animal feed [4].
Toxigenic fungi like Aspergillus flavus produce aflatoxins which are responsible for feed contamination. It may cause detrimental and damaging effects on human, livestock, and poultry [5]. Aflatoxins have been associated with quality degradation of many agricultural products which cause considerable changes in texture, flavor, and color. There are 18 different types of toxins in the aflatoxin group identified. Among these aflatoxins, B1, B2, G1, G2, M1 and M2 are the major types [6]. Aflatoxin B1, B2, G1, G2 are classified as group I human carcinogens and type M1, is as toxic as type B1 which is listed as a group 2B carcinogen [7]. AFB1 is the most prevalent and toxic of the aflatoxin, with acute toxicity demonstrated in all species of animals, birds and fish tested resulting in LD50 values in the range 0.3–9.0 mg/kg body weight. AFB1 is also known to be one of the most potent genotoxic agents and hepatocarcinogens identified. Several naturally occurring dietary aflatoxins have been reported but the most prevalent and hazardous is AFB1 [8]. There are two general forms of the disease caused by exposure to aflatoxin, aflatoxicosis. Acute aflatoxicosis results in death whereas chronic aflatoxicosis cause cancer, with the liver as the primary target organ, immune suppression, teratogenicity, and other symptoms [9].
Aflatoxin contamination associated with food or feed is a global problem especially in the tropical and subtropical regions of the world. The warm and humid climate is one of the predisposing factors which enhance the growth of fungi and mycotoxins in feed [10]. The tropical conditions in Karnataka such as high temperature and moisture, monsoon, seasonal rains and flash floods leads to fungal proliferation and mycotoxin production. Also improper storage, less than optimal conditions during transport and marketing of animal feed can also contribute to fungal growth and mycotoxin production. The study was carried out from Nagavara (NG), Mandya (MY), Malavalli (ML) and Chikkaballapur (CH) from Karnataka, India to screen and determine the contamination of Aspergillus flavus from animal feed. A total of (n=29) animal feed samples were analyzed by isolating fungi. The isolates were initially screened through colony morphology and microscopic examination. Out of isolates screened, Aspergillus flavus and Aspergillus niger was found to be in 86.2 and 24.1%.
Aflatoxin was detected in 12 samples with 2 samples exceeding the limit set by FDA. This study therefore confirmed aflatoxin production from the samples and the toxigenic potential analyzed by qualitative (ammonia vapor test) and quantitative (TLC & ELISA) methods.
Materials and Methods
Sample collection and study area
Various animal feed samples including poultry feeds, cattle feeds were collected randomly from animal feed venders and farms in and around Bangalore, Mandya, and Chikkaballapur in Karnataka. The spatial and temporal characteristics of the samples collected were as follows viz., Nagavara (13°02′53.4′N 77°36′29.8″E), Mandya (12°43′07.3″N 76°56′26.9″E), Malavalli (12°38′30.03″N 77°06′18.40″E) and Chikkaballapur (13°43′52.4″N 77°73′41.0″E). The samples were collected during the first week of December and the average temperature was recorded as 20 – 21 °C. The samples were collected in sterile polythene bags and transported to the lab. Overall, 29 feed samples were collected and coded according to the following nomenclature. Code name AFS (Animal Feed Samples) followed by the number of samples collected i.e., AFS1, AFS2 etc. (Table 1). For the easy identification the samples code is denoted with 2 letter prefix that indicate the place where samples were collected.
Isolation and identification of fungi from animal feed samples
The collected samples were crushed using a sterile mortar and pestle and approximately about 0.2–0.5 g of crushed sample was directly sprinkled on the potato dextrose agar (PDA) medium and incubated at 28 ± 2 °C for 3 days [11]. Aspergillus flavus isolates were identified based on microscopic and macroscopic characteristics and transferred on to agar slant. The stock culture of the isolates was maintained by transferring them on PDA plates and single colonies were picked up and transferred to culture plate for further study. These isolates were coded as indicated in (Table 1). The percentage of frequency of occurrence and relative density of fungal species were calculated [12].
Screening of isolates for aflatoxin production
The pure isolates obtained from the animal feed were screened for aflatoxigenicity on the desiccated coconut agar [13]. Each isolate was inoculated on freshly prepared desiccated coconut agar and incubated at room temperature for 7 days. Isolates that absorbed and emits very bright, moderate and weak UV light (fluorescence) at 365nm were considered to be capable of producing aflatoxin.
Characterization of aflatoxin
Liquid ammonia vapor test
The isolates of A. flavus were cultured on PDA and incubated at 28 °C for 7 days. After incubation, petri-dishes were turned and 2 ml of concentrated ammonia solution was poured into the lid of inverted culture plate and kept for 10–15 minutes to release ammonia vapor [14]. On exposure of culture to ammonia vapor, the color development was recorded. Any color change from yellow to dark yellow, pink, or reddish brown was considered as an indicator of positive aflatoxin production. While absence of such color change was recorded as negative to aflatoxin production.
Detection of aflatoxin B1 by TLC method
The TLC plates were prepared by coating silica gel on glass plates. After coating, the plates were activated at 80 °C for 1 hour in a hot-air oven before use. The standard AFB1 and samples were spotted on TLC plates. The TLC plates were placed in tank containing chloroform and acetone in the ratio of 88:12 (v/v) for 30 minutes at room temperature. After 30 minutes the plates were observed under UV light for the presence of aflatoxins by their characteristic fluorescence properties. The blue fluorescence corresponding to the authentic AFB1 indicates the presence of AFB1 in the sample. The positive sample extracts which were for the presence of aflatoxins were taken for further analysis [15].
Enzyme-linked immunosorbent assay (ELISA)
Individual spots of aflatoxin B1 were scrapped and dissolved in 1 ml acetonitrile for estimation of aflatoxin. Quantitative analysis of AFB1 was accomplished by ELISA. The sample preparation, extraction and purification were done according to the instruction given by the company (RIDASCREEN®Aflatoxin B1, Germany). ELISA reader was employed for the quantification of aflatoxin B1. Finally, detected and quantified aflatoxin B1 was used for analysis across each sample, grain and storage types [16].
Results
Isolation and identification of fungi from animal feed
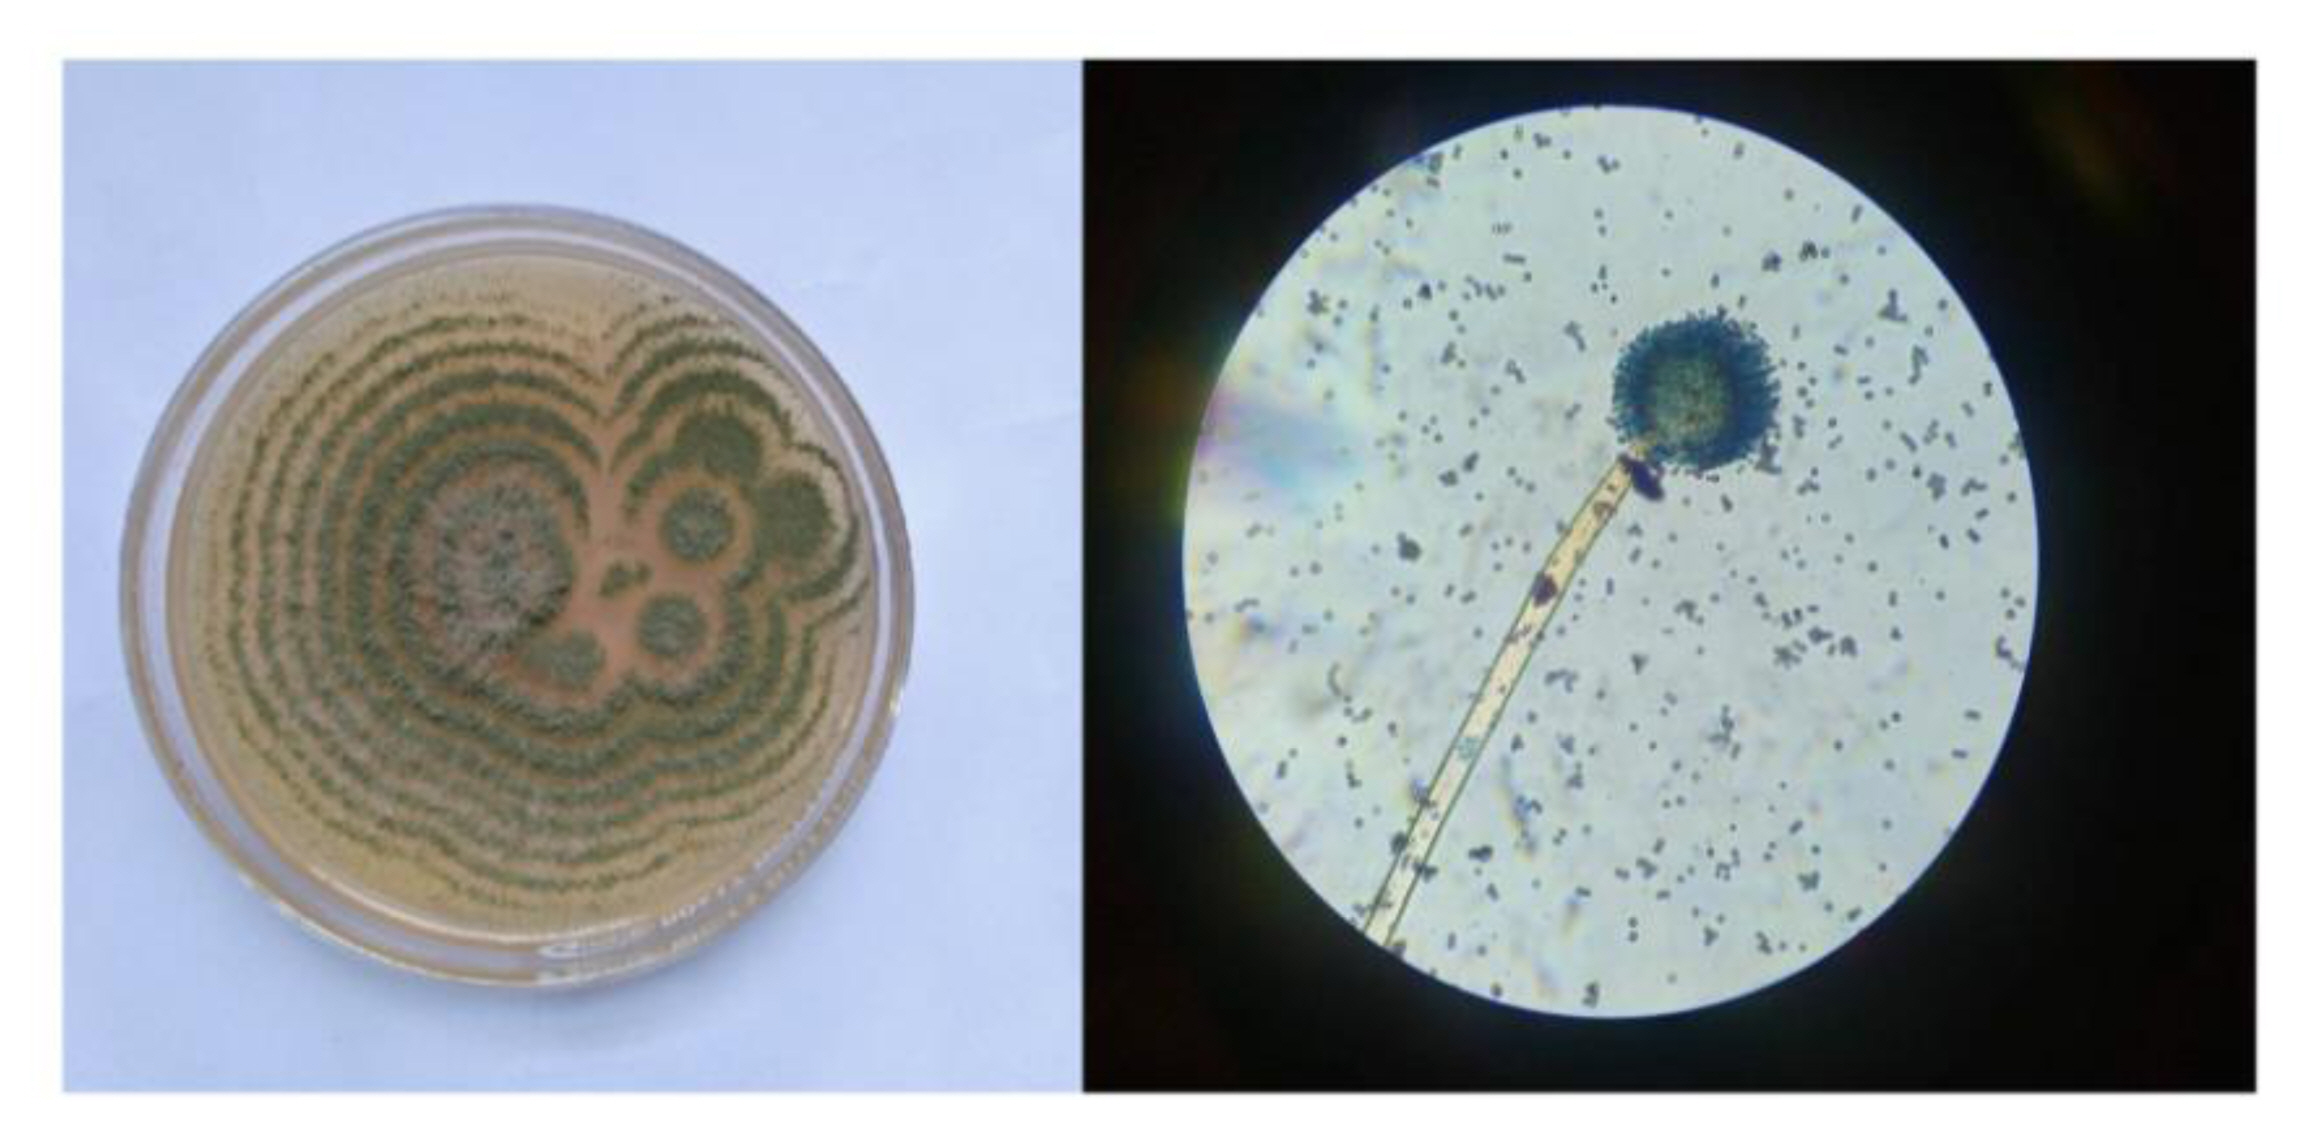
Total 29 fungi were isolated from the animal feed samples and cultured in Potato Dextrose Agar (PDA). The microscopic and macroscopic observation of Aspergillus flavus is depicted in (Figure 1). Out of the 29, 25 samples (85.96±0.25%) were positive and identified as Aspergillus flavus. (Table 2) depicts the isolation frequencies and relative density of different genera of fungi from animal feed samples. Of the 42 isolates, Aspergillus flavus (85.96±0.25%), Aspergillus niger (24.16±0.60%), Penicilllium spp (6.60±0.26%), Trichoderma spp (10.20±0.36%), Rhizopus spp (6.76±0.32%), Fusarium spp (3.16 ±0.25%), Mucor spp (3.13±0.25%) and Helminthosporium spp (3.16±0.25%). However, Aspergillus flavus prevailing rate was high (85.96±0.25%) followed by other fungi. Though Aspergillus flavus was highlighted in the present study due to key source of aflatoxin production, its high prevalence during the isolation is another significant factor. Using Duncan’s multiple range test there were significant difference (P<0.05) observed in different fungi isolated from the animal feed. Separate analysis was done for each column.
A. flavus is dominance in the feed of wheat and bran followed by A.niger and Rhizopus spp. with a frequency of 45, 38, 10% and their incidence were 100,100 and 22% respectively [17]. The reason for the dominance of Aspergillus in dates is due to its wide spread in the environment, which comes from its ability to form a large number of reproductive units resistant to the conditions which form plankton in the air because its diameter is less than 15nm and other openings, as well as its growth in wide ranges of heat and humidity, as some species of Aspergillus species grow at temperatures ranging from 5–45 °C or higher [18]. In the present study it was found that the various level of fungal contamination in the animal feeds. The fungal contamination renders incompetent for animal consumption and also less value for the animals feed. Among the Aspergillus isolates from feed samples, Aspergillus flavus was the predominant species in the animal feed followed by Aspergillus niger. The results of the present study is similar to other studies which also showed Aspergillus flavus as the most predominant fungi followed by Aspergillus niger [19].
Qualitative method for screening of A. flavus isolates for aflatoxin production
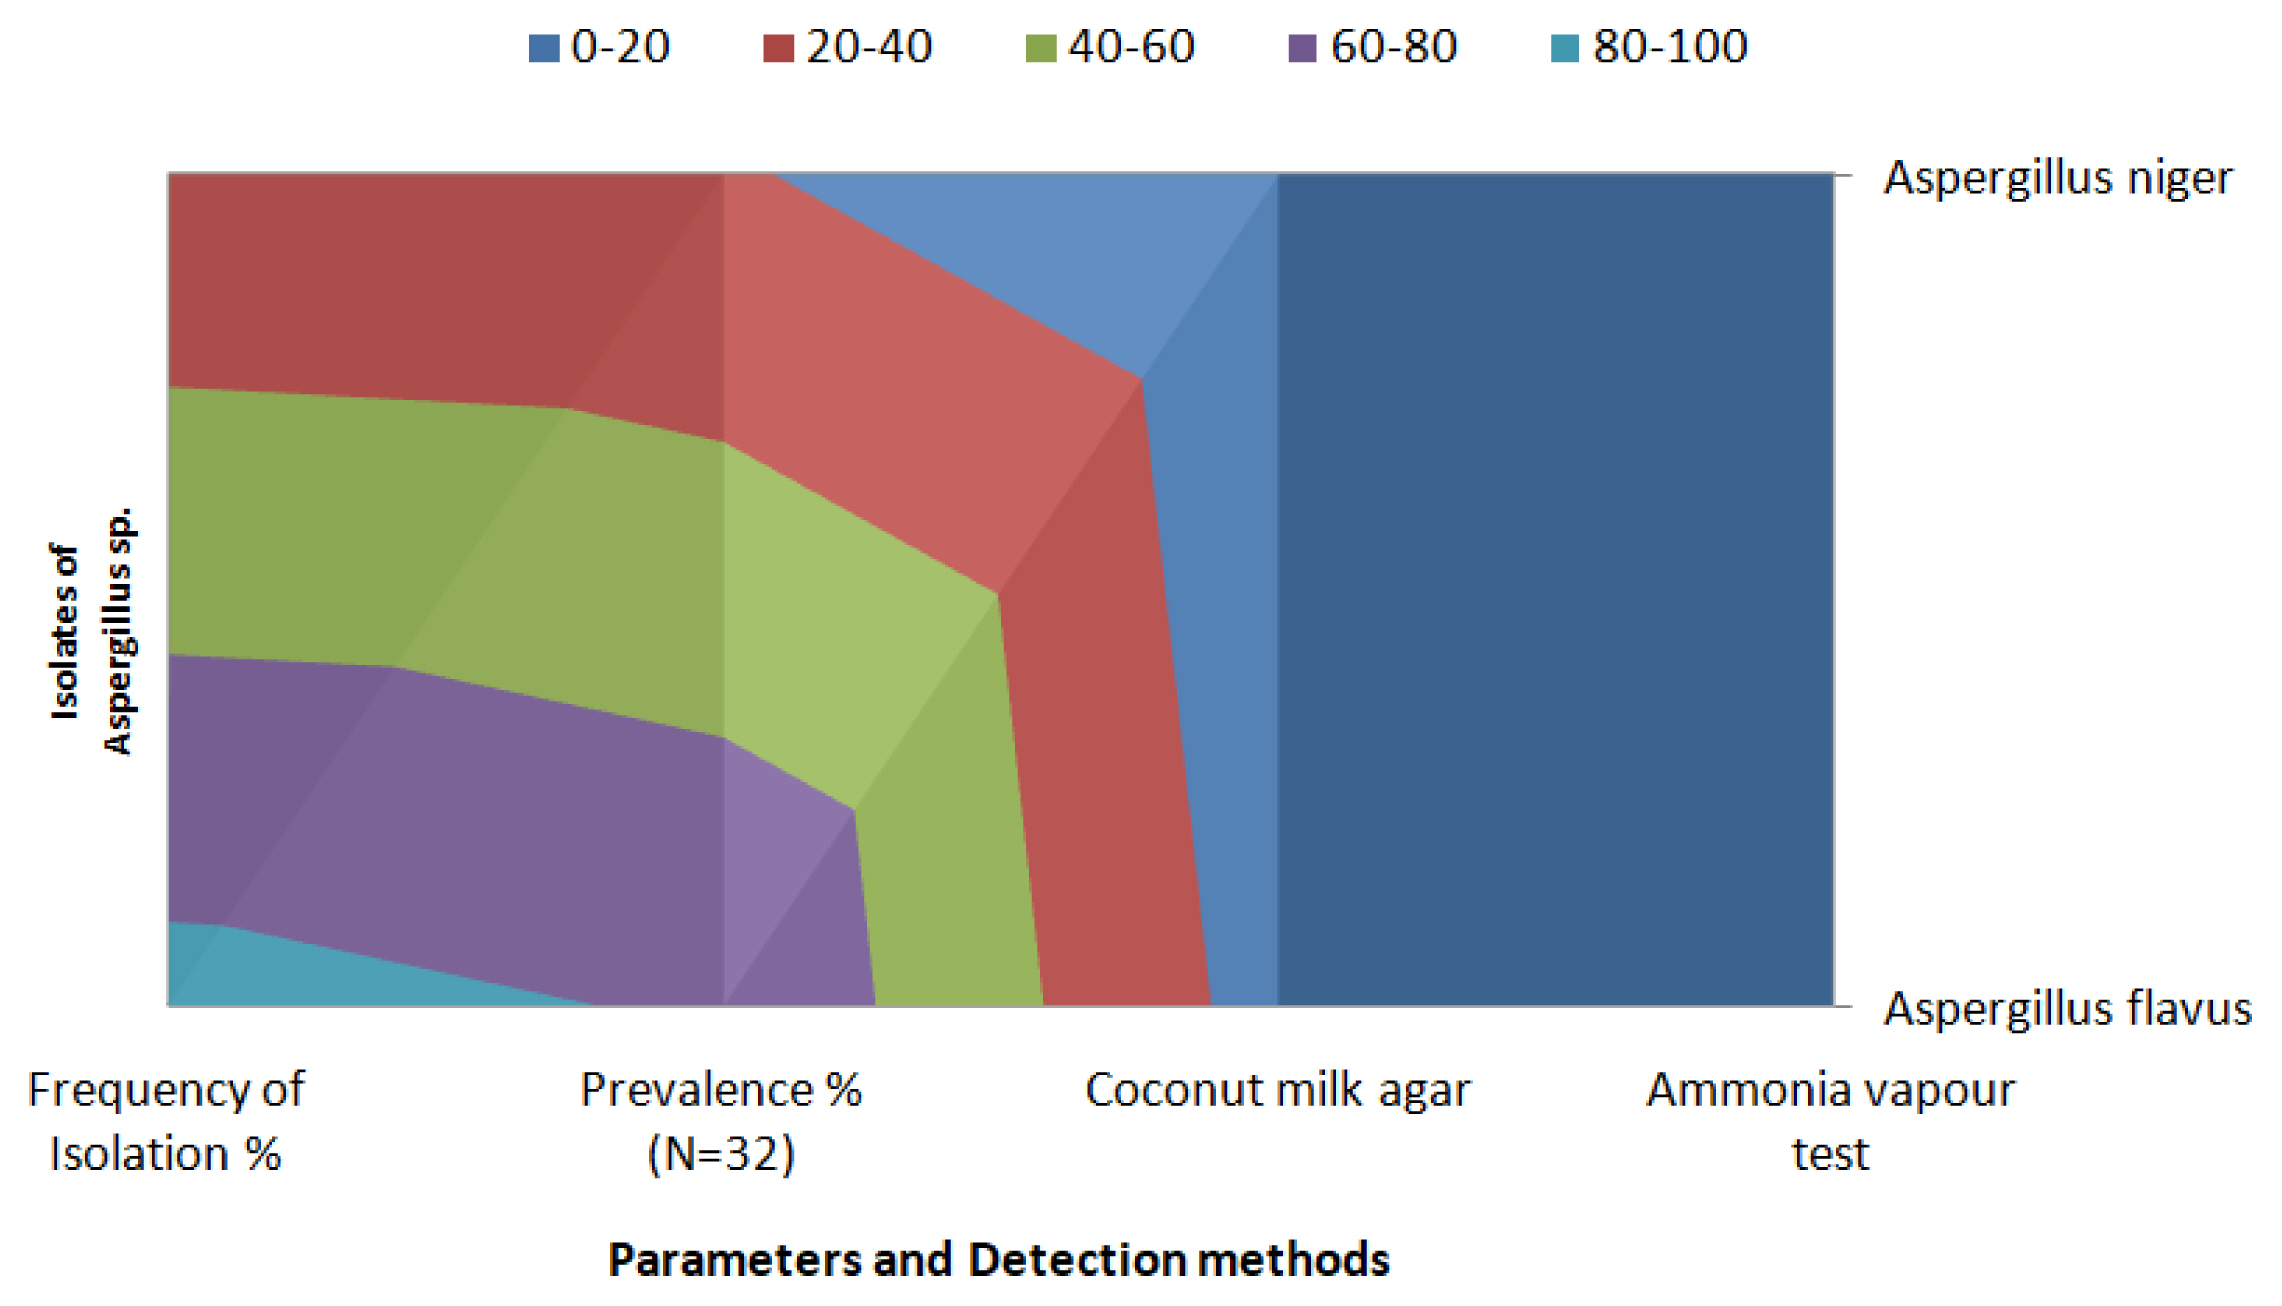
(Figure 2) revealed the prevalence and detection method of Aspergillus Sp isolated from the animal feed samples. In ammonium vapor test 48% of isolates of Aspergillus flavus gave plum red, red and pink color in different percentage on exposure with ammonia vapor indicating they are aflatoxigenic. The change in color of the cultures as plum red, red, pink or cream color on exposure of ammonia vapor is useful and quick technique for identifying A. flavus isolates from toxic to least toxic. In the present study, 16.66% of isolates showed red color indicating it is toxic, 50% isolates showed pink color indicating it is moderately toxic and 33.33% isolates in pink color indicates least toxic. This method is inexpensive and less time consuming for screening large numbers of aflatoxigenic Aspergillus flavus isolates.
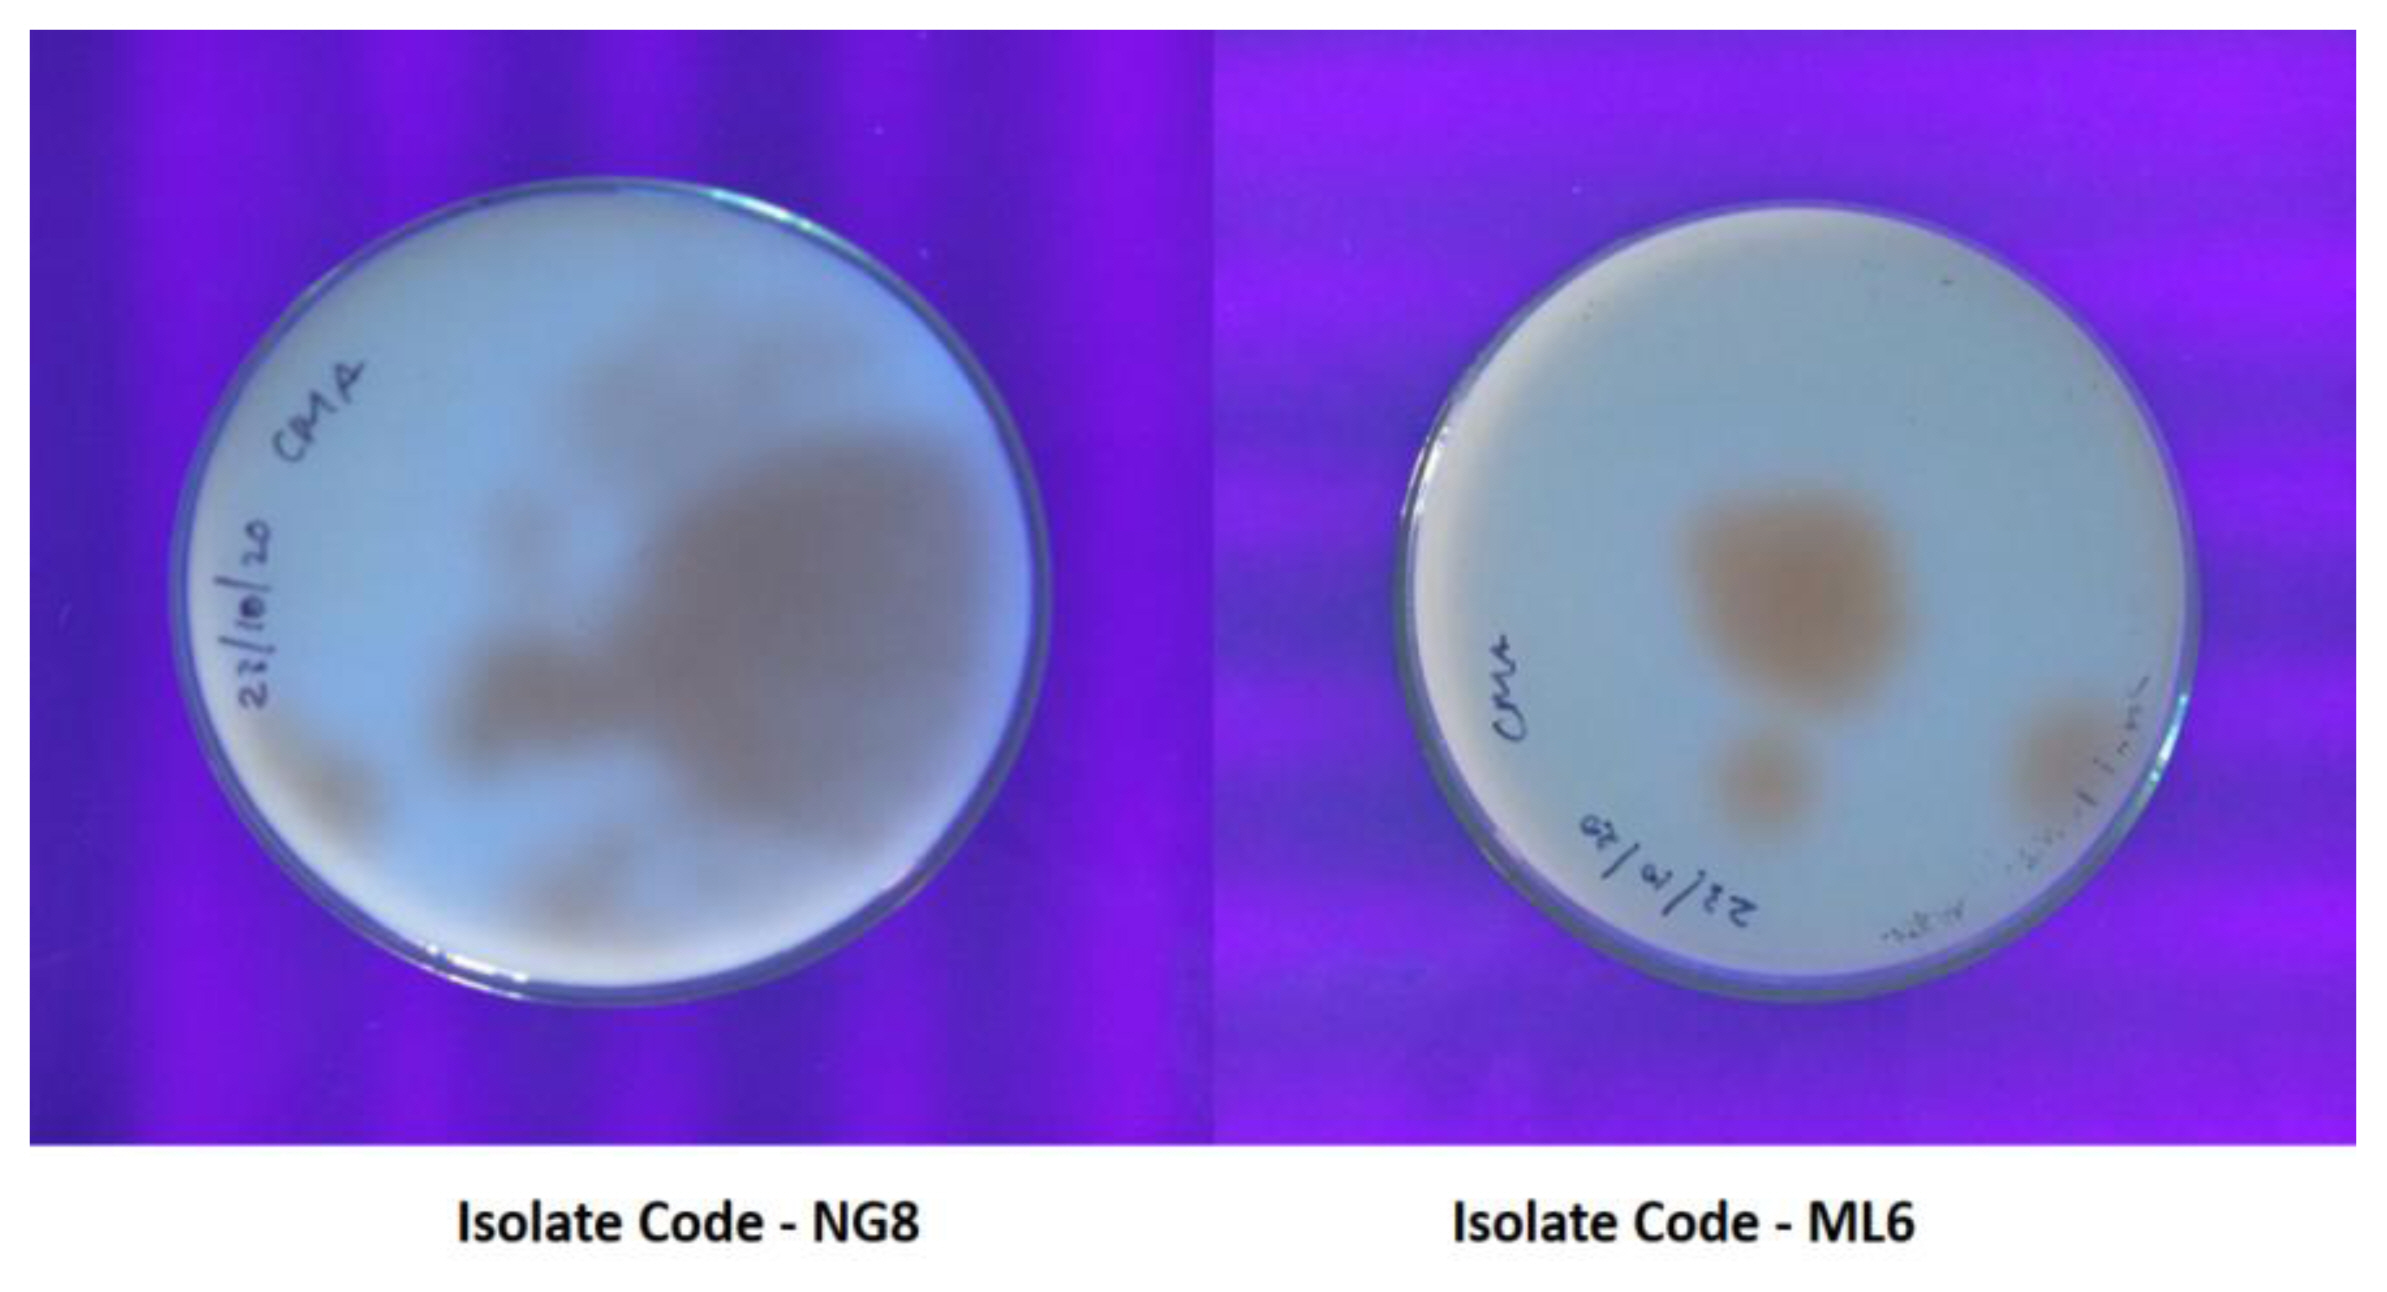
In coconut based medium test the components of coconut have an effect on the production of fluorescent pigment in coconut milk agar medium (CMA). (Figure 3) showed the production of fluorescent pigment in coconut milk agar medium by aflatoxigenic Aspergillus flavus. The present study revealed that the isolates NG8, ML6 showed high intensity of fluorescence ring on CMA, the isolate NG3, MY5, ML9, ML11, CH4, CH7 showed moderate intensity of fluorescence ring on CMA and the isolates MY2, MY1, MY3, CH11 showed less intensity of fluorescence ring on CMA. The numbers of aflatoxigenic isolates of Aspergillus flavus were equal by UV light at 365 nm and ammonia vapor on CAM. The aflatoxin producing ability of Aspergillus flavus was confirmed using TLC and ELISA. The cultures of aflatoxigenic Aspergillus were tested for 365 nm UV light fluorescence for bright orange yellow colony reverse coloring [20] and 25.6% positive isolates of aflatoxigenic A.flavus by fluorescence detection on CAM, while less isolates (12%) were identified as aflatoxigenic using ammonium vapor detection [21].
Detection of aflatoxin by TLC
TLC analysis of extracts from contaminated feed revealed the presence of aflatoxin in these samples which confirmed by the presence of blue-colored fluorescence in the UV trans-illuminator with the standard AFB1 sample. The RF values of AFB1 standard are high when compared to the contaminated feed. The isolates of the fungus showed production of the toxin and the isolate NG8 and ML6 produced aflatoxin which confirmed based on the intensity of its brilliance in TLC. Similar results were agreed that 75% of A. flavus isolates are able on the production of aflatoxin B1 [22] and 38.88% of A. flavus isolates which isolated from dates was able to produce aflatoxin B1[23]. The difference in the ability of isolates to produce aflatoxin B1 may be due to genetic differences between fungal isolates [24]. It is noted that the percentage of isolates producing aflatoxin B1, which was detected by this technique is less than the number of isolates producing toxin aflatoxin B1 by ammonia solution, so thin layer chromatography is more accurate in the identification of isolates producing mycotoxins in general, including aflatoxin B1.
Quantification of mycotoxins isolated from animal feed by ELISA
The immunoassay such as ELISA methods are used in this study because they are highly sensitive and specific, require minimal sample preparation and allow high rates of sample analysis using aflatoxin standard of known concentration [25]. Analysis of poultry feed using ELISA reader was derived by visual comparison of the samples color intensity OD values with the standard wells (Table 3). The samples containing reduced amount of color than the standard well had greater concentration of aflatoxin than the standard well. In contrast, the sample containing more color had lower aflatoxin concentration. In the present study the samples collected from NGAFS7, MLAFS18 showed the aflatoxin concentration of 521.67±2.08 μg/kg, 524.33±4.04 μg/kg, was toxic when compared to other samples, this could be due to the exposure of the grain to favorable temperature and rain which in turn facilitate the growth of aflatoxigenic fungi [16]. The Aflatoxin concentration of the samples collected from NGAFS3, MYAFS14, MLAFS20, MLAFS21, CHAFS26, CHAFS27 was found to be 315.67±2.51 μg/kg, 308.00±2.64 μg/kg, 313.67±2.51 μg/kg, 319.33±2.08 μg/kg, 315.67±2.51 μg/kg, 310.67±1.52 μg/kg respectively indicates moderately toxic. The least toxic concentration was found in the samples collected from MYAFS11, MLAFS15, MLAFS17, CHAFS29 and the values are 274.67±1.52 μg/kg, 79.66±1.52 μg/kg, 158.33±1.52 μg/kg, 28.37±2.08μg/kg. In the present study all of the isolate showed concentrations above the permissible level according to FDA regulations. In order to avoid ill effects on human and animal health due to frequent occurrence and associated toxicity of aflatoxins, several countries have set maximum permissible limits in commodities of food and feeds. These limits are not universal to all countries. For example, in the United States, the U.S. Food & Drug Administration (FDA) has set the action levels for aflatoxins to be 20 μg/kg for feedstuffs and 0.5 μg/kg for aflatoxinM1[26], and in the European Union, the regulatory limits for aflatoxin B1 in foodstuffs is at 2 μg/kg and for aflatoxin M1, it is at 0.05 μg/kg [27]. Because of the low permissible limits for aflatoxins and the associated high toxicity of aflatoxins impacting health even at sub-chronic exposure levels, the analytical methods for determination of aflatoxins need to be both sensitive and specific to be able to quantify trace levels. Aiming to achieve the safety of foods and foodstuffs and minimize associated regulatory/trade losses, the food and feed industry is in constant pursuit of rapid and reliable methods for detection and quantification of aflatoxins. The result of the analysis using Turkey HSD range test are significantly different from each other (P<0.05), Separate analysis was done for each column. Thus, the maximum level of aflatoxin for animal feed which represent the level of contamination at which the feed may be injurious to their health or results in contamination of milk, meat, or eggs etc., should be determined.
Conclusions
The fungi isolated in the present study were from the different genera that are common in animal feed. A. flavus was the predominant one while others are non-toxin producing fungal species occurred at relatively at the higher levels. The aflatoxin B concentration in the majority of the sample are below the recommended level however, in two sample aflatoxin level is much higher than the FDA standard. The study demonstrates the efficiency of qualitative and quantitative method such as coconut milk agar, ammonia vapor test and ELISA for the detection of aflatoxigenic fungi from the animal feed.