


INTRODUCTION
Naphthalene is one of the polycyclic aromatic hydrocarbons (PAHs) with the greatest vapor pressure [1,2]. Inhalation studies of airborne naphthalene in mice conducted by the national toxicology program (NTP) demonstrated positive evidence of its carCinogenicity in the respiratory system of the mice, and concluded that naphthalene is “reasonably anticipated to be a human carCinogen” [3]. The International Agency for Research on Cancer (IARC) has also designated naphthalene as group 2B, i.e., possibly carCinogenic to humans [4]. Despite its possible carCinogenicity, humans are frequently exposed to various sources of naphthalene in daily life. Indoor usage as a biocidal product is one of the major sources of naphthalene exposure in air, along with traffic emissions, volatilization from spilled oil, industrial manufacturing, and cigarette smoking [5]. Naphthalene is also used in consumer moth repellents for wardrobes and in toilet deodorant balls in many countries [6].
Despite the widespread usage of naphthalene deodorant balls in daily life, only a few studies have reported naphthalene concentrations in various indoor environments. Indoor naphthalene concentrations have been monitored in vehicles, kitchens, and living rooms in earlier studies, especially in connection with its generation by heating systems, cooking appliances, or tobacco smoking [7-9]. Zhu et al. reported that naphthalene made up the largest portion of indoor PAHs owing to mothballs used in opened wardrobes (mean value: 5.11 μg m-3) [10]. Batterman et al. monitored the atmospheric naphthalene level in 288 residences (mean value: 5.4 μg m-3) [11]. Because naphthalene deodorant balls are deployed in the limited-volume environments of public toilets, it is suspected that the atmospheric concentration of naphthalene might be higher in public toilets than in other indoor environments, although the ventilation rate and other parameters also affect the concentration. In areas where public toilets are generally freely accessible to all people without an entrance fee, such as Korea, exposure to naphthalene could be a cancer risk factor for the general population. Moreover, those who spend long periods of time in public toilets, such as cleaning workers, might be at increased risk of cancer due to airborne naphthalene. Thus, a risk assessment of naphthalene in public toilets via inhalation exposure is necessary.
To assess the risk of volatile organic air pollutants such as naphthalene, their atmospheric concentrations must be measured or estimated. Common methods of measuring the concentration of pollutants include active and passive air samplers and on-line instrumental measurement methods. Typical active air samplers (AAS) consist of pumping and absorbing units and on-line instruments such as proton transfer reaction mass spectrometry require electricity and space [12,13]. For these reasons, these methods are disadvantageous for sampling gaseous naphthalene in limited spaces such as public toilets. Passive air sampling (PAS) can be used as an alternative to AAS or on-line measurement [14,15]. Polyurethane foam (PUF) is one of the most widely used PAS material for monitoring, especially for volatile or semi-volatile organic compounds ((S)VOCs). The distribution of PAHs, as well as polychlorinated biphenyls (PCBs), organochlorine pesticides (OCPs), and polybrominated diphenyl ethers (PBDEs), has been monitored using PUF-PAS in many studies [16–19].
In this study, an assessment of naphthalene exposure in public toilets via inhalation was conducted using the atmospheric concentration of naphthalene in public toilets as estimated using PUF-PAS in nine public toilets in Seoul, Korea, and by an indoor air quality model. Risk assessments were then conducted for two exposure scenarios: the general population who often use public toilets, and cleaning workers who work in public toilets. Monte-Carlo simulation was also conducted to provide the range of uncertainty in the risk assessment.
METHODS
Materials
PUF disks were purchased from Sibata Scientific Technology LTD (Saitama, Japan). n-Hexane (HPLC solvent grade) was purchased from Daejung Chemical & Metals Co. (Siheung, Korea). Naphthalene (≥99%) and naphthalene-d8 (≥98%) were purchased from Sigma-Aldrich (St Louis, MO, USA). Ball-shaped naphthalene deodorants were purchased from a local market in Seoul, Korea.
Emission estimation modeling
The rate of emission of naphthalene from a naphthalene ball (Remission, mg h-1 ball-1) to the air in public toilets was estimated using a mass transfer equation:
where kair is the mass transfer coefficient of naphthalene in air (m s-1), A is surface area of a naphthalene ball (m2),
C a i r s u r f a c e C a i r ∞
where R is the ideal gas constant (8.314 Pa m3 mol-1 K-1), T is the absolute temperature (K), ranging from 291 to 298 K, p° is the vapor pressure of naphthalene (Pa), and p∞ is the partial pressure of naphthalene in bulk air, which was assumed to be close to zero.
The mass transfer coefficient (kair) was estimated using the film diffusion theory for spherical coordinates:
where Da is the diffusion coefficient of naphthalene (m2 s–1), r is the radius of a naphthalene ball (m), and δ is the thickness of the air boundary around the naphthalene ball (m). As Da depends on the temperature, Cho et al. developed an equation to estimate Da derived from 59 experimental data [20]:
where the coefficient of correlation between T and Da is 0.981 in the temperature range 288–337 K. The value of δ was assumed to be on the order of a centimeter, i.e., 0.01–0.1 m, and uniformly distributed. From visual observations, the uniform range of r was assumed to be 0.005–0.04 m.
In earlier studies, the value of p° was measured at different temperatures, and equations correlating p° with temperature has been derived [21]. The equation by Macknick and Prausnitz was chosen for this study, because it has the least uncertainty (1.1% within the temperature range 280–304 K), and it covers a wide ambient temperature range [22]:
The parameters used in the modeling of Remission are listed in Table 1.
Measurement of emission rate
The value of Remission was also derived from triplicate measurements of the mass loss of a naphthalene ball in an experimental chamber over time. A custom-made acrylic chamber (inner volume: 125 L) with a mechanical fan and inlet and outlet ports for air flow was used. A naphthalene ball with a diameter of 0.04 m was placed on a polypropylene weighing boat on the floor of the chamber, and its mass was measured daily for three days. Air was pumped out by applying a negative pressure to the chamber using a vacuum pump. A flow meter was connected to measure the volumetric flow rates; the rate was adjusted to 20, 30, or 40 L min–1 (corresponding air change rates of 10, 14.4, and 19.2 h–1, respectively). The ambient temperature and relative humidity in the chamber were measured using a hygro-thermometer and ranged between 14 and 21.2°C and between 10% and 38%.
Modeling atmospheric concentration of naphthalene in public toilets
The steady-state atmospheric concentration of naphthalene in public toilets (Cin, mg m–3) was estimated using a simple mass balance equation considering the production and elimination rates of naphthalene [23].
where Cout is the outdoor concentration (mg m–3), which is so smaller than Cin as to be negligible, ntoilet is the number of naphthalene balls in one cubic meter of public toilet (balls m–3), and ke is the overall elimination rate constant (h–1) [24]. For simplicity, it was assumed that air exchange was the dominant process for the elimination of naphthalene from toilet air. The volume of public toilets and total number of deodorant balls in the toilets were estimated by surveying 20 public toilets in Seoul, Korea. The calculated distribution of Remission using equation 2 was used in the calculation of Cin (equation 6). The plausible range of ke was assumed to be 7–15 h–1 assuming a well-ventilated condition with completely opened windows and mechanical fans in the public toilets [25]. The parameters used in the modeling of Cin are also listed in Table 1.
Monitoring of the naphthalene concentration using PUF-PAS
The mass of the PUF-PAS disks was measured before their deployment in the toilets (3.11±0.18 g). A dark-colored plastic dome that served as a housing for the PUF-PAS was connected above each PUF-PAS disk with a fishing line to reduce potential environmental effects such as light, air flow, or coarse particles (Figure S1a, Supplementary Material) [26]. The open side of the housing enabled air to circulate around the PUF-PAS disk so as not to delay equilibrium. Nine public toilets where deodorant balls were deployed and frequently replenished were chosen for PUF-PAS monitoring. PUF-PAS with housings were deployed inside the toilets for seven days in triplicate (Figure S1b, c, Supplementary Material). The duration of seven days was chosen based on preliminary testing, in which chemical equilibrium between the air and PUF-PAS was reached in less than seven days (see Supplementary Material). The PUF-PAS was collected and immediately placed into an amber glass bottle containing 290 mL n-hexane without headspace. The bottles containing the PUF-PAS in n-hexane were extracted at 25°C and 150 rpm for ≥18 h. Naphthalene-d8 in n-hexane was added to the PUF-PAS extract as an internal standard before concentrating the extract. The combined extracts were concentrated to 2 mL using a rotary evaporator and a gentle N2 gas stream.
Instrumental analysis
The extracts were quantified using an Agilent 7890A gas chromatograph coupled with a 5975C series mass spectrometer (GC-MS; Santa Clara, CA, USA). An Agilent HP-5MS 5% phenyl methyl siloxane capillary column (30 m×0.25 mm ID×0.25 μm film thickness; Santa Clara, CA, USA) was used. Helium was used as the carrier gas at a flow rate of 3 mL min–1. The injection volume of the sample was 2 μL, and the temperatures of the inlet and the detector were 250°C and 280°C, respectively. The oven temperature was initially held at 50°C, then ramped to 150°C at 10°C min–1, further increased to 280°C at 20°C min–1, and then held at 280°C for 6 min. The mass scan range was 35– 550 m/z, and data was extracted at 128 and 136 m/z for naphthalene and naphthalene-d8, respectively. The naphthalene concentrations in the n-hexane extracts were converted into the atmospheric concentration using the partition coefficient value (log KPUF-air=4.4) measured by Parnis et al. [27].
Quality assurance and quality control
To define the method detection limit (MDL) of PUF-PAS, seven PUF-PAS disks were spiked with 100 μL of a 14 mg L-1 solution of naphthalene in n-hexane, and extracted using the same procedure as used for the real samples. The MDL of PUF-PAS for naphthalene (996 mg mPUF-3) was obtained from standard deviation of the spiked samples multiplied by 3.14 [28]. The corresponding value of Cin was 63 ng m-3. Naphthalene was not detected above the MDL in blank PUF-PAS extracts. The extracts were calibrated using the internal standard naphthalene-d8. The external and internal standards covered the ranges 0.8–800 and 0.6–62 mg Ln-hexane-1, respectively, and linear regression resulted in an R2 value of greater than 0.99. For quality control, the sample with the third-highest external standard concentration among every five samples was analyzed as a control standard, and the coefficient of variance was less than 10%.
Risk assessment
The main route of naphthalene intake by humans is the inhalation of atmospheric naphthalene. The exposure concentration (EC; mg m–3) was calculated as:
where Cin is the concentration of naphthalene in toilet air (mg m–3), ET is exposure time (h day–1), EF is exposure frequency (d y–1), ED is exposure duration (year), and AT is averaging time (d) [29]. Details of the parameters used in the two exposure scenarios are shown in Table 2. Koreans’ average time in certain locations, and life expectancy were used for establishing the exposure scenarios [30,31]. Average values of time in locations and in activities related to dermal exposure to water were used to infer the average time spent in toilets, denoted by ET [30]. For the general population, the average EF and ET values in public toilets can be estimated as the average frequency and time spent on face washing. The life expectancy of Korean people estimated in 2016 by Statistics Korea was used for ED and AT [31]. When a representative value for a parameter was not available, assumed parameters were used for the development of the exposure scenarios. For public toilet cleaning staff, their exposure time can be assumed to be eight hours a day, five days a week.
The inhalation unit risk used in this study was established by the Office of Environmental Health Hazard Assessment (OEHHA) [32]. Briefly, studies of cancer related to naphthalene inhalation conducted by the NTP involved exposing male mice to up to 30 ppm naphthalene for 6 h per day, 5 days per week for 104 weeks. The human cancer potency of naphthalene was derived using a linearized multistage procedure based on the values of the increased incidences of nasal respiratory epithelial adenoma and nasal olfactory epithelial neuroblastoma in the mice. Then, OEHHA calculated the inhalation unit risk for naphthalene inhalation exposure as 3.4×10⁻² (mg m–3)–1. The excess inhalation cancer risk can be estimated by multiplying inhalation unit risk and EC.
Monte-Carlo simulation
The uncertainties in the estimation of Remission, Cin, and the corresponding cancer risk were assessed by Monte Carlo simulation using R program [33]. Based on randomly selected values from the assumed distribution of each parameter, 50,000 iterations were conducted.
RESULTS AND DISCUSSION
Estimation of the emission rate (Remission) and indoor concentration (Cin) of naphthalene by Monte-Carlo simulation
The distribution of Remission was created using equation 1 and Monte-Carlo simulation (n = 50,000) (Figure 1). The mean and median values of Remission were 5.3 and 2.4 mg h–1 ball–1, and the 90% confidence interval (CI) ranged from 0.18 to 19.48 mg h–1 ball–1. This distribution agreed well with the values of Remission determined experimentally using a chamber study. The obtained experimental Remission values were 5.96, 6.55, and 12.43 mg h–1 ball–1 at air change rates of 10, 14.4, and 19.2 h–1, respectively. It was observed that Remission increased with increasing air change rate. This could be explained by the increase in kair in equation 2. Increasing the volume flow rate would reduce the thickness of the air boundary layer (δ), thus increasing kair. The decrease in p∞ would have a negligible effect on Remission at such high air change rates. The measured Remission also agreed well with that of Jo et al., who reported an emission rate of 5.3– 6.3 mg h–1 at an air change rate of 0.5–2 h–1 [6].
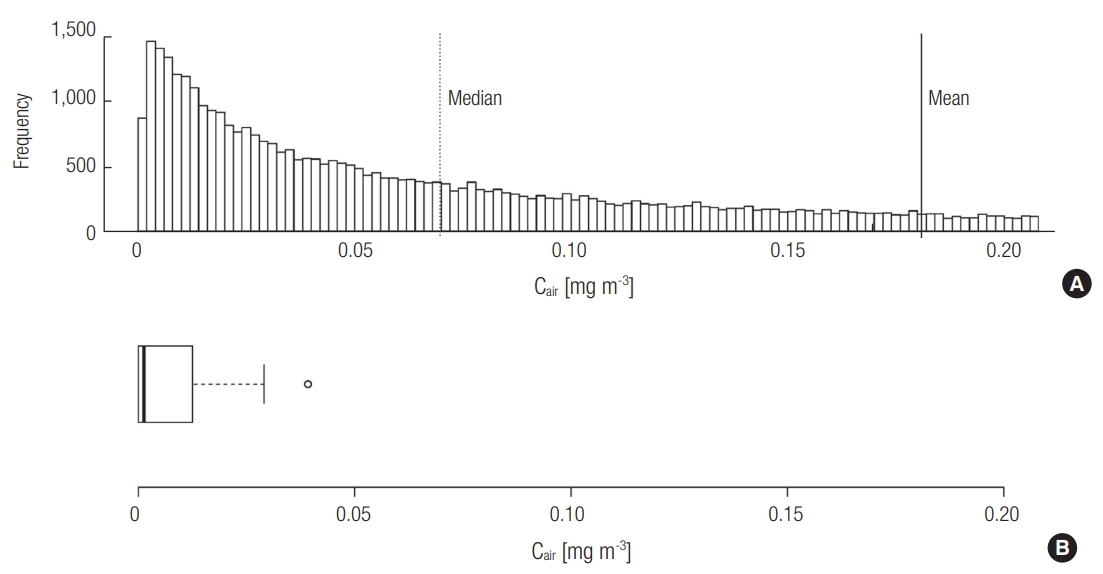
Based on the estimated distribution of Remission, the distribution of Cin was also created using Monte-Carlo simulation (n = 50,000) (Figure 2a). The mean and median values of Cin were 0.18 and 0.07 mg m–3 (90% CI: 0.0043–0.70).
Monitoring of the atmospheric concentration of naphthalene using PUF-PAS
The naphthalene concentration measured using PUF-PAS was above the MDL in seven of the nine toilets evaluated. In order to create a distribution of Cin based on field monitoring (Figure 2b), the Cin values below the MDL were assumed to be half the MDL (0.031 μg m–3). The mean and median values were 0.0013 and 0.0076 mg m-3, and the maximum value was 0.030 mg m–3. It is noteworthy that the values of Cin measured using PUF-PAS were approximately two orders of magnitude lower than the range of values estimated in Section 3.1. The existence of other removal processes is supported by earlier studies, in which removal processes such as photolysis, oxidation, or sorption were suggested to be important [34,35]. Although the elimination of naphthalene via indirect photolysis might be possible, the photodegradation of naphthalene would be negligible because the photolysis rate constant with hydroxyl radical obtained using EPISuiteTM from the US Environmental Protection Agency (US EPA) under natural sunlight is only 0.12 h–1 [36,37]. Sorption effects should be considered for the estimation of the lumped overall elimination rate constant (ke). Singer et al. demonstrated the possibility of indoor atmospheric naphthalene removal by sorption to indoor walls, and suggested a removal coefficient of 1.64 h–1 for this process [34]. Considering that public toilets contain many available sorption sites such as toilet paper, garments and other surfaces of visitors, and urinals, the removal coefficient due to the various sorption processes could be greater than that via air exchange.
Another possible reason for the difference in the estimated and measured Cin values could be the wetting of the naphthalene ball surfaces. A thin film of water on the surface of naphthalene ball would add additional mass transfer resistance. The modeling equations (equations 1 and 2) and our experimental Remission conditions assumed that the surface of naphthalene was dry. However, the inclusion of a thin layer of water on the surface of the naphthalene ball would reduce Remission, thus lowering the expected Cin.
Furthermore, the measurement data using PUF-PAS is hardly considered to reflect accurate Cin value and the method is even described as ‘semi-quantitative’ sampling [26]. Relatively high vapor pressure PAHs such as naphthalene, acenaphthylene and acenaphthene are not expected to be captured efficiently with PUF-PAS [38]. Since this study disregards the sampling efficiency of PUF-PAS and possibility of loss before extraction of PUF-PAS, the measured Cin is likely to be overestimated.
Risk assessment
Cancer risks were calculated by multiplying the EC by the inhalation unit risk. The EC distributions were created in two different ways: from the Cin obtained from the indoor air model and from the Cin obtained using PUF-PAS monitoring. The resulting cancer risk distributions are depicted in Figure 3. As shown, the cancer risks estimated using the Cin value from the indoor air model were much higher than those obtained using Cin obtained from PUF-PAS monitoring under the same exposure scenarios (Figure 3a and c; Figure 3b and d). The 95th percentile of the cancer risk for cleaning staff was 1.6×10⁻⁶, even when the monitored distribution of Cin was used (Figure 3c). According to the US EPA, a cancer risk between 10–6 and 10–4 implies a possible hazard [39]. The risk of workers who spend long periods of time in public toilets is at the verge of being possibly hazardous. Nevertheless, considering the uncertainty of PUF-PAS discussed in Section 3.2, measured Cin value can be regarded as the minimum limit of estimation. So, the risk of workers would be greater than 1.6×10⁻⁶. In addition to this, indirect routes of exposure, such as the intake of dust particles and the desorption of sorbed naphthalene from clothes, as well as the ubiquitous presence of naphthalene in urban air, would increase their total exposure. For the general population, on the other hand, the 95th percentile cancer risk was 4.7×10⁻⁹, even when Cin from the indoor air model was used (Figure 3b), implying that visiting public toilets is a negligible cancer risk factor.
In this study, the inhalation unit risk from the OEHHA was used for risk estimation, even though the uncertainty of this inhalation unit risk is still under debate. Several reports have described non-cancer health effects of the inhalation of naphthalene in humans [11,32]. The US EPA found that severe naphthalene-related human effects such as anemia, hematuria, coma, and death, which are generally related to the ingestion of naphthalene mothballs [4]. The working group of the US EPA found only two case studies involving human data, and declared that no inference could be made on the carCinogenicity of naphthalene. They evaluated naphthalene as having inadequate evidence in humans in terms of its carcinogenicity. However, naphthalene was assessed by the US EPA to have sufficient evidence of carcinogenicity in experimental animals.
Naphthalene balls are still deployed in many public toilets, although their usage is decreasing because of the substitution of chlorinated organic chemicals such as 1,4-dichlorobenzene (1,4-DCB) [4]. The inhalation unit risk for inhalation exposure to 1,4-DCB established by OEHHA is 1.1×10⁻² (mg m–3)–1, which is similar to that of naphthalene by a factor of three [32]. Also, 1,4-DCB is also known to cause effects similar to those of naphthalene in humans via inhalation exposure. The inhalation exposure of mice to 1,4-DCB over two years resulted in liver tumors and bronchoalveolar adenomas [40]. In addition, the vapor pressure of 1,4-DCB (173 Pa at 20°C) is much higher than that of naphthalene (11 Pa at 25°C), which likely results in a higher Cin of 1,4-DCB [41]. Although the carcinogenic potential of 1,4-DCB is also still under debate, 1,4-DCB would not be a good alternative to naphthalene. Alternatives to naphthalene or 1,4-DCB are necessary for precaution. For example, the Ministry of Environment of Korea recommends the use of natural products such as wood charcoal, pieces of cedar wood, or aroma oils as an alternative to naphthalene sanitation balls [42]. In order to reduce risks, workers are recommended to be equipped with appropriate personal protection during their cleaning activities.
CONCLUSIONS
A quantitative evaluation of the cancer risk presented by naphthalene in public toilets was conducted for the first time. Two exposure scenarios were considered: one using the atmospheric naphthalene concentrations (Cin) obtained using an indoor air model and another using the data from PUF-PAS monitoring. The model predicted a much higher Cin than PUF-PAS monitoring, suggesting possibility of more removal processes than air exchange, less evaporation rate and less sampling efficiency of PUF-PAS. Since both estimations are less credible, complementary usage is required to calculate inhalation risk. While the level of cancer risk was found to be negligible for general population, that of cleaning staff without appropriate personal protection would exceed the allowable limit for cancer risk. Despite the uncertainty of Cin estimation, the risk reduction of toilet workers is recommended.