


INTRODUCTION
According to the World Health Organization (WHO), pesticide exposures result in millions of acute poisoning cases annually worldwide, with approximately one million of these poisonings resulting in a hospitalization [1]. According to the Centers for Disease Control and Prevention National Environmental Public Health Tracking Network, there were 50,133 pesticide exposures in children and adolescents aged 0 to 18 years old in the United States in 2014 [2]. Of these 4 703 (9.38%) occurred in Texas [2]. Overall, literature is limited on pesticide exposures in children and adolescents in the United States [3-9]. Only a few studies incorporate poison center data into their analyses to identify regional variation in pesticide exposures [10,11]. Sudakin and colleagues demonstrated the value of this approach by identifying a spatial and temporal cluster of symptomatic pesticide exposures in Oregon [10]. Individuals in the clusters had a 1.8 relative risk (p=0.0005) of reporting a symptomatic pesticide exposure [10]. Sudakin and Power examined clustering of more serious outcomes of pesticide exposures and found a statistically significant cluster that had a 2.0 (p=0.0005) relative risk of serious moderate, major, and fatal outcomes [11]. Although these studies illustrated how spatial analysis can be used to study regional and temporal variations in pesticide exposures, their analyses did not explain the presence of clusters or potentially associated factors [10,11]. In addition, these studies did not focus on children and adolescents, but were for all exposures in adults and children [10,11].
In addition, the literature shows that utilization factors and built environment factors may influence pesticide-related poison center calls [12-16]. Various factors may result in increased or decreased poison center utilization. Studies that addressed poison center utilization found that lower population density, race, education, poverty, income, foreign-born population, language spoken at home, and distance from the poison center were associated with reduced poison center utilization [12,13]. In contrast, percentage of population ≤5 years old, percentage of population with a bachelor’s degree, poison center certification, poison center educator full-time equivalents, and Asian population percentage were associated with increased poison center utilization [13]. Next, the built environment (e.g., the physical parts of where we live and work) has been found to impact health [14]. Cummins and Jackson’s review paper found that the condition and design of the built environment can either cause or prevent illnesses and injuries in children [15]. Poor housing conditions may result in environmental exposures, for example to lead, pests, air pollutants, and other contaminants [16].
The goal of this paper is to investigate spatial-temporal patterns of unintentional pesticide-related poison center exposures in children and adolescents in Texas to identify associated demographic and environmental factors.
METHODS
Data Collection
An ecological study design was utilized with data from the Texas Poison Center Network (TPCN), American Community Survey (ACS), and Texas Department of State Health Services (DSHS) county designation data. First, unintentional pesticide-related poison center exposures from 2000 to 2013 for children and adolescents ≤19 were collected from the TPCN. For this study, pesticide-related poison center exposures were defined as all calls with a pesticide reported as an exposure, which was defined based on the reported generic Poisiondex codes (a database that contains product information used to group products). The codes used to define pesticide-related exposures had been previously published [8]. Poison center data included in this study were the frequency of unintentional pesticide-related poison center exposures by caller county, for three American Association of Poison Control Centers (AAPCC) age groupings for children and adolescents (children ≤5 years, children 6-12 years, and adolescents 13-19 years). Additional inclusion criteria beyond the pesticide-related codes included: 1) exposure code for unintentional exposures (general, environmental, occupational, therapeutic error, misuse, bite/sting, food poisoning and unknown, but deemed to be unintentional [17]); and 2) exposure code for adverse reactions, which were included as unintentional because these are unintended or unintentional results of exposures. Exclusion criteria included: 1) cases without a caller county; and 2) calls classified as child unknown or for adults ≥20 years.
The 2005-2009 ACS five-year estimates were used to assess variables (e.g., sociodemographic and other variables) potentially associated with unintentional pesticide-related poison center exposures. Based on existing literature, the following variables from the ACS were included in the analysis: education, poverty, income, race, foreign-born population, language spoken at home, average household size, housing occupancy, housing tenure, older housing, and geographic mobility [12,13,15,18]. In addition, county designation variables (e.g., rural or border) were included in the analysis. Geographic mobility is defined by the United States Census Bureau as “movement of people from one location to another” [19]. The variable “moved” was created for this exploratory analysis which combined all geographic mobility categories, including: moved within same county, moved from different county, moved from different state, and moved from abroad. County designation data from the Texas DSHS was utilized to assess for the influence of urbanization (e.g., rural versus urban) and border status (e.g., whether counties bordered Mexico) on unintentional pesticide-related poison center exposures [20]. Annual population data for children ≤ 19 years was obtained from the Texas DSHS using census population and intercensal estimates [21].
Data Analysis
First, the spatial scan statistic was used to identify nonrandom spatial clusters of unintentional pesticide-related poison center exposures in Texas using a Poisson model in SatScan 9.4 [22]. The spatial scan statistic calculates the expected number of cases for population size in each area to find areas with an overrepresentation or cluster of pesticide-related exposures [23]. A limitation of the spatial scan statistic is a low power to detect quickly emerging clusters over extended periods of time [24]. To respond to this limitation, the 14-year study period was split into two seven-year groups (2000-2006 and 2007-2013). This cut-point was selected due to a clear temporal pattern in the dataset; in 2007, pesticide-related poison center exposures began to decrease consistently. The model was also age-adjusted using AAPCC age groupings (children≤5 years, children 6-12 years, and adolescents 13-19 years). The model ran 999 replications utilizing a circular window shape based on 50% population at risk with no geographical overlap allowed. The analysis included primary spatial clusters (e.g., those most likely to exist) that were identified in each time period, and that were used for regression analyses of associated factors with clustering status. The term primary spatial clusters will hereby be used to indicate spatial clusters identified in each time period in the subsequent section.
Next, multiple logistic regression was utilized to assess the relationship between cluster classification (e.g., cluster or noncluster county) and independent variables for each time period. Univariate analyses were used to guide the construction of the final models. To build the final models, backward selection was utilized to produce the most parsimonious model by dropping the variable with the highest p-value until all variables were significant (p<0.05). To confirm that all significant variables were included in the final model, those variables removed previously were included one at a time to ensure that they did not make a significant contribution. Then, based on the final logistic models, the probability of being a cluster county (e.g., a county that was in the identified primary spatial cluster) was computed for each variable categorized into the 1st, 25th, 50th, 75th, and 95th percentile utilizing predictive margins in STATA 14 SE [25]. Predicted margins allow for results from logistic regression and other forms of regression that include continuous independent variables to be more easily interpreted. The research was deemed not to involve human subjects by the Texas DSHS Institutional Review Board (IRB) (IRB#14-064) and the research was deemed exempt by the Texas A&M University IRB (IRB 2015-0563M).
RESULTS
From 2000 to 2013, there were 59 477 unintentional pesticide-related exposures reported to poison centers in the TPCN that met the case definition and had a reported caller county and age (excluded cases=1,050 [location=657 and age=393]) (data not shown). The average annual age-adjusted rate for unintentional pesticide-related poison center exposures was 59.2 per 100 000 population (data not shown).
There were 33 145 and 26 332 pesticide-related poison center exposures for Time Period 1 (2000-2006) and Time Period 2 (2007-2013), respectively. For the time periods and based on the spatial scan statistic, primary spatial clusters were identified which included 59 counties in the primary spatial cluster for Time Period 1 and 119 counties in the primary spatial cluster for Time Period 2 (see Figure 1 and Table 1). The cluster for Time Period 2 included 64 counties not included in the Time Period 1 cluster. In addition, the location of the cluster for Time Period 2 appeared to shift slightly to the west from Time Period 1. There were 4 counties in the Time Period 1 cluster that were not in the Time Period 2 cluster. The average annual rates were 69.6 and 49.9 per 100 000 cases for Time Period 1 and Time Period 2, respectively. In addition, the relative risk decreased between the time periods (from 1.90 to 1.75 for Time Periods 1 and 2, respectively). Table 2 displays the mean and p-values for t-tests, Wilcoxon Sum Rank Tests, and McNemar tests with and without Bonferroni adjustment by cluster classification for all variables explored. In addition, state mean values were provided for comparison.
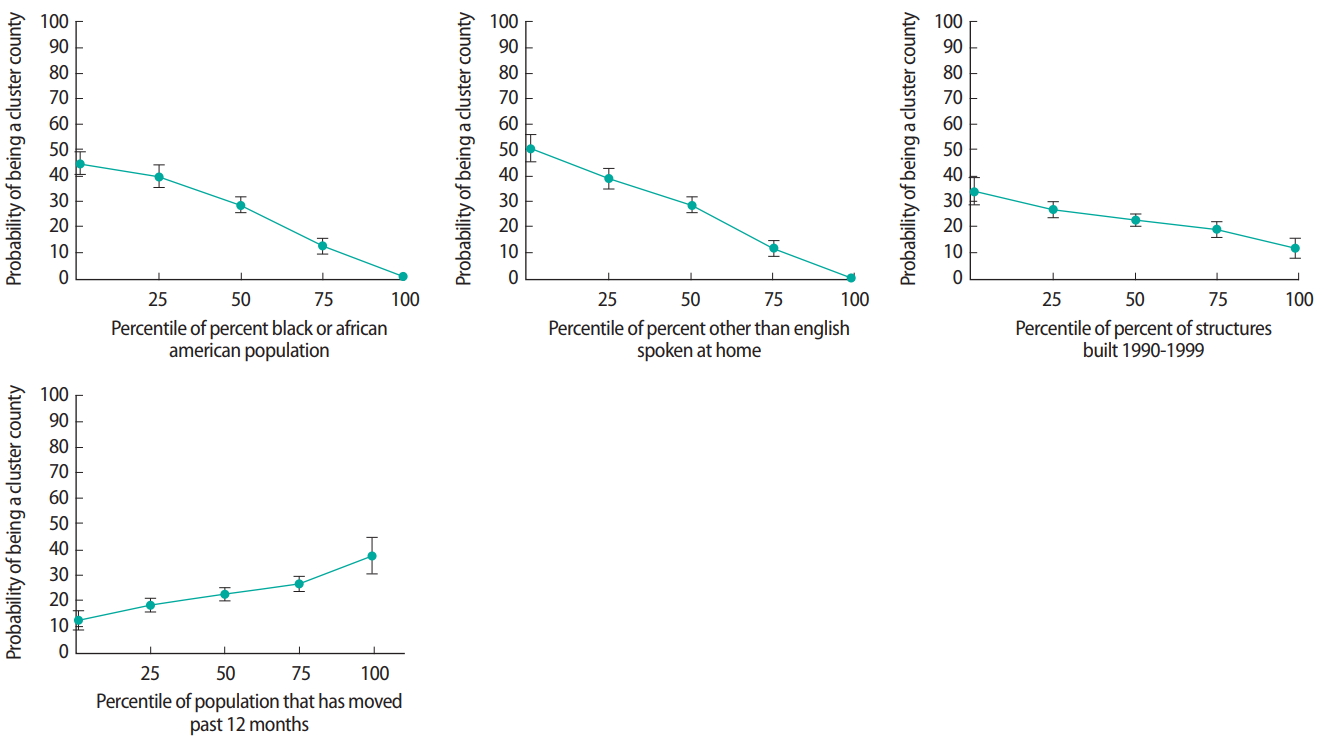
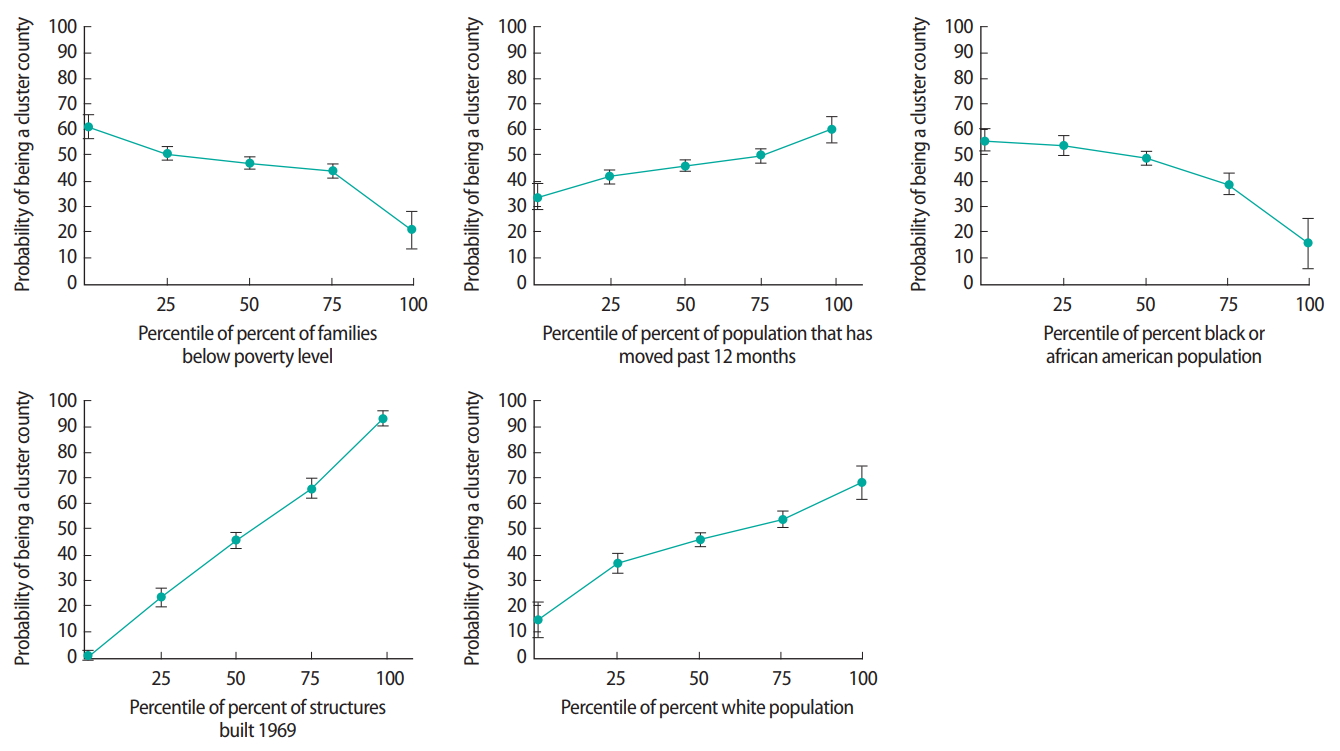
The logistic regression models included significant variables for Time Period 1 and Time Period 2 that were associated with the clusters of unintentional pesticide-related poison center exposures (see Table 3). For Time Period 1, the following variables were statistically significant: percent black or African American population (odd ratio [OR]=0.81, 95% confidence interval [CI] 0.75, 0.89; referent percent other race/ethnicity population [white, American Indian or Alaskan Native, Asian, Native Hawaiian or Pacific Islander, other]), percent other than English spoken at home (OR=0.93, 95% CI 0.90, 0.96; referent percent English spoken at home), percent of structures built during 1990-1999 (OR=0.94, 95% CI 0.89, 0.99; referent percent of structures built Before 1939-1989 or 2000-After 2005), and percent of population that had moved in the past 12 months (OR=1.08, 95% CI 1.01, 1.16; referent percent of population that has not moved in the past 12 months). For Time Period 2, statistically significant variables were: percent of families below poverty level (OR=0.89, 95% CI 0.84,0.95; referent percent of families above poverty level), percent of population that had moved in the past 12 months (OR=1.12, 95% CI 1.03, 1.21; referent percent of population that had not moved in the past 12 months), percent black or African American population (OR=0.87, 95% CI 0.79, 0.96; referent percent other race/ethnicity population [American Indian or Alaskan Native, Asian, Native Hawaiian or Pacific Islander, other]), percent of structures built before 1969 (OR=1.13, 95% CI 1.09, 1.16; referent percent of structures built after 1970), and percent white population (OR=1.13, 95% CI 1.05, 1.21; referent percent other race/ethnicity population [American Indian or Alaskan Native, Asian, Native Hawaiian or Pacific Islander, other]). Predicted margins were used to interpret the logistic regression findings further, by estimating the predicted probability of a county being in the cluster as the percentile of significant variables from the logistic regression increased for each time period (see Figures 2 and 3). The use of predicted margins illustrated that as the percentile increased for percent black or African American for both time periods, the probability of being a cluster county decreased. Also, for both time periods as the percentile increased for the percent of the population that had moved in the past 12 months, the probability of being a cluster county increased. In addition, the variable year structure built was significant for both time periods. For Time Period 1, as the percentile increased for percent of structures built from 1990 to1999, the probability of being a cluster county decreased; however, for Time Period 2, as the percentile increased for percent of housing structures built before 1969, the probability of being a cluster county increased.
DISCUSSION
The logistic regression models found that for both time periods, percent of black or African American population was significantly associated with unintentional pesticide-related poison center exposures in children and adolescents. Existing literature has found that areas with higher percent black or African American populations have lower poison center utilization rates [12,13,26]. Lower poison center utilization may explain this finding. Future studies should address poison center utilization for specific exposures, such as pesticide exposures, to explore this pattern.
In addition, percent of population that had moved in the past 12 months was significantly associated with unintentional pesticide-related poison center exposures in children and adolescents. At this time, there is no literature addressing the association between geographic mobility (e.g., moved) and environmental exposures, such as pesticide exposures. Additional research is needed to study the association of geographic mobility and utilization of poison centers, as well as the association with unintentional pesticide exposures.
Next, year structure built was a significant variable in both multiple logistic regression models in the present study. Previous literature has found that the age of a home is a significant predictor of pesticide exposures due to poor degradation of pesticides indoors; however, this literature does not explain exposures being reported to poison centers [27]. Thus, we hypothesize that older homes may potentially have more cracks and crevices which can result in the increased presence of pests and greater pesticide use. It is also known that the built environment can impact health outcomes [14]. Existing literature shows that the built environment can produce disparities which may result in environmental exposures [15,16]. For example, Northridge and colleagues found that those living in public housing were more likely to report cockroaches compared to those in private housing (68. 7% and 21.0%, respectively) [18]. In addition, public housing residents were less likely to utilize air conditioning compared to private housing residents (50.6% and 75.1%, respectively) [18]. Decreased air conditioning use can result in potential pesticide use because the use of air conditioning systems minimizes the entrance of insects and rodents into buildings [28]. Besides year structure built, this study could not assess the influence of the built environment on unintentional pesticide-related poison center exposures. However, the impact of the built environment is important and should be further investigated.
The strengths of this study comprised the inclusion of 14 years of data, which allowed for multiple time periods to be studied. The study used a novel approach in understanding associated factors that may result in clusters of unintentional pesticide-related poison center exposures in children and adolescents. Specifically, the study utilized ACS and county designation data to explore the relationship between potentially associated variables and unintentional pesticide-related poison center exposures, which has not previously been done. Lastly, through utilizing univariate and multiple logistic regression, the exploratory study was able to identify potentially related variables of unintentional pesticide-related poison center exposure clusters.
The primary limitation of this study was that it was conducted using aggregated county-level data. The findings need to be interpreted carefully given the ecological fallacy and modifiable area unit problem. This is a significant limitation because the population that reported pesticide exposures may not be accurately represented by census data. Poison centers do not collect information on personal characteristics (e.g., race, education, age of housing); thus, utilizing ACS data was the most feasible option for this exploratory study. The use of countylevel data may not have captured patterns that would have been identified using smaller geographical areas or units of analysis. Poison center data are based on voluntary calls and self-reported information. Poison center data only captures information for reported exposures and should not be assumed to represent all exposures to a substance [17]. Furthermore, the caller county may differ from the exposure county for poison center calls. Another limitation of the study design is that exposures with missing data for location and age were excluded from the analysis, which may have introduced potential bias.
In conclusion, this exploratory study supports that there are environmental and demographic factors associated with unintentional pesticide-related exposures reported to poison centers among children and adolescents in Texas. Future research should attempt to utilize other secondary data sources to explore these patterns, and the implementation of more advanced study designs should be explored (e.g., case-control or cohort). Additional information explaining clusters of pesticide-related poison center exposures, such as determinants of poison center utilization, could help to focus interventions for those populations. This exploratory analysis also supports expanding the demographic information collected by poison centers. This expansion would assist with understanding the populations being served (e.g., utilization factors), as well as the geographical areas that should be targeted for future prevention efforts.