Introduction
There is an accumulation of cohort study results, mostly from North America and Europe, indicating an association between long-term exposure to particulate matter (PM) air pollution and human health [1-3]. Toxicological results indicate plausible biological pathways that support the association [4-6]. Cohort studies of air pollution, however, have an intrinsic limitation: the unavailability of individual-level measurements. To overcome that limitation, various exposure prediction approaches have been used to predict long-term concentrations of PM air pollution at cohort residences.
The application of improved exposure prediction models can reduce measurement errors in individual-level air pollution conconcentrations and can provide more accurate and precise health effect estimates. Early cohort studies used relatively simple prediction approaches such as assigning an average measurement from monitors within an administrative area to the people residing in that area (area-averaging). Other approaches included application of a measurement at the closest monitor (nearest-monitor) and an average measurement that was weighted by distances from neighboring monitors (inverse-distance-weighting) [2,7,8]. These relatively simple methods, however, do not sufficiently represent the spatial variability of individual-level air pollution concentrations within an area. The use of such predictions may result in biased and/or imprecise effect estimates in health analyses. Recently, more sophisticated exposure models that rely on statistical approaches to incorporate spatial heterogeneity were developed. The two most common statistical modeling approaches are land use regression and kriging. Land use regression uses geographical variables as covariates in a regression framework, whereas kriging models correlation structures in addition to a specified mean structure [9-11].
In South Korea, recent cohort studies based on individual-level outcome data have investigated the association of short- or long-term exposure to air pollution with human health. Some of these studies used simple approaches such as area-averaging and inverse-distance-weighting methods [12-14]. Others adopted ordinary kriging to estimate spatially heterogeneous air pollution concentrations across individuals [15-19]. However, most of those studies limited their study areas to single cities. In addition, few studies included information on model evaluation focusing on the spatial prediction ability of the exposure models. This study aimed to construct and evaluate ordinary kriging models of long-term average concentrations of PM less than or equal to 10 μm in diameter (PM10) during 2010 in seven major cities in, as well as the entire country of, South Korea.
Materials and Methods
From the Korean Ministry of Environment, we obtained hourly PM10 concentrations recorded in 2010 at 283 monitoring stations in South Korea. We selected the 2010 data as it included a larger number of monitoring sites than in other years. In South Korea, there are four types of monitoring networks: urban-ambient, near-road, regional-background, and nationalbackground networks. Each network was established with a different purpose of air pollution sampling for pollution sources. In our analyses, we used 226 urban-ambient monitoring network sites in order to avoid influences of specific local and regional sources, such as traffic and long-range transport from neighboring countries, on PM10 concentration variability. Geographic coordinates for the 226 monitoring stations were obtained from the Ministry of Environment. The coordinates were verified by comparing them with addresses in Google Maps and in the Air Korea database. Corrections were applied when site locations were mismatched. For each monitoring site, we computed daily averages from hourly PM10 concentrations and then averaged the daily averages to obtain an annual average. Daily averages were computed for all days in which there were more than 21 hourly measurements. To compute annual averages, we included sites for which there was at least one daily average per month for more than 9 months and less than 45 consecutive days of missing daily averages.
Kriging is a geostatistical interpolation method that predicts an estimate for an unmeasured location given the characterized mean and variance structures [20]. To characterize the mean structure, ordinary kriging assumes a constant mean over space, whereas universal kriging includes covariates in a regression framework to represent local variation. The variance feature that represents spatial dependency is assessed by using a variogram, which applies the squared differences of measurements against distances between sites for pairs of data points. The variogram is modeled, given a specified covariance function, by using three covariance parameters: range, partial sill, and nugget. The range is the distance at which a spatial correlation exists. The partial sill and nugget parameters represent spatial and non-spatial variability, respectively.
Using annual average PM10 concentrations across 226 sites, we derived ordinary kriging models for each of the seven major cities and for the entire country of South Korea. The seven major cities were Seoul, Busan, Incheon, Daejeon, Daegu, Gwangju, and Ulsan. We used the exponential covariance function and maximum likelihood method to estimate mean and covariance parameters. We also examined sensitivity to other covariance functions and estimation methods. Subsequently, we evaluated model performance by using leave-one-out cross-validation for city-specific models and 10-fold cross-validation for the national model. Leave-one-out cross-validation excludes the PM10 data for one site, constructs the model using the data for the remaining sites, predicts the PM10 concentration at the excluded site, and repeats the same procedure for each of the remaining sites. Ten-fold cross-validation splits all sites into 10 groups and performs the same procedure to leave-one-out cross-validation to each group of sites instead of to each site. After obtaining crossvalidated predictions for all sites, mean square error (MSE) and R-squared (R2) statistics were computed. The MSE is the average squared differences between observations and cross-validated predictions. The R2 statistic was computed as one minus the ratio of MSE to the variance of the observations and was replaced by zero when the computed R2 was negative.
Results
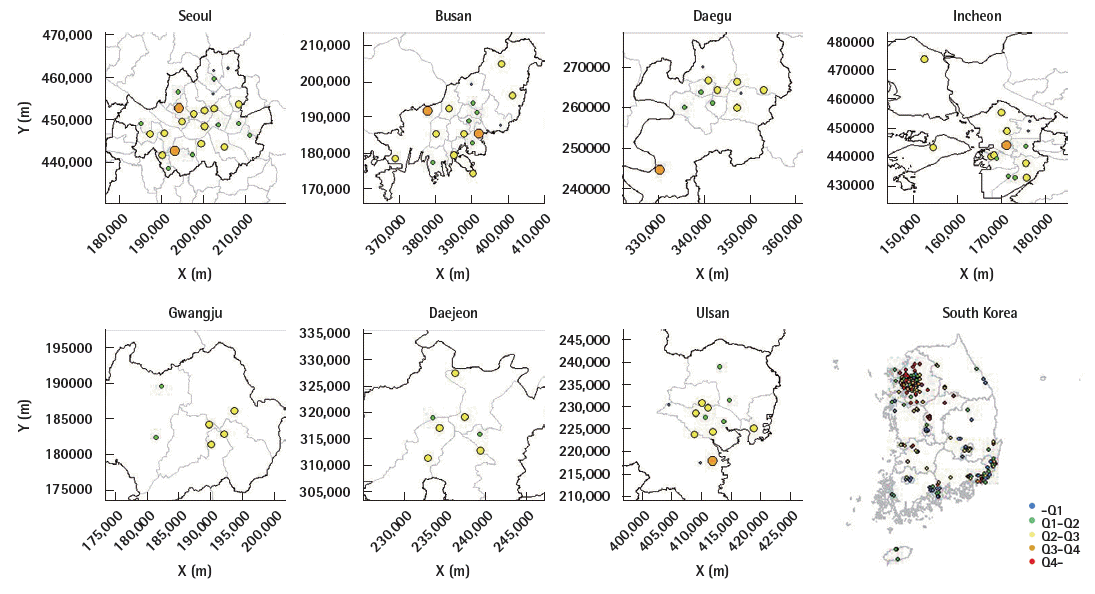
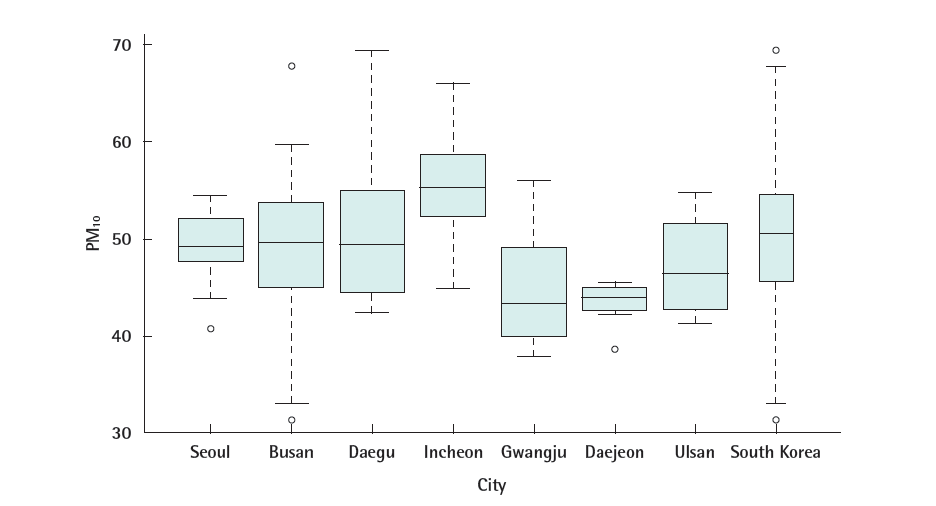
Among 226 urban-ambient monitoring sites in South Korea for 2010, 24 sites were located in Seoul (Table 1). There were less than 15 sites in Gwangju, Daejeon, Daegu, and Ulsan (6, 7, 11, and 13, respectively). Median between-monitor distances were less than 10 km in Daejeon, Ulsan, Daegu, and Gwangju (6.6, 7.5, 8.2, and 8.5 km, respectively); the distance was largest in Busan (13.5 km). Monitoring sites were less uniformly distributed in Gwangju and Daegu than in other cities (Figure 1). The 2010 annual average PM10 concentration was highest in Incheon (66.0 μg/m3) and lowest in Daejeon (45.5 μg/m3; Table 1, Figure 2). The standard deviations of the average annual PM10 concentrations were larger in Busan and Daegu (9.51 and 8.48 μg/m3, respectively), and smaller in Daejeon and Seoul (2.40 and 3.33 μg/m3, respectively). Within each city, there was a tendency for similar PM10 concentrations to be detected at nearby monitors and less similar concentrations to be recorded at distant monitors (Figure 1).
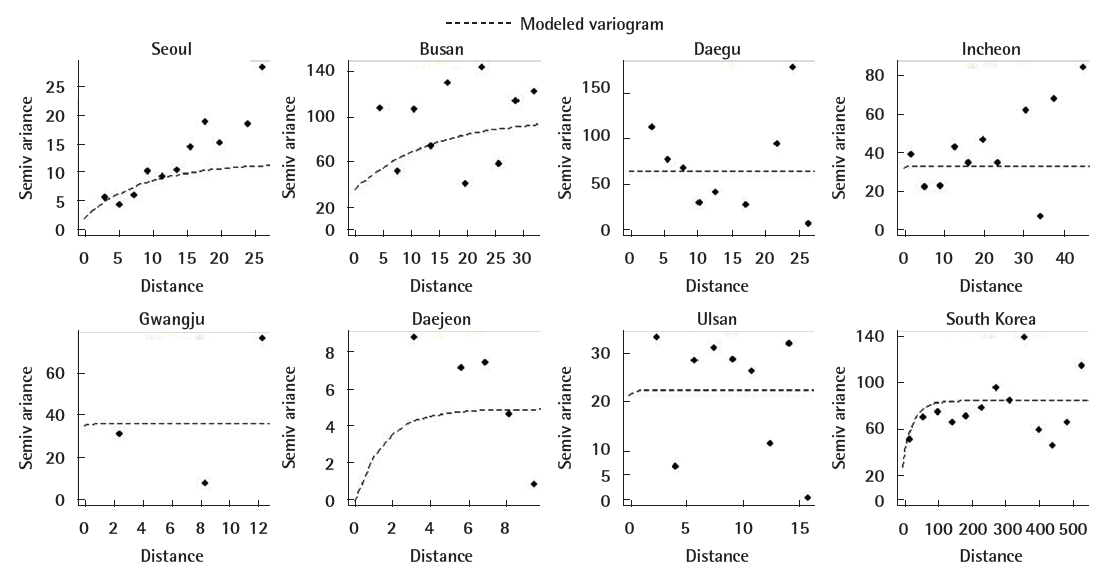
City-specific variograms show little spatial dependency in all cities except Seoul and Busan (Figure 3). Estimated range and partial sill parameters were zero or close to zero in five of the cities (Table 2). The cross-validated R2s were zero and the MSEs were generally large in five of the cities (Table 2). Daejeon, with the lowest PM10 variability, had a relatively small MSE despite having a low R2. In Seoul and Busan, cross-validated R2s were 0.31 and 0.23, respectively. The national model produced slightly higher R2 (0.36) than those in the city-specific models. The results were not sensitive to the application of different covariance functions or the use of different parameter estimation methods. Figure 4 indicates that there was good agreement between observed and cross-validation predicted PM10 concentrations across the monitoring sites in Seoul, Busan, and the entire country of South Korea. However, variability in the predicted values was smaller than that in the observations, resulting in low R2s.
Discussion
We fitted city-specific and national ordinary kriging models to predict individual-level long-term concentrations of PM10 in South Korea. For the seven major cities in this study, the performance of the city-specific models was generally poor. The national model performed better than the city-specific models. These findings were consistent with those obtained from sensitivity analyses that used different covariance models and parameter estimation methods.
Many cohort studies into air pollution in South Korea have used ordinary kriging to estimate individual-level or fine-scale area-level concentrations of air pollution including PM10 [15-19]. Some of these studies have reported evaluation of ordinary kriging models based on the leave-one-out cross-validation approach [17-19]. Leem et al. [17] and Seo et al. [18] reported good agreement between observed and cross-validation predicted PM10 concentrations in Incheon and the seven major cities included in our study. Because these studies used temporallyand spatially-resolved health outcomes such as preterm birth and low birth weight, their ordinary kriging was performed on a monthly scale. Large temporal variability relative to spatial variability in predicted monthly concentrations over space might have contributed to good agreements in those studies. The level of agreement may decline when the analysis focuses on spatial prediction ability after excluding temporal variability. Kim et al. [21] in a study of six US metropolitan cities showed that temporal variability in two-week average predictions of PM <2.5 microm in diameter (PM2.5) components obtained from spatiotemporal prediction models was larger than spatial variability [21]. When temporal variability was adjusted, cross-validated R2s dramatically decreased depending on the city and the PM2.5 component. In an assessment of annual average PM10 concentrations in Ulsan, Son et al. [19] compared MSEs from ordinary kriging with those obtained from area-averaging, nearest-monitor, and inverse-distance-weighting methods by using cross-validation. Although the MSE of the ordinary kriging model was smaller than the MSE of the other three approaches, all four methods produced large MSEs that were greater than the variance of the data, indicative of poor model performance. In order to assess model performance, we computed R2 values (in addition to MSE) which show the proximity to unity of the relationship between observed and cross-validation predicted values relative to the variability in the data. Evaluation of spatial prediction ability in exposure prediction models is crucial for providing spatially-predictable individual air pollution estimates to future cohort studies that will examine the association of air pollution with critical health endpoints such as event occurrence and progression of chronic diseases.
Performance of the ordinary kriging models developed in the present study was generally poor, possibly because of our use of a simple mean structure. Ordinary kriging assumes a mean that is constant over space. However, PM air pollution concentrations are affected by local and/or regional sources, which can result in fine- and/or regional-scale spatial heterogeneity [6,22]. For example, PM10 concentrations at a monitor located next to a busy road or a power plant could be markedly high and may be clearly different from those at nearby monitors. Previous studies of source apportionment for PM air pollution in Daejeon, South Korea showed that motor vehicle and combustion/industry sources contributed substantially to PM10 concentrations [23, 24]. Exposure prediction models may not accurately represent actual PM10 concentrations over space if the contributing local and/or regional sources are not considered in the models. We suggest that future studies investigate exposure prediction models that incorporate geographical variables in land use regression, either alone or combined with a spatial correlation structure within a universal kriging framework.
In addition to our use of a simple mean structure, the small number of monitoring sites and/or the presence of insufficient spatial variability could have resulted in the poor model performance in this study. In the five cities with R2s equal to zero, the numbers of monitoring sites were less than 15 and/or spatial variability of PM10 concentrations was relatively small. A simulation study showed that ordinary kriging models produced an increase in MSE when the number of monitoring sites decreased from 22 to 12 [25]. We excluded approximately 60 monitoring sites from near-road and regional- and national-background networks that were established to monitor local or regional sources, because ordinary kriging captures spatial variability based only on large-scale spatial correlation. Land use regression or universal kriging approaches would allow inclusion of these monitors, as they would incorporate variables related to the PM sources. In addition, variability in PM10 concentrations in the seven major cities was small with coefficients of variation of 8-19% in the cities and 17% in the entire country. Variability could increase if monitoring sites from other networks are included.
We found better model performance in the national kriging model than in the city-specific models. The better performance of the national model further indicates the importance of increasing the number of monitoring sites and the spatial variability in air pollution data. For the cities in our study with low numbers of monitoring sites, it may be preferable to use predictions from the national model rather than those from the city-specific models when the association between long-term PM concentrations and health outcomes is to be assessed in epidemiological studies.
It is important to develop exposure prediction models that accurately represent spatial variability in air pollution concentrations for the goal of health effect analyses. Recent cohort studies developed more sophisticated prediction approaches that incorporate geographical and meteorological variables in order to reduce measurement errors in exposure estimation and to provide valid and precise effect estimates in health analyses [9,26,27]. A simulation study reported larger bias in health effect estimates of predictions obtained from the nearest-monitor method than from ordinary kriging, when there was an underlying spatial structure in air pollution concentrations [25]. In a simulation study that compared health effect estimates of predicted longterm PM2.5 concentrations obtained from ordinary kriging to those from land use regression, the kriging-derived predictions produced an unacceptable level of bias in the health effect estimates [28]. Recent papers described various features of measurement errors in exposure estimates from exposure prediction models that can result in bias and uncertainty of health effect estimates and development of measurement error-correction methodology [29,30]. Given the increase in the number of cohort studies focusing on assessing causal associations with air pollution in South Korea, it is necessary to develop exposure prediction models that will produce scientifically meaningful results from epidemiological analyses.
This study suggests that an ordinary kriging model alone would be insufficient for predicting PM10 concentrations that represent spatial variation across individuals and for assessing long-term associations of PM10 with health endpoints in seven major cities, South Korea. Future studies should investigate alternative prediction approaches to better represent individuallevel PM10 concentrations. Such alternative approaches should incorporate geographical characteristics related to specific sources of PM10.


