


INTRODUCTION
Agriculture relies greatly on chemicals including inorganic fertilizers and synthetic pesticides to improve agricultural products and yield and their usage is increasing [1]. Fungicides and herbicides account for 51% of the type of pesticides used globally [2]. In addition to the increasing usage, the concentration of pesticide used and frequency of application of pesticides is increasing [3]. It is also common for farmers to mix pesticides of different chemical class to combat pesticide resistance by pests and improve production efficiency [1, 3].
Surface waters are natural sinks of pesticides from agricultural fields. Pesticides mixtures in surface water consist of different chemicals having either similar or dissimilar modes of action [4] and different possible chemical interaction in living organism. The terms additivity, synergism and antagonism have being used extensively to describe chemical interactions. The toxicological effects of the interaction between components of a pesticide mixture in non-target organisms is complex and depend on the chemical nature of the individual pesticides, mode of action, the concentration and the site of toxic action [5]. It is often difficult to understand and predict the combined effects of mixtures because the assessment of chemical toxicity is usually carried out for each chemicals acting alone, without considering potential joint effects. It is also not feasible to perform toxicity test for mixture to assess joint toxicity due the large number of chemicals [6].
Several mathematical models have being developed and utilized to estimate interaction including the synergistic ratio (SR) and isobologram [7,8]. The concentration addition (CA) developed by Loewe, also called dose addition and the independent action (IA) model developed by Bliss are among the models commonly used to predict the effects of mixture based on the previous knowledge of the effects of each of the components of the mixture [6, 9, 10, 11]. Other models such as toxic equivalency factor [12], generalized concentration addition (GCA) model [13], and full logistic model [14] have being developed to address some of the shortcomings of the CA and IA model. CA is better suited for mixtures whose components share similar modes of action, while IA model is apt for mixtures with components with different modes of action [6]. GCA on the other hand is suited for mixture components with different efficacy [15].
CA and GCA model, may be unsuitable models to predict interactions between copper hydroxide and glyphosate based on the assumptions of the models. CA model was however applied because both pesticides share one mechanism of toxicity with is inhibition of antioxidants and oxidative stress. Again the extent to which mechanism of action of components of a mixture may be similar may not be known to effectively apply CA model [15]. GCA was utilized because even though the mixtures were prepared based on equi-toxic ratio (equivalent toxicity), given that concentration of each pesticide in the mixture is different, their efficacy may also be different. Thus while this study aimed to assess the single and joint lethal toxicity, type of interaction of the fungicide and herbicide, it may be useful to see how CA and GCA compares with IA model in predicting the joint toxicity of the pesticides in Clarias gariepinus given the characteristics of the pesticide mixture.
MATERIALS AND METHODS
The research consist of two related experiments; the study of acute lethal toxicity of formulated copper hydroxide and glyphosate pesticides to estimate the lethal concentrations (LC) of each pesticide; and acute lethal toxicity study of the pesticide mixture to estimate the LC of the mixture. Data from the two experiments were fitted into different models to determine the type of interaction between the pesticides in the mixture and predict the toxicity of the mixture.
Test Chemical
The pesticides used for this study was sourced from local vendors in Abia State, Nigeria and are among the list of pesticides approved for use in cocoa farms in Nigeria. Formulated pesticides used in the study include;
- Fungicide - Kocide 101, a wettable powder. The active ingredients are 100 g containing copper hydroxide – 77%, inert ingredients - 23%, metallic copper equivalent 50%. The fungicide registered trade mark of Du pont de Nemours (France), represented by Reiss & Co. (Ghana), Ltd.
- Herbicide - Drysate, emulsfiable concentrate. The active ingredients are 360 g glyphosate/l in form of 480 g/L glyphosate-isopropylamine salt. Manufactured by Sichuan Leshan Fuhua Tongda agrochemical technology Co. Ltd., China, represented by Crop care Ltd., Kano State, Nigeria.
Collection and acclimatization of fish samples
C. gariepinus fingerlings (1.5-2 cm in length) were purchased from a private fish farm in Aba, Abia State, Nigeria and transferred to laboratory where they were acclimated for a week. The fishes were kept in a plastic aquarium containing borehole water. All the fishes were fed with commercially available fish feeds and excess feed and faeces was siphoned daily. After the one week of acclimation, the fish was transferred randomly into the plastic aquaria to test the pesticide and the mixture.
Stock and Test solution
The copper hydroxide stock solution was prepared by mixing 1g of the wettable powder in 1 L of bore hole water, while glyphosate stock solution was prepared by making up 1 mL of the pesticide to 1 L. Stock solution of the pesticide mixture was prepared by mixing 2 g of copper hydroxide powder and 1 g (2.083 ml) of glyphosate pesticide and making up the mixture to 1 L. Mixture was prepared based on equi-toxic ratio (2:1 i.e. 2 parts of copper hydroxide and 1 part of glyphosate). Test solutions of the required concentration was prepared by dilution the stock solutions for the range finding and definite test.
Acute Toxicity of Each Pesticide
The range finding test were conducted to establish the range of concentrations used for the definite toxicity test. Twenty C. gariepinus fingerlings were exposed in two replicates of ten to nominal copper hydroxide concentrations of 50 mg/l, 75 mg/l, 100 mg/l, 125 mg/l, 150 mg/l and 200 mg/l and glyphosate concentration of 50 mg/l, 75 mg/l, 100 mg/l, 125 mg/l and 150 mg/l in a plastic aquaria containing 1 litre of the test solutions. The fishes were exposed for 96 hours and mortalities were recorded at 24, 48, 72 and 96 hours and lethal concentration at these time interval were estimated.
Acute Toxicity of the Pesticide Mixture
Similarly, range finding test were conducted and ten C. gariepinus fingerlings were exposed in duplicates to established nominal pesticide mixture concentrations of 50 mg/L, 55 mg/L, 60 mg/L, 65 mg/L and 70 mg/L. Mortalities were recorded at 24, 48, 72 and 96 h and lethal concentrations at these time intervals were also estimated.
Toxicity factor for relative potency measurements was calculated using equation (1);
Physicochemical analysis of test solutions
Temperature, pH, dissolved oxygen, electrical conductivity, total dissolved solids of the test solution was monitored during the experiment using portable meters.
Determination of the type of interaction between the pesticides in the mixture.
Two models were used and not three determine the type of interaction between the fungicide and the herbicide.
Model 1: The SR model [7]. SR was calculated using equation (2)
Where SR=1 describes additive action, SR<1 describes antagonism action and SR>1 describes synergistic action.
Model 2: The toxic unit (TU) of the mixture CA was calculated using equation (3) while chemical interaction was established based on the assumption of equation (4).
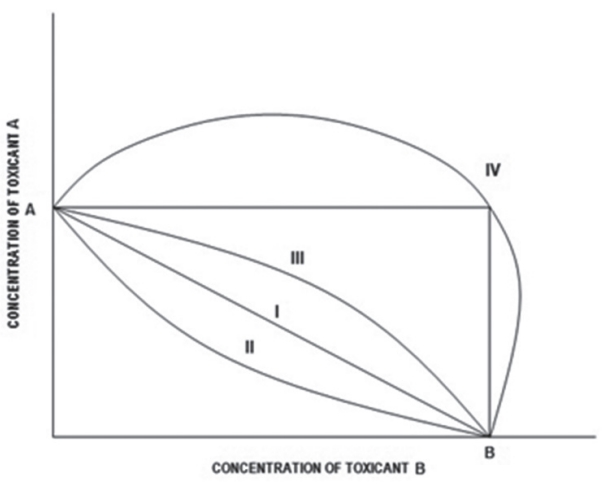
C1 and C2 are the individual concentrations of the substances 1 and 2 constituting the mixture. The sum of C1 and C2 equals the total concentration of the mixture that caused effect x. ΣTUx=1 describes additive action, ΣTUx <1, describes synergism, and ΣTUx >1 describes antagonism. LCx denote concentration that causes x% effect. The joint actions between two chemicals in binary mixtures are presented in form of isobolograms (Figure 1) [8]. Isobole I illustrates additive action; Isobole II illustrates synergism; Isobole III illustrates sub-additive action; Isobole IV illustrates antagonism.
Prediction of Mixture Toxicity
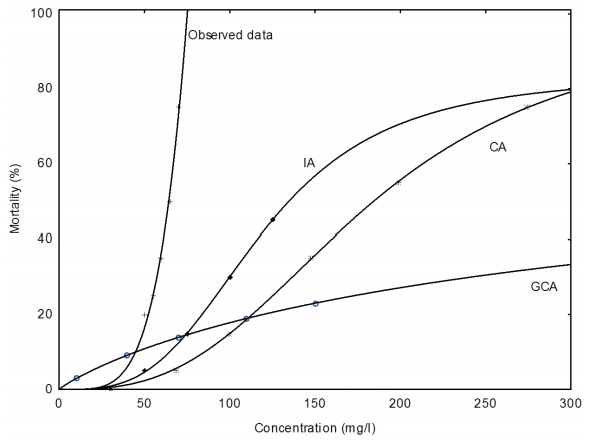
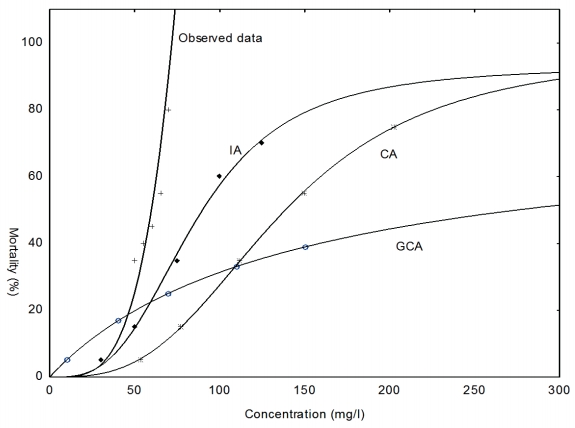
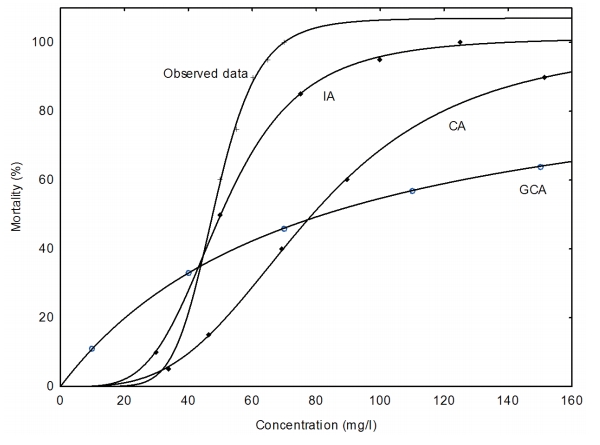
The prediction of mixture toxicity was based on the CA model, the IA model [10] and GCA model [9,13].This estimated concentration response relationship is then compared with the observed concentration response for the experimental mixture.
CA was modelled using equations (5) and (6). Calculations were performed for different given combined effects x and a graph of the concentration effect curve for the mixture was plotted and the LC determined by probit analysis.
where LCx mix is the LCx of a mixture, LCx1 and LCx2 are the equivalent LC values of the single pesticides 1 and 2 that alone would produce the same effect x as the mixture, P1 and P2 is the proportion of each pesticide 1 and 2 in the mixture calculated from their concentrations as
IA was modelled using equation (7). Emix is the effect of the mixture at a specific concentration; E1 is the effect of pesticide 1 at that specific concentration and E2 is the effect of pesticide 2. A range of concentration points were selected and the effects (E) were calculated, and a graph of the concentration effect curve for the mixture was plotted.
GCA was modelled using equation (8). The equation was adapted from Hadrup et al., [16]
E is the effect of the mixture at a specific concentration. ‘max effect level A’ is the maximal effect level of pesticide A, [A] is the concentration of A in the mixture at a specific mixture concentration, LC50A is the LC50 value of A, while ‘max effect level B’ is the maximal effect level of pesticide B, [B] is the concentration of B in the mixture at a specific mixture concentration, LC50B is the LC50 value of B. Thus for a range of mixture concentrations, effect values E) were calculated and concentration-mortality curve was plotted.
Compliance between the Predicted and the Observed Mixture Toxicity
In order to quantify the compliance between the predicted and the observed toxicity of the mixtures, the model deviation ratio (MDR) [17] was calculated using equation (9).
where MDR = 1 indicates perfect compliance between predicted and observed toxicity of the mixture, MDR > 1 indicates that the mixture is more toxic than predicted (i.e. an underestimation of mixture toxicity by the models), MDR < 1 indicates that the mixture is less toxic than predicted (i.e. an overestimation of mixture toxicity by the models).
The MDR values were calculated for all effect levels (5%, 50% and 95%) for which the respective estimates for the single substances had been determined.
Statistical Analysis
The concentration-response data of each pesticide was analyzed using the probit method [18]. Similarly, the probit method was also used to analyse experimental and model derived toxicological data for the pesticide mixture. The indices of toxicity measurement derived from the probit analyses were; LC5 (Lethal concentration that causes 5% mortality of exposed organisms), LC50 (Lethal concentration that causes 50% mortality of exposed organisms) and LC95 (lethal concentration that causes 95% mortality of exposed organisms). All statistical analysis was computed with SPSS version 22 except the isobole which was plotted with 2013 MS Excel, while the least squares method which uses the Levenberg-Marquardt algorithm was used to fit both the observed and the predicted values to plot the concentration-response graph using Statistica version 10.
RESULTS
Physicochemical parameters of test solutions
All the physicochemical parameters of the of the test solution presented in Table 1 were not different significantly except electrical conductivity and total dissolved solids of copper hydroxide possible due to the presence of copper ions in the copper hydroxide and mixture test solutions.
Mortality Count of exposed C. gariepinus
Table 2 shows the mortality pattern of exposed fingerlings.
Lethal Concentrations of Copper hydroxide, Glyphosate and the mixture for C. gariepinus. The estimated LC of copper hydroxide, glyphosate and the mixture that may cause mortality in 5%, 50% and 95% of the exposed catfish after 24, 48, 72 and 96 h is shown in table 3. The toxicity factor indicates that toxicity of the pesticides and the mixture increased as the duration of exposure increased. It also show glyphosate was more toxicity than copper hydroxide and the mixture.
Type of interaction between the Copper hydroxide and Glyphosate
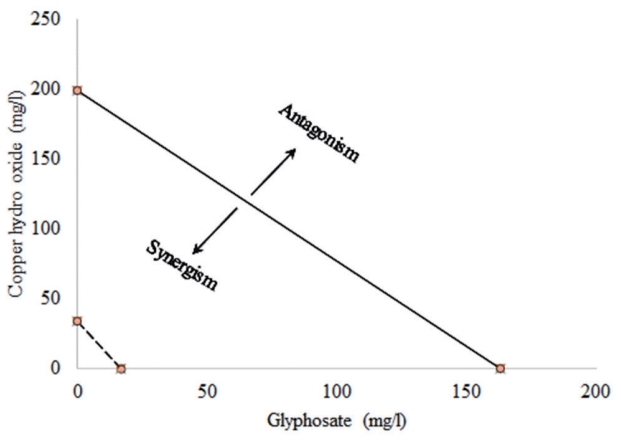
Result of the type of interaction between the copper hydro oxide and glyphosate as presented in Table 5, 6 and Figure 2 indicate that the interaction between copper hydroxide and glyphosate may be synergistic given that the SR1 and SR2 > 1 (Table 4), ΣTUx <1 (Table 5) and the isobole of the mixture was below the additivity line (Figure 2).
Figure 2 indicates a synergistic interaction between copper hydroxide and glyphosate in C. gariepinus. Although not depicted in the graph, synergism occurred at 24, 48, 72 and 96 h.
Prediction of the toxicity of copper hydroxide and glyphosate mixture
Table 6 summarizes the comparison of observed LCx and predicted LCx values.
In Table 7, the MDR values indicate that the CA model underestimated the 24, 48, 72 and 96 h LC5, LC50 and LC95 endpoints of the copper hydroxide and glyphosate mixture. However, CA model accurately predicted the 72 h LC5 of the mixture. Similarly, the IA model accurately predicted the 72 and 96 h. LC50 of the mixture. Nevertheless it overestimated the 48, 72 and 96 h. LC5 and underestimated 24, 48 h. LC50 and the 24, 48, 72 and 96 h. LC95 of the mixture. The GCA model overestimated the 24, 48, 72 and 96 h. LC5 but underestimated the 48, 72 and 96 h LC50 of the mixture.
DISCUSSION
The study evaluated the single and joint lethal toxicity of copper hydroxide and glyphosate, the type of chemical interaction of the mixture in C. gariepinus fingerlings, and predicted mixture toxicity using models. All the physico-chemical parameters showed optimal water quality for the survival of the fingerlings during the 96 h acute toxicity tests. Experimentally derived LC50 is used to classify the toxicity of a chemical as highly toxic, moderately toxic and slightly toxic if the LC50 is between 0.1-1 mg/L, 1-10 mg/L and 10-100 mg/L respectively. LC50 value greater than 100 mg/L are considered practically non-toxic [19]. In the current study, the 24, 48, 72, and 96 LC50 indicate that formulated copper hydroxide fungicides was practically non-toxic to C. gariepinus fingerlings while glyphosate was slightly toxic as the duration of exposure increased. The 96hr LC50 of active ingredient copper hydroxide reported in the current study for C. gariepinus is lower than the LC50 of 180 mg/L reported for Lepomis macrochirus (Bluegill sunfish) but higher than the 25 mg/L reported for Oncorhynchus mykiss (rainbow trout) [20]. Lower LC50 values 34.72, 31.90, 27.40 and 24.60 mg/L for 24, 48, 72 and 96 h of exposure respectively were reported for C. gariepinus juveniles exposed to glyphosate (Glycot®) [21].
Pesticides are essentially applied as formulated products thus it is appropriate to evaluate the acute toxicity of commercial pesticides mixtures. In this study, the binary mixture of copper hydroxide and glyphosate was slightly more toxic to C. gariepinus fingerlings than each pesticides acting alone as the 24, 48, 72, and 96 h LC50 values of the pesticide mixture were lower than those of the pesticides alone. It is likely there was synergistic interaction between glyphosate and copper hydroxide which may have influenced the toxicity of relatively non-toxic copper hydroxide fungicide. Although the underlying mechanisms of the combined action is not clear, it is likely that inhibition of biotransformation enzymes by copper may have decreased the metabolism of glyphosate leading to increase accumulation to LC in the fish. The mechanism of toxicity of glyphosate in fish may involve multiple mechanism including oxidative stress, inhibition of acetylcholinesterase and genotoxicity, while copper is an osmo-regulatory toxicant which can cause inhibition of enzymes including biotransformation enzymes such as cytochrome P450 associated monooxygenase [22, 23]. Toxicants which influence the amount of biotransformation enzymes can influence on the toxicity of other chemicals [24].
The risk of individual chemicals is less than the risk of a mixture of chemicals, thus understanding the effects of pesticide mixture is critical to the ecological risk assessment of pesticides [25]. Predictive models play important role in this regard. In the current study, the IA model provided a better estimation of the observed response compared with the CA and GCA. Although CA performed better than the GCA model. IA predicted the 72 and 96 h LC50 of the mixture while CA the 24 h LC5 of the mixture. Mixtures of toxicants with dissimilar mode of action tend to follow the IA model which is the case in the current study [26,27]. The CA model may have underestimated the observed response because the components of the mixture may have failed to meet one of the criteria of the CA model, which is the similar as the response shape of Tanaka and Tada [11]. In this study, the response curve of copper hydroxide was much steeper than that of glyphosate and this may explain some of the underestimation of the mixture effects by the CA model. Wang et al.[28] showed that deviation of the mixture toxicity predicted by the CA model would occur when the components have significantly different slope from each other. Tanaka and Tada, opined that components with steeper response curve may be more biodegradable and eliminated from the exposed organisms than the other component [11]. Again CA model is limited in that it can only predict up to the maximal effect level of the chemical with the lowest efficacy which in this case is copper hydroxide. The GCA is an extension of the CA model developed to overcome the limitation of the CA model and could not sufficiently predict the mixture effects [13].
This study showed that the commercially formulated glyphosate was two times more toxic than copper hydroxide to C. gariepinus and the mixture of both pesticide produced a synergistic effect which was better predicted by the IA model due to the different mode of action of the pesticides.