


Introduction
Air contaminants are generated in the dumpsites areas due to numerous reasons like open burning, uncaptured landfill gases, gases from the decomposition of natural matter, dust from poorly covered landfills, etc. [1]. The common dumpsite contaminants include particulate matter (PM), and other gaseous contaminants such as NOx, COx, and PAH [1–3]. Whilst the particulate contaminants are usually released into the surroundings, they most often cause severe effects on the environment with associated adverse human health consequences. Specifically, PM has been a dominant component in in most historical air pollution episodes, which include the London Smog of the Fifties, the Donora Valley (Pennsylvania), and Meuse Valley (Belgium) episodes [4,5]. Most particulate matter (especially fine particulates) have elusive sizes in the atmosphere. Typically, in the lower atmospheres, trimodal size distributions are generally known, with the nucleation mode having particulates less than < 0.1 μm diameter, accumulation mode having diameter of 0.1–2 μm, while coarse particle sizes have diameters greater than 2um [3,4]. This characteristic property of PMs, therefore, leads to the abundance of particles of the nucleation mode while a larger percentage of particulates by mass belongs to the coarse mode [6].
The gradual and consistent environmental pollution, the poor ambient air quality in the cities as a result of industrialization and urbanization in addition to the dynamic processes of atmospheric radiation, transmission, dispersion, emission, and transformation influences the distribution and negative health impact of particulates [7]. The health effects resulting from PM pollution depend on the absorbed dose, the type or size of the absorbed PM, the individual susceptibility, and the aggravated doses of the PM’s in the urban atmosphere owing to tens (μg m−3) to hundreds of several PM loadings [7]. Similarly, unsustainable anthropogenic activities like open dumpsites have contributed to the increased levels of PM in urban areas in most developing countries, where more than 50% of the world’s population are living and are exposed to ambient atmospheric PM pollution [8].
The average human being breathes about 15 m3 of air every day including fine PM pollutants which causes serious health problems such as asthma, nose and throat irritation, irritation of the lungs, risk of cardiac arrest, bronchitis, pneumonia, allergies, adverse neurological conditions, reproductive defects, cancer, and even death [9]. Therefore, environmental, and human health risk assessments associated with PM pollution using the various risk classification schemes of PM are necessary for municipal open dumpsites to determine and monitor their exposure levels. In addition, high PM levels is a major concern to the vulnerable population, such as people living with heart and lung diseases, the elderly, children, pregnant females, and most especially people in the developing world where unsustainable open dumpsites are common and high levels of PM pollution or PM episodes are known occurrences [10,11].
The ecological and human risk assessment techniques are commonly employed to evaluate the effects of PMs on the human body. The human health risk assessment is a technique in which the extent of exposure to PM contaminants together with the life cycle impact assessment (LCIA) method is usually analyzed. [12]. It involves the use of occupant scenario which is based on the contaminant concentration levels, and usually further assesses the risk for a given amount of time to human health [12]. Several researchers [13,17] have conducted health risk assessment in some major dumpsites within Nigeria to evaluate the levels of criteria pollutants, suspended particulate matter, and fine particulate matter but there is no reported study on the PM emissions from dumpsites in Owerri metropolis. In addition, there is a paucity of data on particulate matter exposure and non-cancerous inhalation health risk assessment of dumpsites in the study area. Generally, two important types of exposure needed to assess the health risk posed by PM include lifetime and short-time exposure analysis [12,15]. The short time exposure data provides information for the prediction of long-time exposure and resident health risk are similarly estimated using the same procedure. The objective of this study, therefore, is to determine the concentrations of PM produced by dumpsites in Owerri metropolis and to quantify the existing health impact using pollution and cancer risk assessment techniques. To achieve this, concentration levels of PM from the dumpsites were measured using the EXTECH Instrument Video Particle Counter with in-built camera (Model VPC 3000, USA), with six channels which give the PM concentrations for PM 0.3, PM0.5, PM1.0, PM2.5, PM5.0& PM10.0.
Materials and Methods
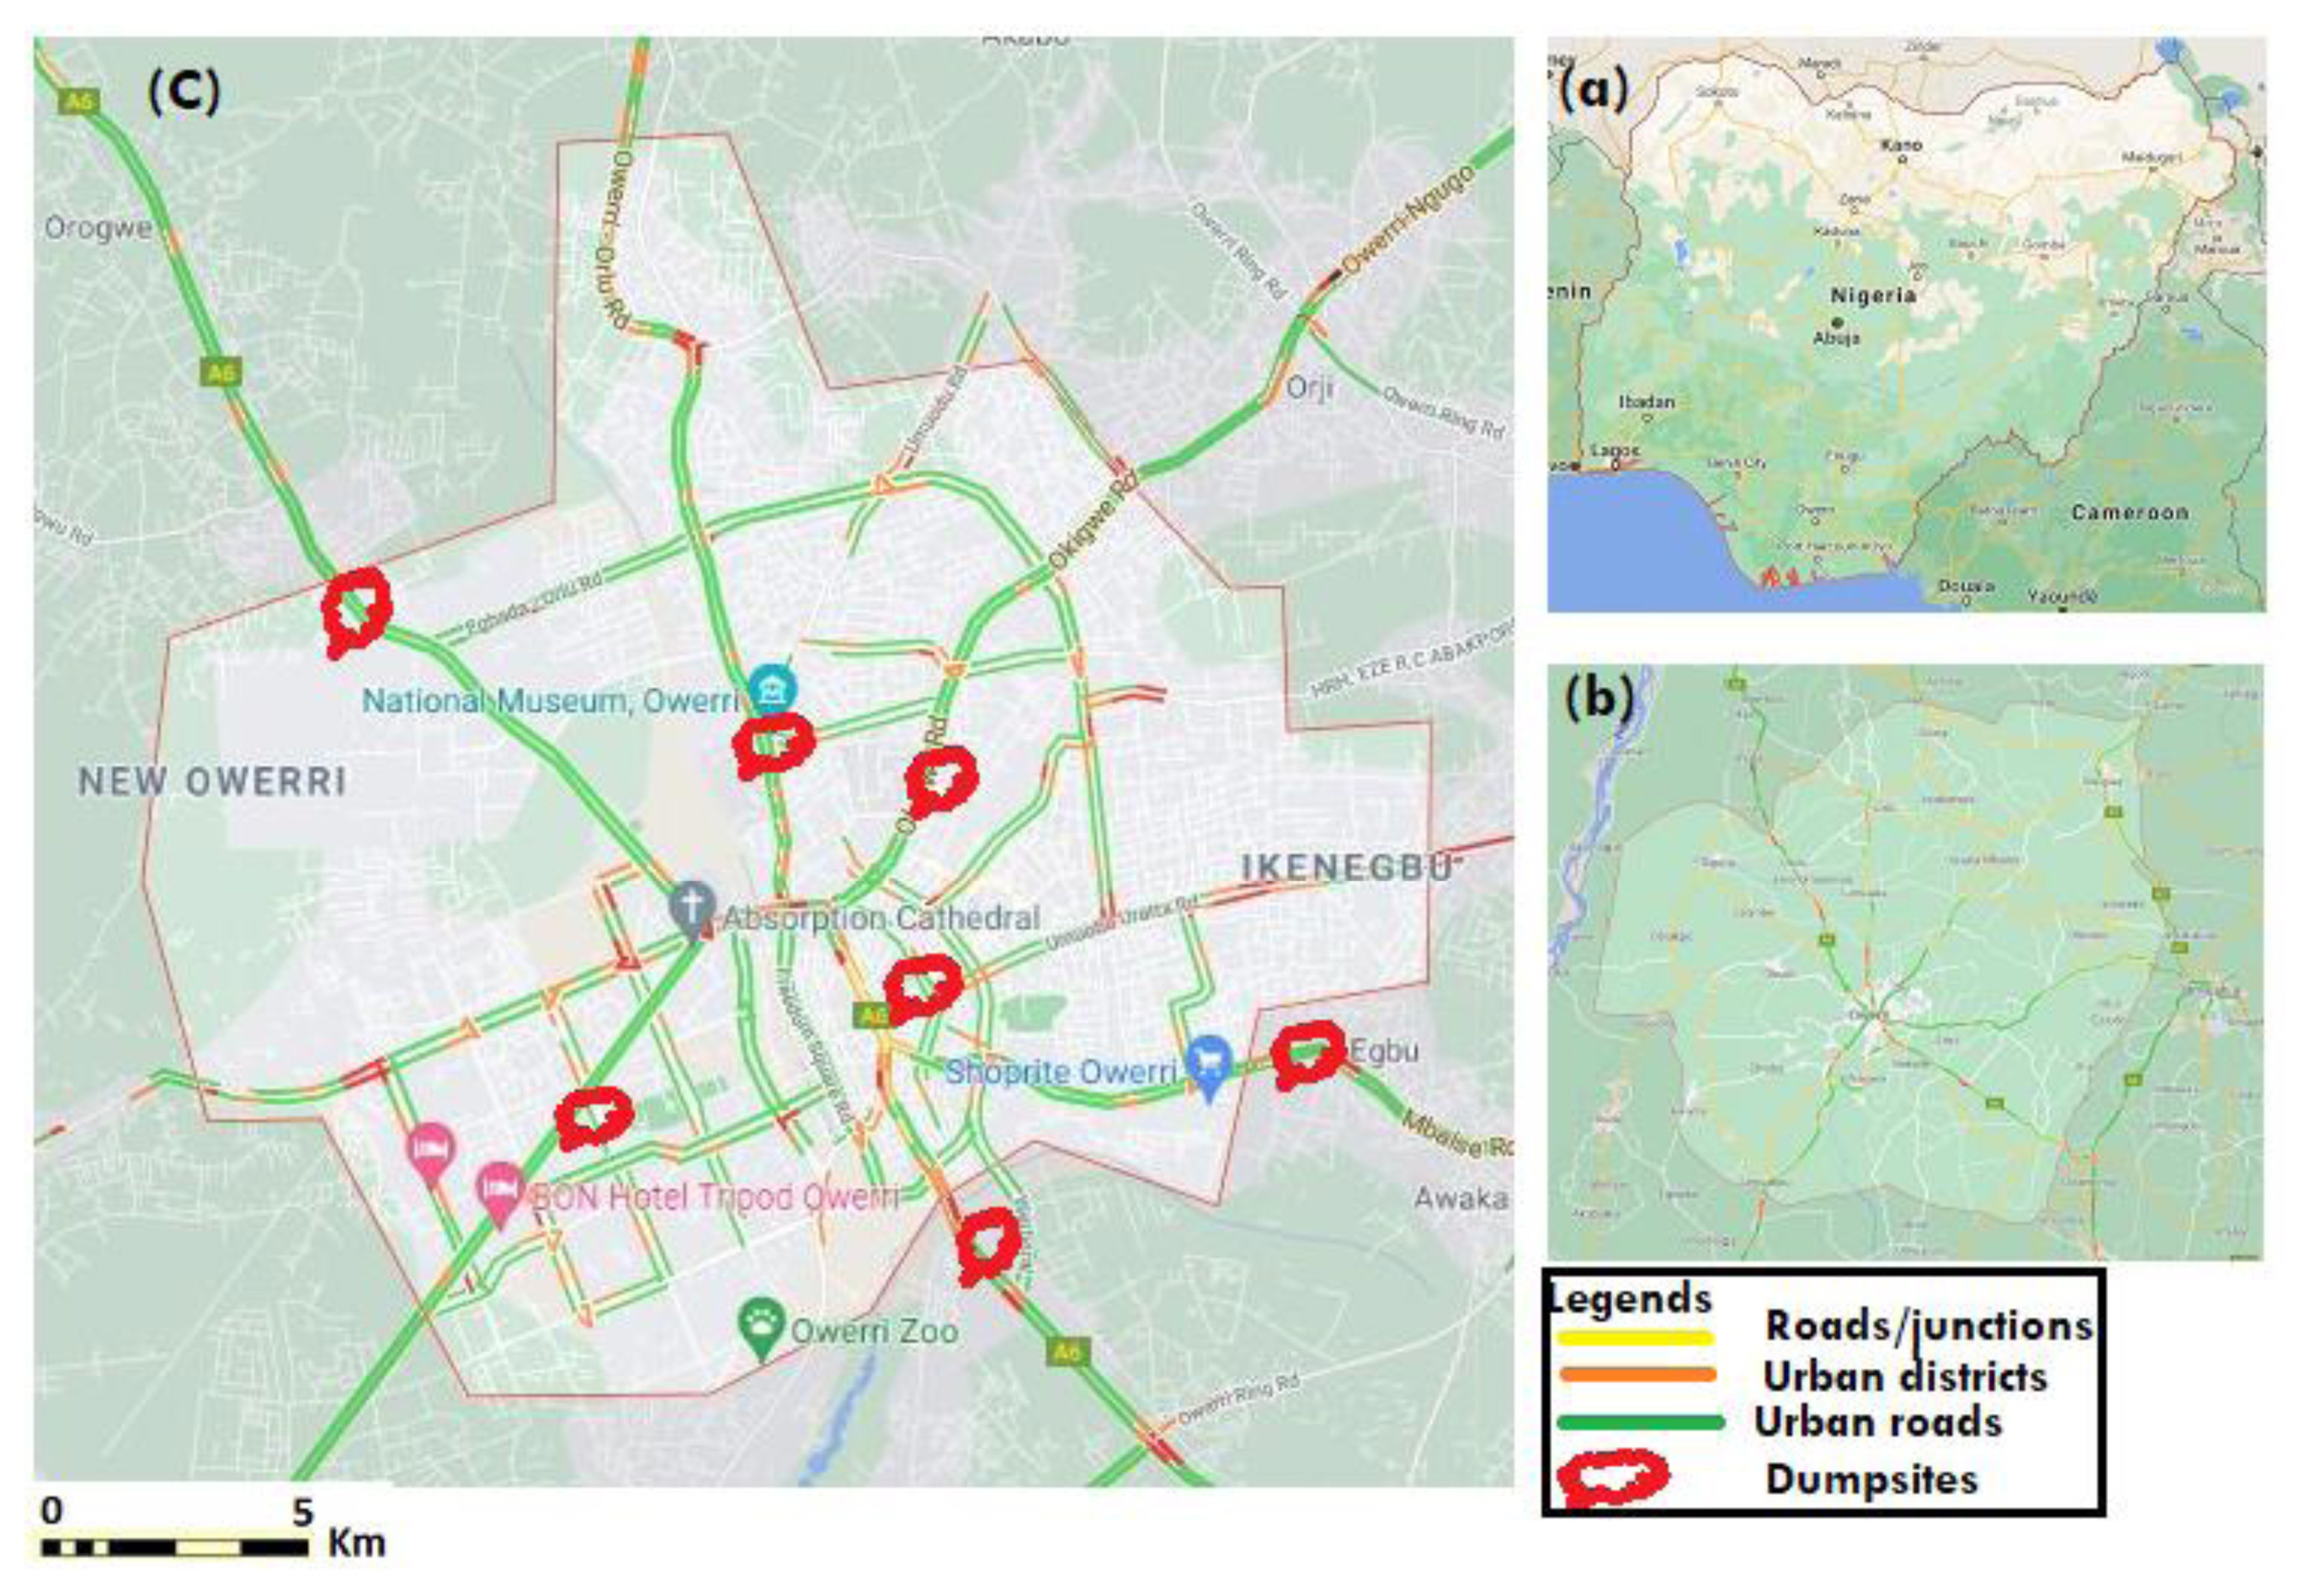
Site description
Imo State, Nigeria which is given by the geographical coordinates defined by longitudes 6° 40′ 02″− 7° 21′ 05″E and latitudes 5° 10′ 05″− 5° 56′ 12″N is predominantly a lowland located to the east of the Niger in southeastern Nigeria and covers a total landmass of approximately 5100 km2 as shown in Figure 1. The ambient atmospheric temperature which varies between 27–30° rarely exceeds the mean tropical climatic conditions, while the wind direction is predominantly northeast (2.5–4.3 MPH), thus driving a humid climatic region. The climate of Owerri, the capital city of Imo state falls within the rain forest belt of Nigeria with two distinct seasons mainly the rainy and dry seasons. High amounts of rainfall which varies between 1600–2900 mm and high relative humidity which ranges between 75–90% are typical weather conditions of Owerri metropolis and environs. The dominant sources of particulate matter in this study area include wood-burning, vehicular emissions, particles generated from cooking using fossil fuels, firewood, industrial emissions, and unsustainable open waste dumpsites. Furthermore, it is a common occurrence to observe road users and residents indiscriminately dump their domestic and industrial wastes by the roadsides. Observations thus showed that 75–90% of the refuse dumped by several motorists in the area were not bagged, another 95% were uncovered, and only 10–15% of waste disposed off in the dumpsites are carefully bagged at the 9 different sampling locations. Specific sampling sites and their geo-referenced locations are shown in Table 1. Sampling was carried out during the dry season (January) of 2019 in Owerri metropolis for about 8 hours duration for two-time segments of Morning (7:00 am–11:00 am) and Evening (2:00 pm–6:00 pm). The sampling procedure was repeated in August for the wet season. During the dry season of 2019, less rain was observed as compared to other months of the season with prevailing higher day temperatures [18].
Sample collection and measurement conditions
The EXTECH Video Particulate Counter is a multi-parameter digital anemometer (Model no: VPC300) that was used for measuring the particulate matter concentrations across the seven (7) different locations. The instrument was tested, calibrated, and certified by FLIR commercial systems Inc., Nashua, the USA on 02/11/2018. The instrument has six standard particle counter channels which measures the 0.3, 0.5, 1.0, 2.5, 5.0 and 10 μm. The equipment mode usually shows the differential, cumulative, and concentration modes. Quality control was achieved by calibrating using the DM-001 procedure earlier described by the National Institute of Standards [11,15]. After the device was powered on, the current date, time, and units were selected. The point of zero-point was then set in the device by connecting the zero-count filter and selecting 0.5 μm channel to run to the end. Afterward, the iso-kinetic probe was connected and the duration, start delay, cycle, interval (30 s, 10 s, 3 cycles, 60 s) measurements were selected and validated for the 6-channels. This gas monitor measures PM10, PM5.0, PM2.5, PM1.0, PM0.5, and PM0.3 levels. The zero-count filter probe was air-dried at 80 °C for 20 mins, cooled in a desiccator, and weighed to the nearest milligram (5.01–5.05 mg) to convert data to microgram per meter cube. The concentrations for each gas determined was converted to (ug/m3) by taking the mass of the PM counter and divided by the volume of air with the volume of air determined as follows:
Data analysis
The particulate matter data were obtained from the sampling procedure described above. The arithmetic means, median, standard deviation, and coefficient of covariance were calculated from the data using Microsoft Excel 2010 and origin 64-bit 9.0 software. GIS/GPS and MATLAB 7.9 software were used in generating the general finite line model interpretations and spatial contouring of the data. The influence of meteorological parameters (wind speed, wind chill, temperature, relative humidity, dew point, and wind direction) on PM (0.3, 0.5, 1.0, 2.5, 5.0, 10.0) measurements were also investigated. The data acquired with GPS were fed into the Arc GIS 9.3 software version, while the plot of coordinates against the seven locations in the Owerri metropolis was determined using MATLAB 7.9 version software [19]. Finally, the data were used to carry out a human health risk assessment.
Human Health Risk Assessment (HHRA)
The HHRA is a procedure that involves the inclusion of possible negative effects arising from human exposure to toxic substances. The HHRA that was used in this study comprises of four components: Hazard Identification (HI), Dose-Response Assessment (DRA), Exposure Assessment (EA), and Risk Characterization (RC).
The hazard identification of respiratory suspended particulate matter (PM 2.5) and suspended particulate matter (PM10) as harmful and potential health risks was outlined and discussed in key existing pieces of literature [20,21]. The DRA involves estimating the number of pollutants taken into the body as a function of the concentration and length of exposure. DRA was performed in this study and was also compared with the Nigerian National Ambient Air Quality Standards (NAAQS) which is the benchmark for our data in Nigeria.
The exposure-response assessment (DRA) was performed by determining the PM concentration with respect to time activity data es expressed in the equation below.
The Cj is known as the particulate matter concentration determined in the dumpsite (j) and tj is the total spent in the dumpsite (j). Inhaled rate (dose) (IR) was taken from Table 2 by multiplying the exposure concentration in each dumpsite by IR as described in equation 5. The PM contribution from the dumpsites to the daily exposure and daily inhaled dose was calculated using equations 6 and 7.
EA is a tool that identifies the population exposed to the hazard, magnitude, and exposure duration to the hazard. The current study assumed that the inhalation route is the major route of exposure to the measured pollutants at the dumpsites. Furthermore, the present study utilized a scenario assessment method for normal average exposure (24-hr-immediate) and worst-case scenario (chronic-annual) exposure periods, as well as the normal acute 1 hr. exposure periods. These referenced doses and their calculations are shown in Table 2.
For non-carcinogenic pollutants exposure, the acute exposure rate equation is used as shown below [19,21].
Where AHD is the average hourly dose for inhalation (μg/kg/hour), C is the concentration of the chemical (μg/m3), IR is the inhalation rate (m3/hour), and BW is the body weight (kg).
For exposure to non-carcinogenic pollutants, the chronic exposure rate is given in equation 9 below [19,21].
Where ADD is the average daily dose of the chemical of interest (μg/kg/day), C is taken as the amount of the chemical in ambient air (μg/m3), IR is the inhalation rate (m3/day), ED is known as the exposure duration (days), BW is same as the bodyweight of the exposure group (kg) and AT is the averaging time (days) [19,21].
Exposure duration ED was calculated as:
Also, the difference is that exposure duration (ED) is obtained when duration exposure (DE) in years is converted to days by multiplying DE with exposure frequency (EF) and exposure time (ET)
Where ET is the recorded exposure time (hour/day), EF is the exposure frequency (days/year), and DE is the duration of exposure (year). The standards are shown in Table 2 above. The EF, DE, and the AT values of the exposure duration are also shown in Table 2. Furthermore, it shows the estimated values of ET for each population group, the IR and BW values.
The hazard quotient (HQ) shows the probability of adverse health effects occurring among healthy and sensitive groups of people. HQ is given as where REL is the dose at which significant adverse health effects occur in exposed groups compared with the unexposed group. Reference exposure level (REL) was taken from the office of the environmental health hazard assessment (OEHHA) and the RELs used are presented in Table 2. The hazard quotient (HQ) is calculated as shown in equations 11 and 12:
An HQ of 1.0 is considered to be the benchmark of safety. HQ that is < 1.0 indicates a negligible risk; that is, the pollutant under scrutiny is not likely to induce adverse health effects, even to a sensitive individual. HQ >1.0 indicates that there may be some risks to sensitive individuals as a result of exposure [12,20,21,24].
Results and Discussion
Particulate Matter Concentrations
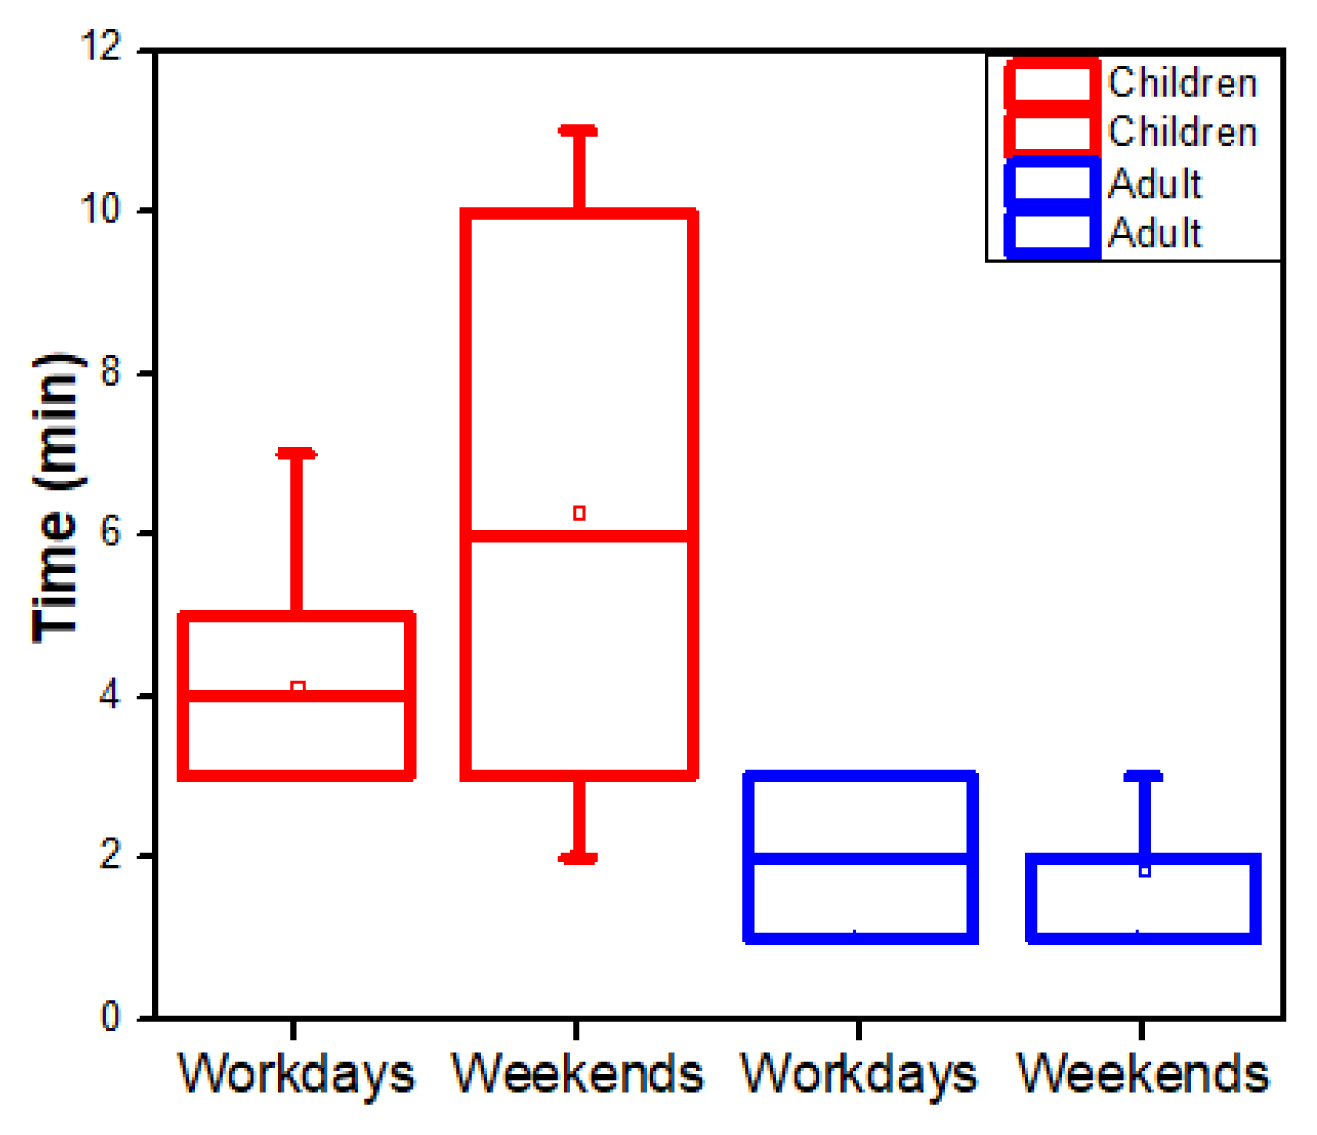
From Table 3 it was observed that children spent more time at the dumpsites than adults. During workdays, children spent 24.13% of their time at the EER dumpsite and followed by OOR while on weekends they spent more time at EER (22.72) and TER (25.00). The reason is that most of the children were at home 14:00 and 17:00 and spent ample time during evenings in the vicinity of the dumpsites. By the weekend, the time increased for almost all dumpsites except OAM owing to an increase in leisure playtime. The average time spent by adults was smaller compared to the time the children spent in the vicinity of the dumpsites.
The use of a private car was commonly used by adults to bin their wastes. In the mornings, a stop by is made and the waste is binned. During weekends they take a little more time to carefully dispose of their wastes. Hence, children and adults’ exposure to particulate matter pollutants occurred at different levels at the dumpsites. The graphical plot of the time spent by the various groups close to the dumpsites is shown by the box and whiskers plot (Figure 2). Time spent by children at the dumpsites increased during weekends, and also a greater number of adults spent an average of 2 mins at the dumpsites during weekends. During workdays, it also showed that the average time spent by children was 4 mins while adults spent about 2 mins. Hence children are at greater risk of inhalation of particulate matter than adults.
Based on the data obtained from the sampling locations, the different concentrations of PM were determined according to the sizes and diameter of the particulate matter. From Figure 3, observations show that PM0.3 had the highest concentration for the two seasons of January and August. The maximum was at NNR dumpsite in January with concentrations of about 1300 μg/m3 and the lowest achieved was at EER dumpsite in August with a concentration of 450 μg/m3 which exceeded the highest measured concentrations of PM5.0, PM1.0, and PM0.5. The levels of PM5.0 were below 100 μg/m3 in January in all dumpsites but varied in August owing to weather conditions [25]. Similarly, the seasonal variation resulted in higher levels of PM0.5 at TER, OOR, and AER dumpsites in August and lower concentration levels around NNR, OAM, and UMR dumpsites. A sharp decrease was observed for PM0.3 at EER in August from 1200μg/m3 to 450 μg/m3 while the PM1.0 levels at EER increased significantly. Hence it believed that the background concentration values change according to the local scenario (coarse and fine) of atmospheric PM because ambient atmospheric PM concentrations are subject to local weather conditions [26,27].
The concentrations of PM2.5 ranged from 122.30–501.76 μg/m3 at OAM and NNR dumpsites in August. Furthermore, maximum PM 2.5 Concentrations was 1662.98 μg/m3 at OOR while the lowest was at OAM dumpsite with a concentration of 119.17 μg/m3. This thus revealed that the PM concentration levels at the dumpsites exceeded the WHO 24hr annual mean maximum exposure limit. On the other hand, PM10 concentration levels in January and August did not exceed the 24hr WHO exposure limits [28]. Both the NNR, TER, AER dumpsites in January and August exceeded the WHO annual mean exposure limit and hence pose a health risk to the residents and occupants within the area. The allowable limit for PM2.5 according to Nigerian (NAAQS) is 35 μg/m3 and only NNR exceeded this exposure limit. The Nigerian (NAAQS) allowable limit for PM10 is 150 μg/m3 and when compared to the data from this study showed that both OAM and UMR dumpsites in the study months did not exceed the Nigerian allowable limit. Hence, a further health risk assessment was performed for inclusion of possible negative effects arising from human exposure to toxic substances [28,30].
The HQ from the health risk characterization from the exposure to PM10 and PM2.5 is provided thus indicating the green baseline of HQ = 1 as shown in Figure 4. The results showed that under normal conditions, PM10 has the least hazardous potential when considered for infants, children, nor adults on acute or chronic bases [30,31]. In January, during the normal and worst-case scenario, neither infants, children, and adults will be affected by PM2.5. On the contrary, the month of August recorded all PM2.5 sampling points to have exceeded HQ > 1 except at OAM and UMR. Hence the residents are at risk of developing health risk related problems from both chronic and acute exposure at these locations. Again, the month of August observed all exposure levels to have HQ < 1 and thus reveal results that are not likely to induce the expected adverse effect. However, in January, infants may likely experience health effects after chronic exposure to PM10 [33,34].
Metrological Data
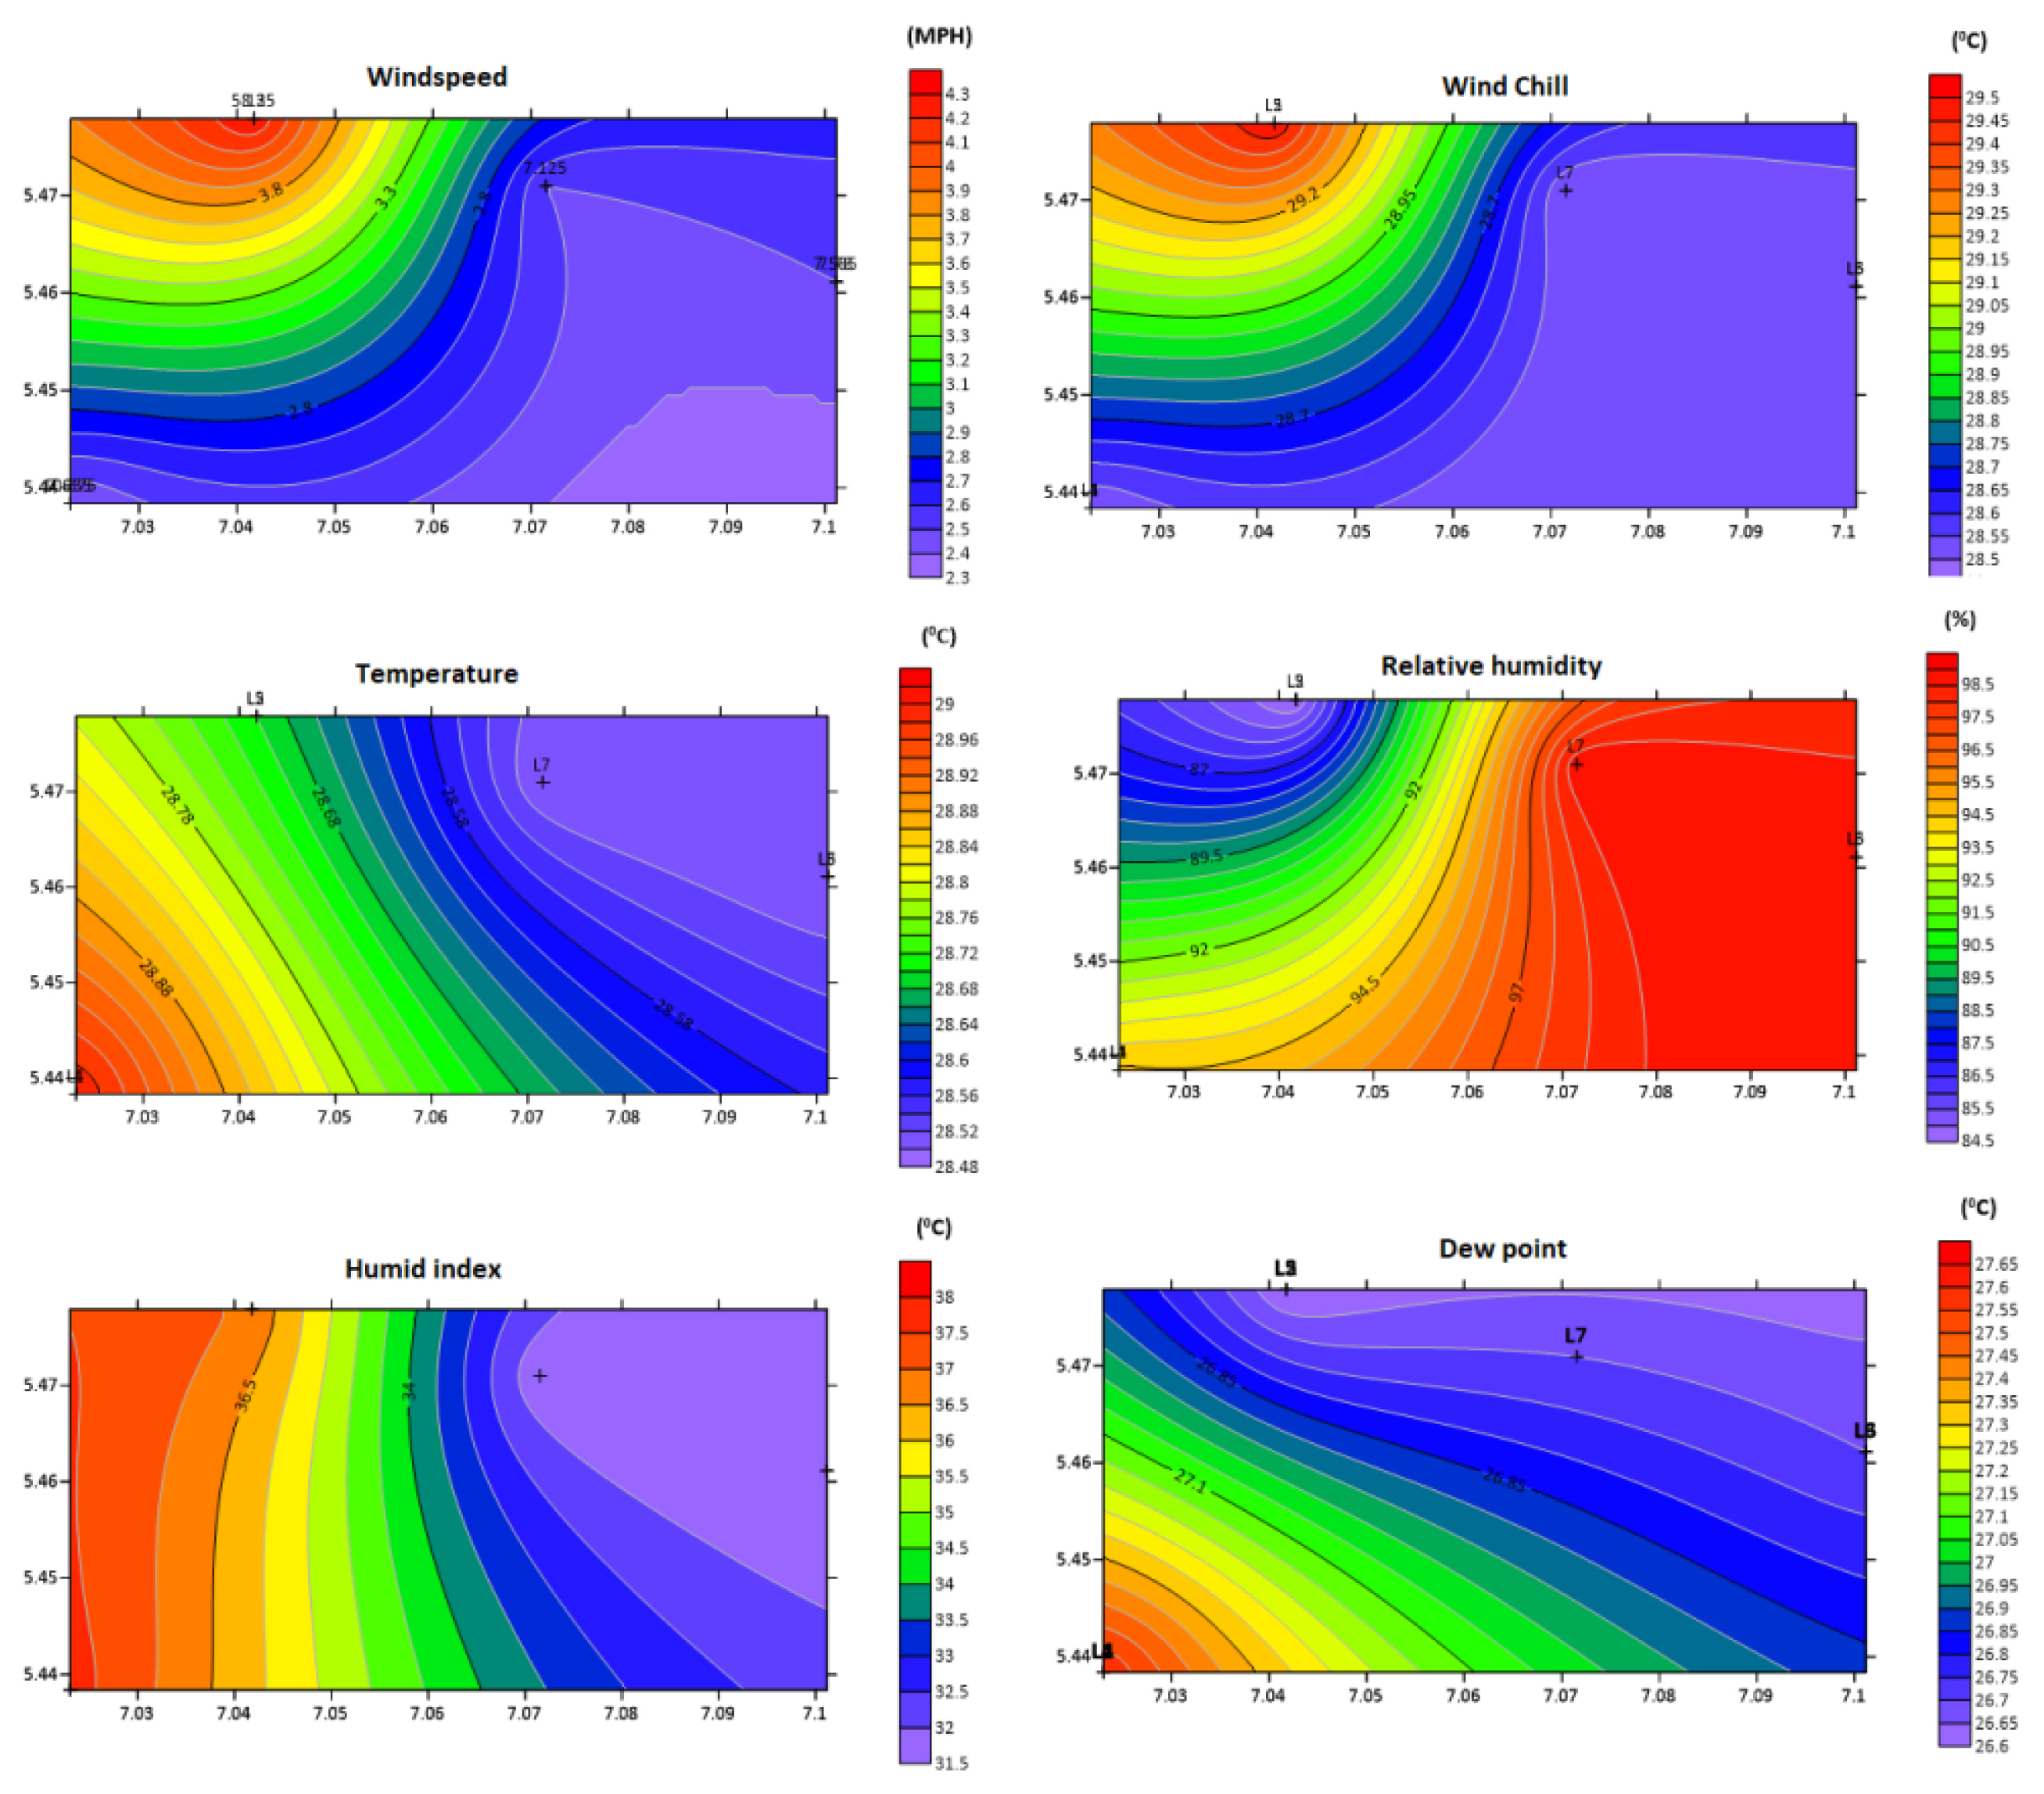
Table 4 presents the measured metrological data in tabular form. It depicts high wind speed activity and wind chill at TER station. The highest temperature measurements were at NNR and EER while the relative humidity was low when compared to Figure 5. In addition, the humid index and dew point were revealed to be highest in EER. Hence metrological parameters were most active at Ezeogba Emekuku Road (EER) with a remarkable low elevation level comparable to only NNR location.
Figure 4 refers to the metrological parameters determined from the study locations. Wind speed ranged from 2.3–4.3 (MPH) while the wind chill varied from 28.5 to 29.5 °C [35]. Hence, the wind speed was observed not to have adversely influenced the movement of particulate matter. The temperature ranges from 28–29 °C within the same range as the wind chill which agrees with the conditions of the sites described as the warm tropical region. The relative humidity showed higher activity > 94.5%, while the humid index ranges from 31–38 °C and is suggested to be the key role player during the dry season. This finding agrees with previous outcomes that July–September often presents the highest rainfall in Nigeria [36,37]. Furthermore, relative humidity is an indicator or precursor to the occurrence of precipitation [38]. Moreover, the high dew point values (26.6–27.6 °C) showed that there was an ongoing high rainfall activity with consequent deposition of particulate matter on the leaves and branches of plants and surrounding soil. This deposition is recurrent because, there is a high proportion of cloudy days, in August relative to low solar energy and low temperature during the same wet season [39].
Conclusions
PM2.5 exceeded the WHO 24hr annual mean maximum exposure limit. On the other hand, PM10 concentration levels in January and August did not exceed the 24hr WHO exposure limits. The acute and chronic PM2.5 and PM10 concentrations recorded in January and August did not pose any health risk challenges. However, the PM2.5 HQ levels in August are a major concern while infants are likely to experience health challenges due to exposure to PM10 in January. Therefore, the data thus revealed that PM2.5 and PM10 levels may cause health-related challenges in Owerri Metropolis. Future campaigns should be encouraged, and findings could guide the development of improved protocols for waste disposal in Owerri metropolis and environs.