


Introduction
Children are more vulnerable to environment pollutants due to their developing nervous system, respiratory system and small size [1-3]. Pollutants of much concern include polycyclic aromatic hydrocarbon (PAHs) which have been listed as carcinogens, mutagens and toxicity effects. PAH are a group of persistent, bio-accumulative and toxic compound (PBT) and their rate of exposure to children is higher than for adults.
Chemically PAHs are a group of over 10,000 compounds made up of two to seven benzene rings usually considered as PBT compounds. There are three classes of PAHs in the environment in terms of their sources, namely biogenic, petrogenic and pyrogenic. It is therefore not surprising that those compounds are ubiquitous in the environment. Exposure pathways are complex and include air, soil, food, toys, shoes, carpets, cars, etc. [2].
Health risk and dietary exposure of PAHs in bread were assessed by Bouwman et al. and Effiong et al. [4,5] who concluded that if not checked these pollutants could constitute a body burden for Nigerians. Also, they determined PAHs in commercially available fish and concluded that incremental lifetime cancer risk that fish species consumed in Nigeria could induce carcinogenic effects.
In Nigeria, children are likely to be exposed to PAHs through drinking water, dietary intake, inhalation of air born particulate or smoke containing PAH. Gurjar et al. limited the assessment on biomarkers despite the fact that PAHs occur as a mixture of compounds and no one biomarker may represent all individual compounds found in the mixture from a single source [6].
Several PAHs have been listed as potential human carcinogens with growing concern about children health. Some researchers have highlighted that there is potential for PAHs to be both mutagenic and toxic [7-10]. Carcinogenic, mutagenic and reproductive toxicity of PAHs to children, lung cancer in children [7], skin cancer [8, 9] neural tubes reflect and immune system alteration [10, 11] and behaviors associated with attention deficit hyperactivity disorder (ADHD). It listed many effects caused by exposure to PAHs in children [12].
Much information is yet to be known concerning PAHs for instance the ability of the chemicals to reduced health effects with a short time is not understood, such as eye irritation, nausea, vomiting, diarrhea and lack of concentrations are common when exposed in human, which mixture is responsible for their system is yet to be studied. Though anthracene (Ant), benz[a]pyrene (BaP) and naphthalene (Nap) cause skin irritations, Ant and BaP are used for skin sensitizers. Perera et al. showed that prenatal exposure to PAHs could cause abnormal behaviors in 6-7 years children in Columbia, United States [13].
The health concerns of PAHs are now well established and many studies have shown increased incidences of cancer of the lungs, skin and urinary cancers in both adult and children exposed to mixture of compounds. Many reputable organizations and agencies have published researches supporting these health effects and have listed PAH compound as possible carcinogens (National Toxicology Program, Environmental Protection Agency (EPA). According to the superfund research program PAH may cause asthma related chronic obstructive pulmonary disease (COPD) in children. In a research by the German Environment Agency children were found to have more PAHs biomarkers than adult [12].
Literature reveals that children have not been given attention as regards exposure to PAHs from their environment [13-15]. In Nigeria, children are exposed to PAHs much more because of many factors including low literacy and less enforcement of environmental laws. The question of costs and benefits is an ethical issue that society must also consider. Children have the right to realize their full potential and when a society allows children to be exposed to pollutants unchecked it is directly denying the children of that right. There are a few researches on PAHs done in Nigeria, mostly on foods and water, while works on blood and urine samples are scarce in Nigeria. This could be due to difficulties in handling biological samples and lack of appropriate instrument for such studies. The aim of this research is to analyze 15 PAHs out of the 16 listed as priority chemicals of concern to health [12, 16-18] in blood and urine from children exposed in various ways from playgrounds. In order to realize the aim some specific objectives were following; (1) to determine PAHs in children’s blood and urine, (2) to develop basic trends to aid understanding of the current conditions of PAHs contamination (3) to correlate data to determine the linkages in information obtained.
Methodology
Description of the study location
Owerri metropolis, lies within latitude 5.48˚ north and longitude 7.03˚ Imo State, southeast Nigeria. This area falls within the heart of the humid tropical region. Owerri metropolis lies within one of the three local government areas (LGAs) that make up Owerri city, the capital of Imo state of Nigeria set in the heart of the Igboland. Out of 25 government schools playground within Owerri metropolis, 9 were selected for this study. Playgrounds were selected to reflect spatial variability and traffic/commercial influence associated with each zone, as well as differences in land use within an urban setting. Samples were collected from schools; along busy roadway/ highway, within residential, commercial and industrial areas, along a zone where industries and factories are located. These sampling sites included 9 playgrounds: housing estate Owerri (HEO); Madonna Owerri (MNO); Shell camp (SCP); Central school Owerri (CSO); Township school Owerri (TSO); Primary school World bank (WSP); World bank primary (WBP); Ikenebu school (IKS); Urban primary school (UPS).
Participant demographics
In total, 36 children residing on the Owerri municipal were recruited as follows; 2 boys and 2 girls in each school. Child participants were 18 boys and 18 girls whose 4-14 years.
Human subjects interactions
Approval was obtained from the Imo State University. Permission was obtained from the parents with written informed consent along with the child’s assent. Participants were met either in their home or at the school or health center closest to the school playground.
Biological samples
A written survey was filled out by each mother to capture diet, self-reported health, activity, and household information. Mothers were asked to provide the same information for their children. Fish consumption, roasted foods (such as cassava “Garri”) and cereals over the most recent three months were addressed along with consumption of local produce and game. Participant sample recollection was reinforced by a 24-hour recall survey. From children, biological samples were collected for analysis. Participants were instructed to give a mid-stream urine sample into acid-washed 120 mL urine cups. Intravenous blood samples were collected from the antecubital fossa following sterile procedures by a licensed phlebotomist into BD vacutainer tubes®. All samples were refrigerated at -4˚C in a locked freezer at the Imo state University chemistry laboratory for a maximum of six hours before extraction and analysis.
Extraction of PAHs
Liquid-liquid extraction was used in which 5 mL of each sample. Samples were extracted at room temperature with 15 mL of methylene chloride for 30 mins and then dried with 5g of anhydrous Na2SO4 in a rotary evaporator to enable further concentration. 25 mL of hexane was added and concentrated to 1 mL, finally 15 mL methylene chloride was added to the mixture. All sample was centrifuged at 3,000 rps, allowed to settle and the frozen. The organic portion was poured out into a 5 mL sample bottle and fractionated frozen blood was discarded according to Wells and Hess [17].
Sample analysis
The extracted samples were analyzed using the 6890 GC system. Accuracy was within 20% of expected values (mean recovery: 92.44% for urine, 95.07% for blood), and precision was within 7% relative standard deviation (RSD) (mean RSD was 5.10% for blood, 5.56% for urine), and was measured by injecting a 0.2 mL extract collected with a syringe and needle into the injection pot of the GC-MS system. The detection frequencies were all greater than 90%. The theoretical method of detection limit (TMDL) was 3 times the standard deviation of the mean blank value, which ranged from 5 to 19 pg/mL Samples for which concentrations were below limit of detection are noted in the results section with the measured value being retained.
Chemical and reagents
The PAH standard mixture containing the 16 US EPA priority PAHs (all>97% pure) were purchased from Sigma- Aldrich Chemie GmbH, Steinheim, Germany, by Fin lab Owerri. Performance reference compounds: acenaphthene –d10, fluorine-d10, phenanthrene-d10 and pyrene-d10 were sourced from Dr Ehrenstorfer GmbH, Augsburg, Germany. Naphthalene-d8, anthracene-d10, fluoranthene-d12, benzo[a]anthracene-d12, benzo[k] fluoranthene-d12, benzo[ghi]pyrene-d12, (Augsburg, Germany) were used as recovery standards [19-22].
Determination of PAHs
The PAHs of interest were determined by means of a 6,890 GC system coupled with a 5,971 mass selective detector (Agilent Technologies, California, United States). Chromatographic separation of the components was done with a capillary column (30 m × 0.25 mm internal diameter, 0.25 µm film thickness) HP-5MS and ultra–high pure (99.5%) scientific grade Helium from a steel cylinder gas code 200 as the carrier gas with flow rate of 1.5 mL/min. Conditions of gas chromatography separation was as follows: injector temperature was set at 250°C, initial column temperature was set at 70°C and held for 0.5 min. The temperature was increased to 25°C min-1 to 150°C, and then increased to 30°C min-1 to 200°C. This was further ramped to 8°C min-1 to 280°C and held for 20 min. Detection of the separated PAHs was achieved using a GC-MS system operated in single ion monitoring mode with the electron impact ionization set at 70 eV. The temperatures of the ion source, transfer line and the quadrupole was held at 230°C, 280°C and 150°C, respectively [23-26]. Quantification of the chromatograms was achieved as reported in similar methods by researchers [27-29].
Statistical analysis
PAHs concentrations were assessed normally distribution before transformations. In order to retain maximum interpretability, data was analyzed and reported without transformations. Statistical analyses were performed in SPSS version 18.0 [30]. Using correlations test, and primary comparisons of interest was differences between schools and amongst children were compared to values as seen throughout literature. Data was subjected to some carcinogenic and non-carcinogenic risk assessment.
The coefficient of variation (CV %) was calculated using the equation
It was used to estimate seasonal variation and others in heavy metal contents. Variation ranking was considered to be: CV % less than 20 as little variation; CV % between 20 to 50 as moderate variation and CV % greater than 50 as high variation. ANOVA was employed for the purpose of comparing mean metal concentrations among the playgrounds and statistically significant differences were described when P<0.05 [31].
Quality Control and Quality Assurance
Analytical grade chemicals and reagents purchased from FinLab Owerri were used without further purification. These include nitric acid, 6.5% v/v hydrogen chloride, sodium sulphate and potassium hydrogen carbonate were purchased from Merck through FinLab agents while double distilled water used for heavy metals analysis. Standard of PAHs for references were sourced from Fluka (Buchs, Switzerland). Precision and accuracy of analysis was assured through repeated analysis of samples against standard reference materials and results were found within ± 7 % and 20 % respectively of the certified values.
Results and discussion
Concentration of PAHs
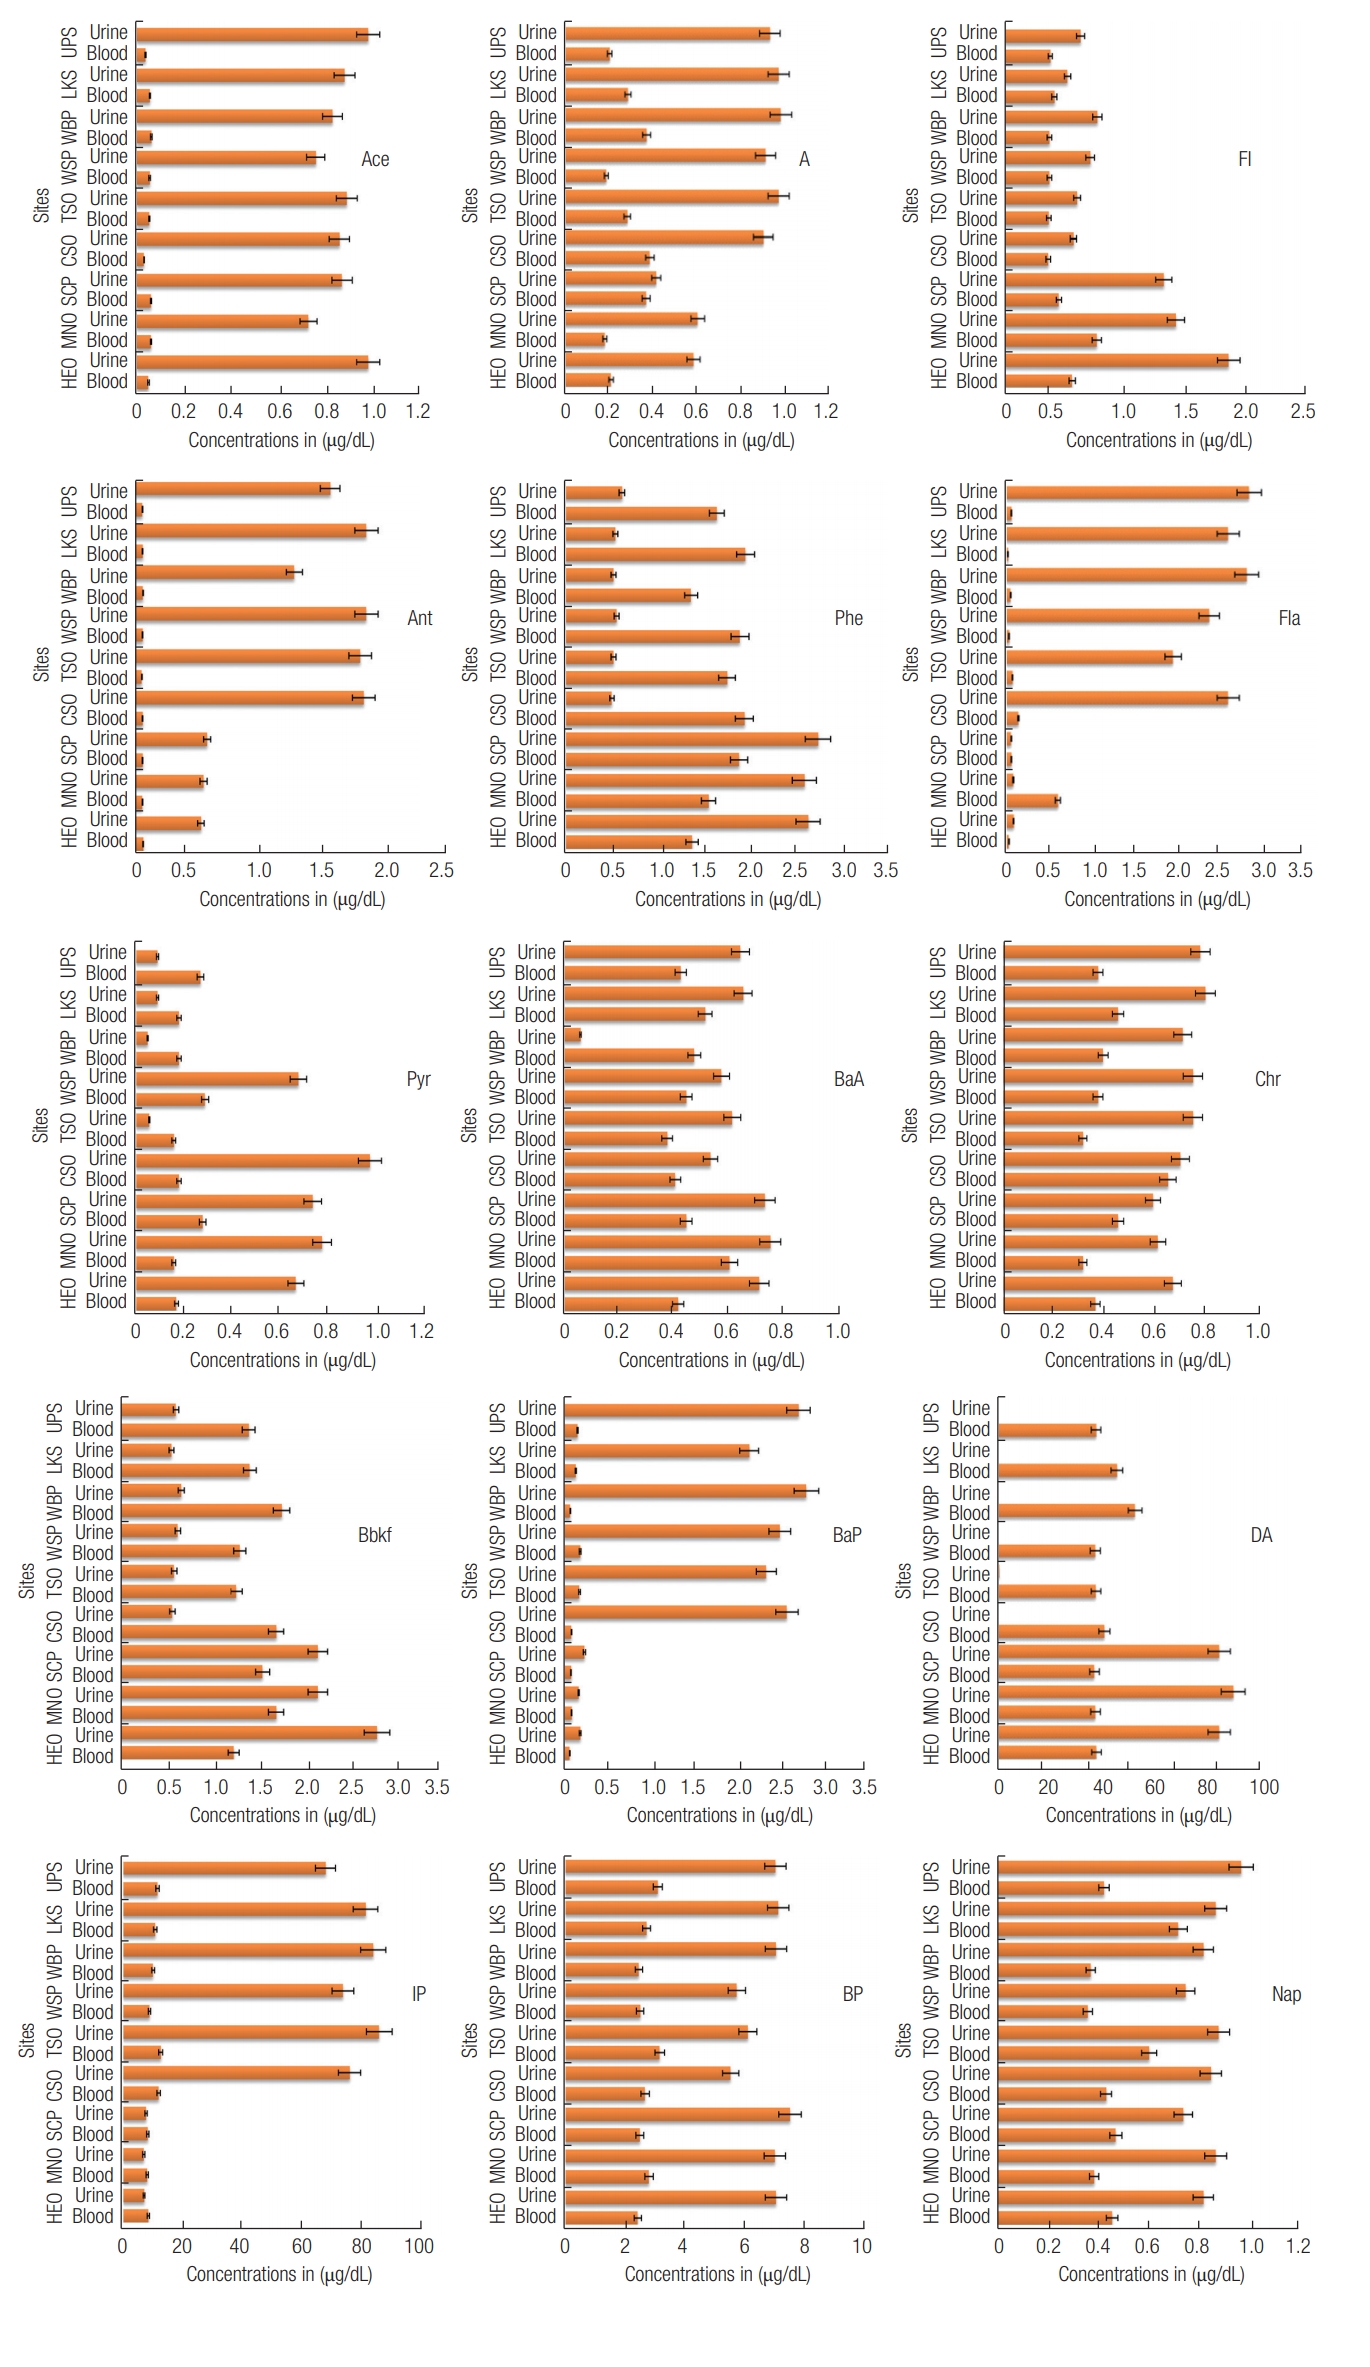
Children in comparison to adults are generally more at risks to both acute and chronic effects of environmental hazards. Children in the age group (6–11 years) have been reported in many studies to be more exposed to PAHs than children in the other age groups [32-33]. This study evaluated non-metabolized PAHs in children (age group 4-10 years) blood as biological markers and their metabolites excretion in urine. The concentrations of non-metabolized PAHs in children’s blood and urine from the different schools are presented in table 1. 15 PAHs compound have been found at varying concentrations, which include; Nap, acenaphthylene (Ace), acenaphthene (A), fluorene (Fl), Ant and phenanthrene (Phe) categorized as low molecular weight. Fluoranthene (Fla), Pyrene (Pyr), benzo[a] anthracene (BaA), chrysene (Chr), benzo[a]fluoranthene (Bbkf), BaP, dibenzo[ah]anthracene (DA), indeno[1,2,3-cd] pyrene (IP) and benzo[ghi]perylene (BP) categorized as high molecular weight. The categories are based on the number of rings, which impact their toxicity. The concentration of totalPAHs in blood ranged from 53.68 μg/DL at HEO to 70.48 μg/ DL at WBP with decreasing order rank of WBP >LKS>CSO>TS O>UPS>MNO>WSP>SCP>HEO. In urine, total PAHs ranged from 94.98 μg/dL at UPS to 115.04 μg/dL at MNO with decreasing order rank of MNO>HEO>SCP>WBP>CSO>TSO>WSP>LKS>UPS. Between schools there was no significant differences [p>0.05; df (degree of freedom)=134; Fcritical (2.21)>Fratio (0.02)] for blood and urine-PAHs [p>0.05, df=134, Fcritical (2.21) >Fratio (0.01)] by one-way ANOVA. Earlier this year similar analytical results for heavy metals were reported from the same schools [34] in which the researchers opined that similar anthropogenic disturbance experienced by the schools in Owerri could be the reason for the “no significant differences” between them.
On the basis of the individual compound in bloods and urines, the distribution from the different sites are plotted in bar charts and presented in Figure 1. Generally, higher concentrations were found in urine than in blood, perhaps because their occurrence does not depend on the biotransformation rate as happens for metabolite excretion in urine [35]. Furthermore due to the complex nature of PAHs, high content excreted in urine can be associated with recent exposure, while low excretion is assigned to low exposure or decreased ability to detoxify a particular PAHs compounds [36]. However, high levels of urine PAH were also reported for adolescents aged 12-19 years following National Health and Nutrition Examination Survey (NHANES) [37]. Abiodun et al., showed that PAHs pollution was more in Asia and Africa than elsewhere in the world [38]. It is therefore not surprising that elevated values of these pollutants were found in blood and urine in the current study.
The statistical analysis using one-way ANOVA revealed significant differences in the individual PAH compound concentrations in blood [p<0.05, df=134, Fcritical (1.78)<Fratio (465.13)] as well as in urine [p<0.05; df=134; Fcritical (1.78)<Fratio (1225.10)]. Similar analytical results were obtained for heavy metals in earlier report from the same children blood and urine [39]. All individual compounds showed variation ranging from no variation (0.00 %) to very high variation (141.67 %) in both blood and urine (Table 1). Ant showed no variation (0.00 %) in blood while in urine variation was low (< 50 %). Low variations was also recorded for the following metals in blood; Phe, BaA, Bbkf, DA, BP and IP. Except for Fla that showed very high variation (138.46 %), all other individual compounds were moderate (20-50 %). Similarly, Fla (141.67 %) and BaP (68.18 %) showed highest variability in urine. All other PAHs compounds exhibited low variability (< 50 %).
The most distributed compound was DA (> 60 %) in both blood and urine while Ace for blood and BaP for urine were least distributed. Previous biomonitoring studies in other countries have implicated high distribution for PAHs in children’s blood and urine [29,39-40]. However, distribution orders for all individual PAHs compounds from the studied sites were: for blood were Nap: LKS>TSO>SCP>HEO>CSO>UPS> M N O > W S P, A c e : W B P>SCP/MNO>LKS>WSP>TSO>HEO>UPS>CSO, A: CSO>SCP>WBP> TSO>LKS>UPS>WSP>MNO, Fl: MNO>HEO>SCP>LKS>WBP >UPS>TSO>WSP>CSO.
Association of PAHs in blood and urine
At 5 % level of significance, correlation analysis was determined and values showed how the individual PAHs are associated in blood and urine media. The correlation matrix of PAHs compounds in the children’s blood and urine are presented in Table 2. In blood, strong positive associations were exhibited by the following compounds; Fl and Fla (r=0.83), Fl and BaA (r=0.71), BaA and Fla (r=0.73), A and Chr (r=0.67) A and Bbkf (r=0.53), Chr and Phe (r=0.53), BP with IP (r=0.68) and BaP (r=0.58). While in urine, Phe showed strong association with BaP (r=0.66) and IP (r=0.55) respectively. Strong positive association was also exhibited between Bbkf and the following compounds Ace (r=0.53), A (r=0.63) and Chr (r=0.64). Further Chr showed strong positive association with A (r=0.57). These strong positive correlations found suggest eventual interactions between PAHs compounds. This can probably indicate an increase in their toxic effects through multi-compound contamination in children even at a low environmental level of exposure. Recent study by Mu et al. [41], showed that PAH metabolite in adult could induce a combined effects on lung function. Therefore stronger positive associations are undesirable.
Blood- and urine PAHs concentrations
Linear regression analysis was used to evaluate relationship between the concentration of PAHs in blood and urine of children in Owerri metropolis. The analysis provides information regarding if the excreted compounds in urine were from the blood, determined by the regression coefficient (r2). The strength of association is based on the closeness of r2 value to a unit (1). The relationship was presented in Figure S1 (Supplementary materials). Fig. S1, showing the r2 values and regression equations. All compounds exhibited low positive relationship except for BP (r2=0.559). The positive but low association suggests that the blood was not the only sources responsible for the excreted PAH compounds in urine. Some of the PAHs may have been metabolized in the blood. It is well known that metabolic activation of PAHs by cytochrome P450 (CYP 450) 1A1-catalyzed reactions generates electrophilic metabolites and other reactive oxygen species (ROS), which tends to bind covalently with DNA and also cause interference with cell homeostasis [9,42]. This process could reduce the amount of non-metabolized PAHs in urine. Equally worthy of note is that high value of excretion may cause a saturation in which another PAH compound is less excreted. These complexities may explain why a linear regression coefficient was low and may not be sufficient to describe PAHs in the children’s urine. However, the relationship order was BP>Ant>Chr>BaA>Phe> Fl>A>Nap>Pyr>Ace>DA>Bbkf>Fla.
Compositional profile
The compositional profile was computed according to the number of rings. The fifteen PAHs detected were classified into light (2–3 rings), intermediate (4-5 ring), and heavy (5–6 rings) PAHs. The heavy rings were dominant in both blood (up to 45 %) and urine (up to 90 %) shown in Fig. S2 (Supplementary materials). There is a high distribution for DA in both blood and urine with the order of distribution in blood being DA>I P> B P> P h e > B k a f > o t h e r s , w h i l e D A > B P >IP>Phe>Bkaf>others in urine. The high molecular weight (HMW) PAHs dominating the children’s blood and urine could be from their exposure to contaminated soil from their school playgrounds or from their diet. High PAH levels have been found in grain-based products, such as cereals and foods that are grilled, smoked, or charbroiled [43-45]. HMW PAHs are non-volatile, non-biodegradable and less water-soluble and they are usually adsorbed onto soil or sediments [46-47].
Light ring (2-3 rings) compounds may be low in the composition of PAH mixtures but may have irritative effects and cause respiratory diseases, other health hazards due to multicompound contamination as revealed by the correlation analysis. For instance, naphthalene, a two-ringed PAH, classified as a class 2B that is possible carcinogen to humans [47], may also increase chances of health hazards of those not yet declared hazardous through association with them.
Carcinogenic and non-carcinogenic
The PAHs recorded were grouped into carcinogenic and non-carcinogenic load. The sum of all carcinogenic and noncarcinogenic PAH levels detected in an individual blood and urine sample was considered their total carcinogenic and non-carcinogenic PAH loads. The computed PAH loads for both blood and urine from the different schools are presented in Figure 2.
Overall, urine generally showed high load of carcinogenic and non-carcinogenic PAHs compared to blood. Blood and urine contained higher loads of carcinogenic PAHs than noncarcinogenic PAHs. These findings suggest that the children are at high risk of cancer. Epidemiological study and data from experiment revealed that children are at higher risk of cancer due to exposure to carcinogens compared to adults [48]. The high load carcinogenic PAHs are perhaps due to the big size of these compounds. Exposure of children to carcinogenic PAHs could be from playground soils in their respective schools and the environment. HMW PAHs are bound to particulate matter and also become settled along with dust particles [49]. Thus making them readily available for intake through pica action or by dermal route. Contrastingly, higher load of non-carcinogenic PAHs in comparison to carcinogenic PAHs was reported for blood in children of Lucknow, India [50]. The differences in results could be a local problem as each location experiences different anthropogenic disturbance, which influences the concentrations in children’s blood and possibly urine. For example, Singh et al. [50] explained that due to the ambient air quality in Lucknow and low molecular sizes of non-carcinogenic PAH, makes them easily transported in air and children inhale them from air through respiration than carcinogenic PAHs with high molecular sizes which tend to less airborne. This observation made is common for Indian environment which are somehow similar to Nigeria environment [51-52]. Other exposure route could from consumption of PAH contaminated water or food (e.g fish) [54-55].
Elimination ratios
Elimination ratios (ER) were computed as described in previous reports [14]. Ratios of PAHs concentrations in blood to urine were used to estimate the amount of PAHs excreted in urine from blood. When ER value is high, it means low excretion of the PAHs in urine and thus suggesting potential danger, while low ER values are indicative of good removal of PAHs in urine. ER ratios greater than 1 were considered to be unsafe level for blood. Computed ER trends for the different schools are presented in Fig. S3 (Supplementary materials). A critical look at the figures, it can be seen that high ER values for IP (> 1) was obtained in all schools. Fla was very high at MNO (6.8), other were high except at WSP, LKS, CSO and HEO which were low (< 1). High ratios suggest a harmful condition prevail while low ratios indicating a harmless situation. These low ER could be due to many excretion routs existing for PAHs in the body which include through bile, urine or feces. According to Agency for Toxic Substances and Disease Registry [56], PAHs are transformed initially to epoxides, which are converted to dihydrodiol derivatives and phenols. Glucuronide and sulfate conjugates of these metabolites are excreted in the bile and urine. Metabolism is a prerequisite for hepatobiliary excretion and elimination through the feces, regardless of route of entry. Excretion half-lives in feces and urine have been reported in animal studies as 22 hours and 28 hours, respectively [37]. However, the order of individual PAH compounds excretion in urine was Ace (0.06)>Ant (0.11)>BP (0.41)>A (0.49)>DA (0.50)>Nap (0.56)>BaA (0.61)>Pyr (0.62)>BaP (0.63)>Phe (0.67)>Chr (0.69)>Fla (1.36)>IP (1.53).
Conclusions
The concentrations of PAHs were successfully determined in blood and urine of children at specific school playgrounds within Owerri and results revealed elevated amounts above expectations. There was uniformity in trends of concentrations that suggest evenly distributed sources over the entire sampling location. Though this research was not concern about the sources of PAHs, the assumption that PAHs enter the children from foods, water, soil, air and toys, could be a possible explanation to the uniformity in observed PAHs concentrations. It was observed that HMW PAHs were less distributed than LMW while concentrations of PAHs were lower in blood than in urine. Children are found to be at risk of carcinogenic and non-carcinogenic problems there is, however the need to clearly study and define major sources so as to enable proper mitigation measures. Urgent action is called for on the part of government and non-governmental agencies and other cooperate bodies to set up public campaign against exposure processes and to take measures that will reduce the impending danger facing our children.