


Introduction
Common health effects of mercury exposure in humans include dysarthria, motor disorders, sensory disturbances, and visual field disorders stemming from nervous system toxicity. Stillbirths, birth defects, developmental disorders, and renal disorders may also occur [1]. These health effects have frequently been observed in cases of serious mercury poisoning [2,3]. Patients with mercury poisoning in the 1950s in Minamata city, Japan, suffered from disorders such as paresthesia of the extremities, ataxia, dysarthria, hearing problems, visual field disorders, and tremor [2]. In the 1970s, thousands of patients exposed to mercury in Iraq also suffered from disorders such as paresthesia, ataxia, and dysarthria due to nervous system toxicity [3].
These adverse health effects can vary depending on the chemical form of mercury, exposure dose, exposure duration, exposure route, and age or developmental state [1]. Therefore, it is difficult to establish a reference level for the effects of mercury on health. A study of the aforementioned mercury exposure in Iraq reported that the dose-response curve, an indication of the effect of mercury on the human body, forms a hockey stick shape [3,4]. In other words, up to a certain threshold, mercury does not have significant effects on the human body, but above a certain threshold, the health effects are proportional to the dose. The threshold for blood mercury level suggested in this study was 250-400 µg/L [4]. However, in certain Western countries, the reference level for mercury is much lower. The United States Environmental Protection Agency (US EPA) has set a blood mercury level of ≤5.8 µg/L as a threshold for no health effects in humans [5]. The Human Biological Monitoring (HBM) commission of the German Federal Environment Agency reported that a blood mercury level of ≤5 µg/L does not have health effects in the normal population but that a level >15 µg/L may affect sensitive individuals [6]. The World Health Organization (WHO) has set the following as reference levels for mercury: blood mercury level, 5-10 µg/L; hair mercury level, 1-2 µg/g; and urine mercury level, 50 µg/g [1].
Based on the reference level set by the US EPA, the average mercury level among Koreans is higher than that among individuals in the West including the US and Western Europe; further, the proportion of Koreans with a blood mercury level of >5.8 µg/L is high, i.e., approximately 30% [7]. However, the health effects of mercury at a level, that exceeds the reference level but is not extremely high, remain unclear [8], and sufficient research has not yet been conducted. In fact, in Minamata and Niigata in Japan, and in Iraq, mercury levels were relatively high in patients who showed symptoms of mercury exposure as well as in those who did not exhibit symptoms [2,3,9].
There have been numerous studies worldwide on the neurological effects of low-level mercury exposure in adults, but the results are inconsistent [8,10]. In Korea, a few studies on the effects of low-level mercury exposure on the neurobehavioral functions of children and expectant mothers have been conducted [11,12], but to our knowledge, the effects on neurobehavioral functions of adults have not been studied thus far. Therefore, a study on the effects of low-level mercury exposure on the neurobehavioral functions of adults is needed. Furthermore, through this study, we aspired to suggest a reference level for mercury exposure in Korea, where the average level is higher than that in other countries. Therefore, we assessed the mercury levels in the blood, urine, and hair, performed neurobehavioral tests, and evaluated the association between mercury level and neurobehavioral function in adults aged 20-65 living in coastal regions of Korea.
Materials and Methods
Subjects
The subjects of the study included the head of a village and his/her family members, aged over 20 years, who were living in a small to medium-sized city (Tongyeong city) in the coastal region of Korea. The potential subjects were identified with the help of the local administration. The study plan was explained to the potential subjects through a phone interview, and consent was given by each subject. The subjects were examined in public centers (citizen centers and city halls). This study was approved by the National Institute of Environmental Research institutional review board (approval no., Environmental Health Research Department 1177).
The total number of subjects was 256. The survey and evaluation of the mercury level were conducted in subjects of all ages, while the computer-based neurobehavioral tests were only conducted in subjects aged less than 65 years. The final analysis included 172 subjects who completed the questionnaire, measurement of mercury levels, and neurobehavioral tests.
Questionnaire
The questionnaire was developed by researchers to examine the individual living environment and health behavior. The questionnaire included questions on sociodemographic characteristics (gender, age, level of education, monthly household income), smoking and drinking behaviors, frequency of fish consumption per week, use of Korean traditional medicine in the past year, and the number of dental amalgam fillings. Data were collected by the researchers via a face-to-face interview.
Measurement of Mercury Levels
The biological samples used for measuring mercury levels included blood, urine, and hair. Approximately 3-5 mL of blood was drawn, transferred to a tube containing anticoagulants, and transported to the laboratory. The blood was refrigerated at 4℃ until analysis. Before the analysis, the blood was agitated for 1 hour and over. Approximately 10-50 mL of midstream urine was collected, stored in a 15-mL conical tube free of heavy metal contamination, and stored frozen at -70℃ until analysis. After analysis, the urine mercury level was adjusted according to creatinine level. A hair sample (approximately 5 cm long) was collected from the occipital scalp of each subject and stored in a polyethylene bag in a desiccator until analysis. Approximately 1 g of the collected hair was taken for analysis, washed with distilled water and acetone to remove contaminants, and dried completely, and approximately 10 mg was analyzed.
Mercury level was measured using an automatic mercury analyzer (SP-3DS; Nippon Industries Co. Ltd., Tokyo, Japan) using the gold amalgamation method.
Neurobehavioral Tests
Neurobehavioral tests were conducted using a computer-based test (Korean Computerized Neuro-Behavior Test System; GNC Soft, Seoul, Korea). This test examines the functional disability of the central nervous system and evaluates attention ability, cognitive response speed, visuospatial cognitive ability, and manual dexterity. The validity and reliability of this test has been demonstrated previously [13,14]. The test items include the simple reaction time (SRT), choice reaction time (CRT), finger tapping speed (FTS), digit addition, symbol digit tests, color word vigilance, etc. Of these, we tested only three items (SRT, CRT, FTS) due to costs and a manpower shortage. The SRT test measures the time (in millisecond [msec]) taken by a subject to hit a key in response to the sight of a box that randomly appears on the screen. The CRT test measures the time (msec) taken by a subject to hit the arrow key in the direction of the short end of a cross with a long and a short end that randomly appears on the screen. The FTS test measures the number of times that a subject hits a specific key in 10 seconds using the index finger; this was measured for both hands.
Statistical Analysis
The dependent variables of our study, i.e., the results of the computer-based neurobehavioral SRT, CRT, and FTS (left and right) tests, were analyzed as continuous variables. The independent variables were the survey variables and the mercury levels in the blood, urine, and hair.
Age was analyzed as a continuous variable, while gender, number of dental amalgam fillings, use of Korean traditional medicine in the past year, smoking behavior, drinking behavior, level of education, monthly household income, and the frequency of fish consumption per week were analyzed as categorical variables. When the association between the results of the computer-based neurobehavioral tests and age, mercury level was analyzed, the Kolmogorov-Smirnov test showed a non-normal distribution of age, and mercury level. So we converted the values for age and mercury level to natural logs and performed the Pearson correlation analysis. The categorical variables, gender and use of Korean traditional medicine in the past year, were analyzed using Student's t-test if the neurobehavioral test results showed a normal distribution; they were analyzed using the Mann-Whitney U-test if the results did not show a normal distribution. For other variables, if the variance of the neurobehavioral test results was equal among categories and the distribution was normal, analysis of variance was used, whereas if the distribution was non-normal, the Kruskal-Wallis test was used to compare the means.
Although mercury level and neurobehavioral tests were analyzed as continuous variables, the distribution of mercury level was non-normal and right-skewed. Therefore, we calculated the geometric mean, and the values were converted to natural log values in the correlation analysis with the results of the neurobehavioral tests and multiple linear regression analysis test. Variables used in the multiple linear regression analysis included those with a significance level of ≤0.20 in the univariate analysis with the neurobehavioral test results as well as other variables that were believed to affect the neurobehavioral test results, such as age, drinking, education level, amalgam filling, and consumption of fish. Through multicollinearity analysis, the variables with a tolerance value of ≤0.1 were identified and excluded.
All statistical analyses were performed using SPSS version 20.0 (IBM Corp., Armonk, NY, USA), and the threshold for statistical significance was set at <0.05 (two-sided test).
Results
General Characteristics of the Subjects, Measurement of Mercury Levels, and Neurobehavioral Test Results
The average age of the 172 subjects in this study was 48.4 years, and 39.0% of subjects were men. The majority of subjects (124) did not have any dental amalgam fillings, but 17 subjects (9.9%) had two fillings. A total of 24 subjects (14%) had recently used Korean traditional medicine, 28 (16.3%) were current smokers, and 118 (68.6%) were current drinkers. High school (74 subjects; 43.0%) was the most common level of education, while the most common monthly household income was Korean won 1,000,000-1,990,000. The average frequency of fish consumption per week for most individuals was 1-3 times, and 13.4% of the subjects reported consuming fish almost every day (Table 1).
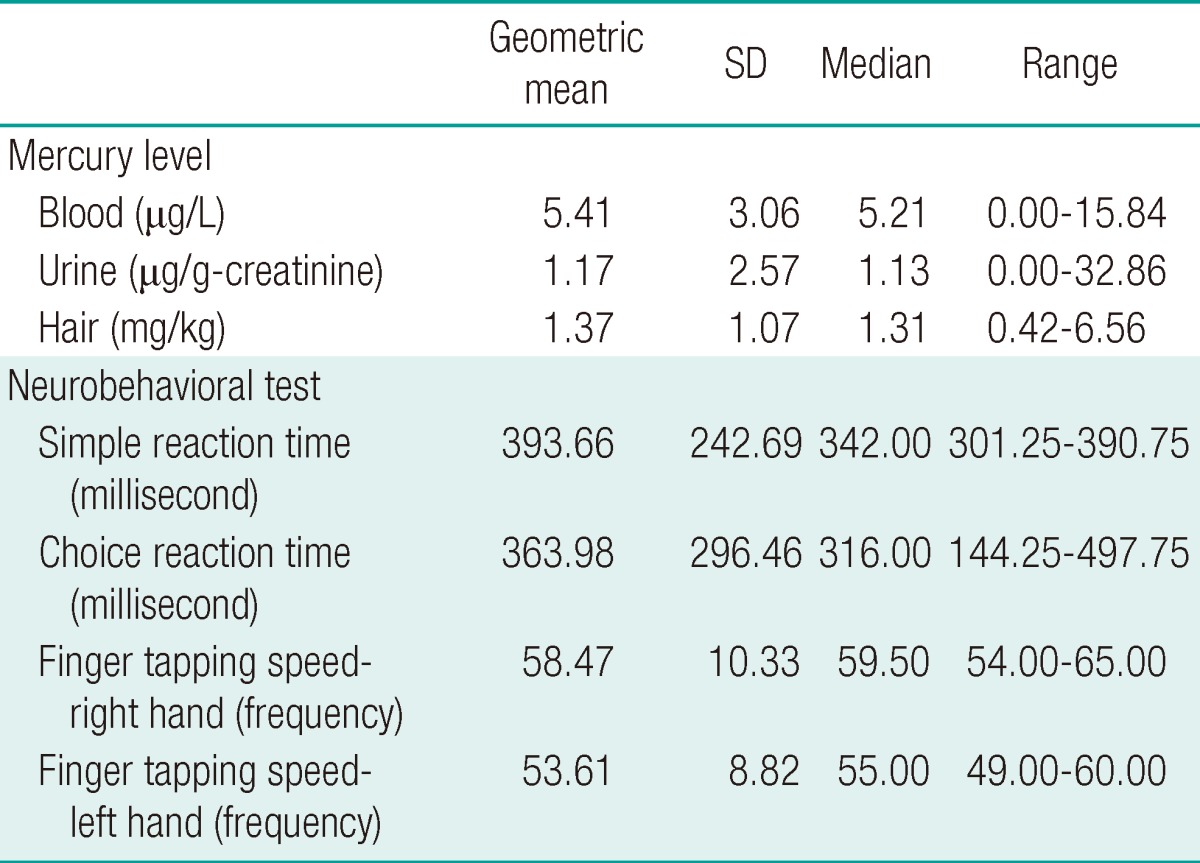
The geometric mean mercury levels in the blood, urine, and hair were 5.41 µg/L, 1.17 µg/g-creatinine (cr), and 1.37 mg/kg, respectively. The results of the neurobehavioral test revealed that the mean SRT was 393.66 msec, mean CRT was 363.98 msec, mean FTS (right hand) was 58.47, and mean FTS (left hand) was 53.61 (Table 2).
Association of Variables with Neurobehavioral Test Results
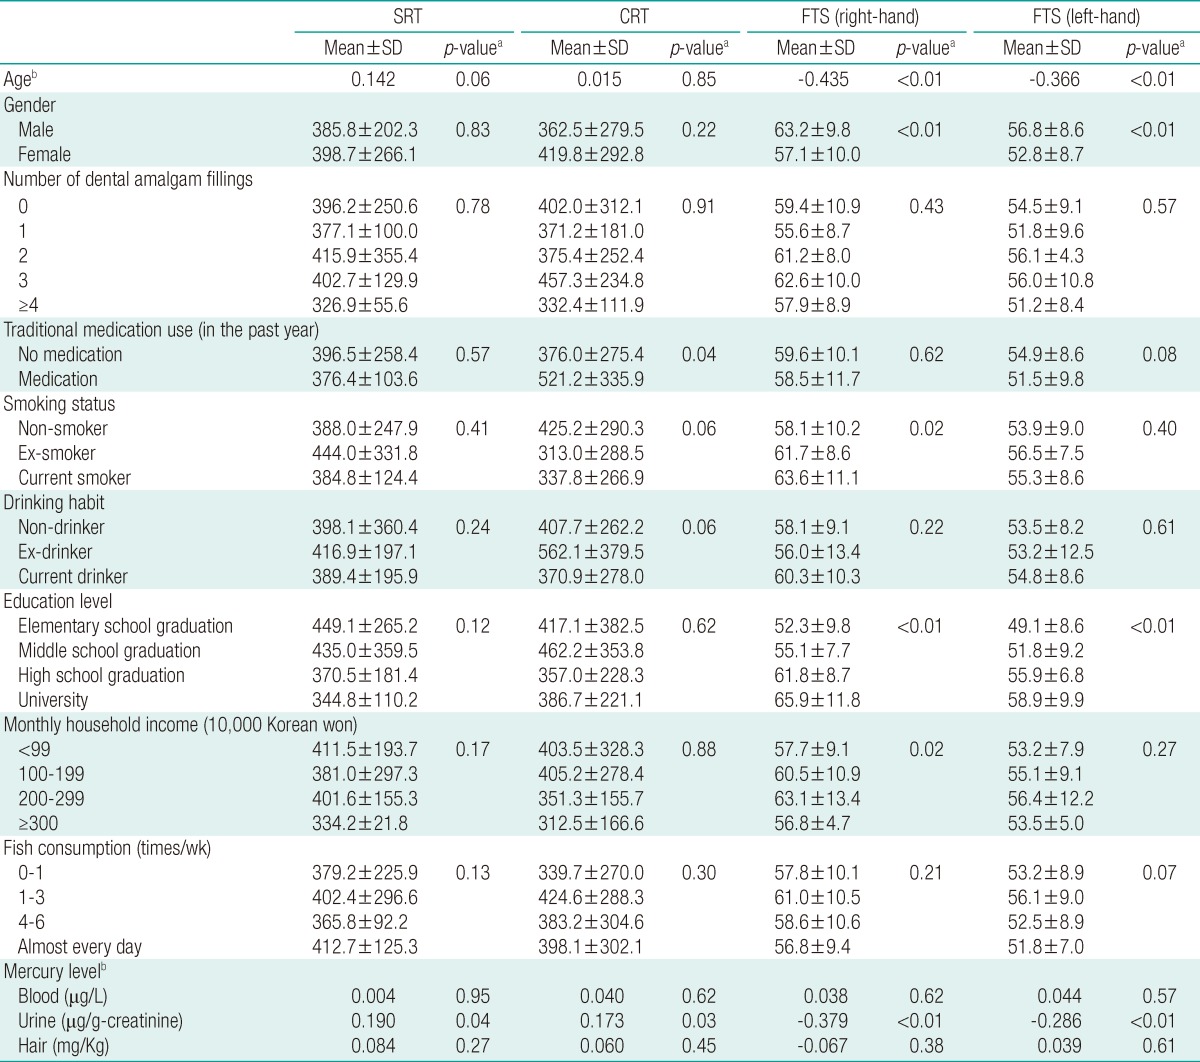
In univariate analysis, no variables were statistically associated with the SRT test. Similarly, no variables were associated with CRT test results other than the recent use of Korean traditional medicine (p=0.04). Variables associated with the FTS test results were age, gender, and education level.
In correlation analysis, urine mercury concentration was the only variable associated with the SRT test (r=0.190; p=0.04). Urine mercury level was also the only variable associated with the CRT test results (r=0.173; p=0.03). Age and urine mercury level were associated with the FTS test results (Table 3).
Multivariate Analysis
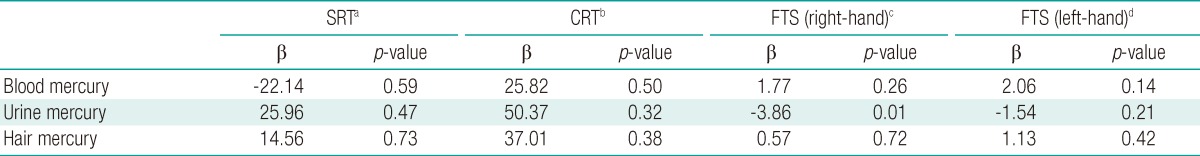
We performed multivariate analysis using variables that showed an association with neurobehavioral test results in the univariate analysis and variables with a significance of ≤0.20. Further, the right-hand FTS results were significantly negatively correlated with the urine mercury level; the number of taps decreased as the urine level increased (p=0.01) (Table 4).
Discussion
Neurobehavioral health effects of mercury have been observed in Japan and Iraq in cases of exposure to high levels of mercury, and the neurobehavioral health effects of low-level mercury exposure have been studied extensively [8,10,15,16]. However, despite higher than normal average mercury levels in individuals across Korea, the health effects of mercury exposure have not been well studied. A few studies have assessed the effects of mercury in neurobehavioral or developmental disorders in children [12,13], but none have studied its effects in adults. Therefore, this study aimed to measure the blood, urine, and hair mercury levels in normal Korean adults and evaluate neurobehavioral test results in order to assess the effects of low-level mercury exposure on neurobehavioral function.
In this study, the mean mercury levels in the blood, urine, and hair were 5.41 µg/L, 1.17 µg/g-cr, and 1.37 µg/g, respectively; these values were low compared to the German HBM II reference levels [6] for blood mercury level (15 µg/L) and the WHO reference levels for urine mercury level (50 µg/g-cr) and hair mercury level (7 µg/g) [1]. Furthermore, these levels were similar to the average blood mercury level of 5.19 µg/L obtained from the Korea National Health & Nutrition Examination Survey [17]. The hair mercury level was slightly higher than 0.83 µg/g, which was reported in citizens living near industrial regions [18].
The results of the neurobehavioral tests (SRT, CRT, and FTS) were significantly associated with the urine mercury levels, but not with the blood and hair mercury levels. Furthermore, in multivariate analysis, after adjustment for age, gender, smoking behavior, drinking behavior, education level, monthly household income, and frequency of fish consumption, there was a significant association between right-hand FTS and urine mercury level; that is, when the natural log value of urine mercury level increased by one unit, the number of finger taps decreased by 3.86.
These results are consistent with those of earlier studies. In a previous study on low-level mercury exposure, in which the geometric mean of hair mercury level was 9.5 µg/L, an increase in hair mercury level led to a decrease in the number of finger taps and motor function of the hands [19]. These results are consistent with those of another study, which showed that muscle fatigue and muscle strength in women decreased at a low hair mercury level (50 µg/g) [20]; these results are also consistent with those of a different study of 185 family members of adult fishermen living near Minamata, Japan, with a hair mercury level <10 ppm, many of whom showed neurological abnormalities [21]. Another study reported that in subjects with a low average hair mercury level (4.2 µg/g), an increase in mercury level led to a decrease in fine motor function or memory disorder [22]. However, we cannot directly compare the results of those studies to ours. Although urine mercury level was significantly correlated with neurobehavioral function, hair mercury level (particularly, methyl mercury) was used to study the association with neurobehavioral test results in those studies.
Blood mercury level is frequently used to assess acute toxicity and reflects the level of exposure to methylmercury. Hair mercury level is often used as an indicator of chronic mercury exposure, while urine mercury level is used to assess exposure to inorganic or elemental mercury. Neurobehavioral disorders due to mercury exposure are thought to be mostly due to methyl mercury [1]. Further, the health effects of inorganic mercury are minimal, and mostly involve renal disorders [1]. In our study, although hair and blood mercury levels were not significantly associated with neurobehavioral functions, urine mercury level had an effect on neurological functions. This may be because the urine mercury reflects the total mercury level in the body, although it mostly indicates exposure to inorganic or elemental mercury. In fact, urine mercury is closely related to the total mercury and methylmercury levels in the blood. Further, the inorganic mercury level directly increases with an increase in fish intake, and methylmercury is converted into inorganic mercury and excreted in the urine [1,23,24]. Therefore, the association between urine mercury level and neurobehavioral function is also thought to reflect the neurobehavioral effects of methylmercury or inorganic mercury. However, there were no significant differences in neurobehavioral test results when the blood or hair mercury levels were considered in our study. Therefore, we cannot directly conclude that methylmercury has toxic neurobehavioral effects.
Unlike the results of studies on hair mercury levels, the results of studies on low-level urine mercury level are not consistent. Franzblau et al. [25] revealed that urine mercury levels and the sensory and motor functions of peripheral nerves showed a significant association in some categories but not in others . However Carta et al. [26] reported that urine mercury levels were not associated with neurobehavioral tests such as simple reaction time, color word reaction time, digit symbol reaction time, and finger tapping. In a study on low blood mercury levels (median, 2.1 µg/L), higher mercury levels led to contrasting results in the FTS test and manual dexterity test [27]. A review article summarizing the results of these studies also concluded that the health effects of low-level mercury exposure are inconsistent and vary between individuals (from no effects to neurobehavioral dysfunction) [8].
In the WHO report published in 1990, the dose-response curve of mercury and its neurobehavioral effect had a hockey stick shape [3,4], that is, it does not have significant effects on the human body up to a certain dose, but above the threshold value, the health effects are proportional to the dose. The mercury level in our study was lower than that in these studies, and it did not affect neurobehavioral functions. However, the dose-response curve from the WHO report assumes an acute, high-level accumulation of mercury, such as that observed in mercury exposure cases in Iraq, and hence, it cannot be applied to everyday situations in which subjects are chronically exposed to low levels of mercury that are excreted after a certain period. Furthermore, some neurological symptoms are not exhibited immediately after exposure, and may be exhibited after several years of latency. A previous study suggested that the longer the latency period, the lower the mercury level [28]. Furthermore, some residents of Minamata, Japan, did not exhibit any symptoms at the time of the survey but presented with symptoms and were diagnosed with mercury poisoning 15 years later [29]; hence, it is difficult to directly assess the association between current mercury level and health effects. Therefore, we cannot conclude that the mercury level in the current study has a toxic neurobehavioral effect, and a long-term follow-up study is necessary to examine the health effects of chronic exposure to low-level mercury.
Our study is significant in that we examined the association between low-level mercury exposure and neurobehavioral function in normal Korean adults, who have higher average levels of mercury than residents of other countries. However, as this is only a cross-sectional study, unknown mercury exposure in the past and other factors influencing neurobehavioral function were not surveyed or analyzed. Therefore, our findings are limited for the establishment of a cause-effect relationship for neurobehavioral dysfunction. Furthermore, computer-based neurobehavioral tests are used to determine occupational disorders, and when the neurobehavioral function falls in the bottom 5th percentile in two of the six or more tests, the results are consistent with exposure to toxic substances and subjects are classified as requiring further management [30]. As we only conducted three neurobehavioral tests (SRT, CRT, and FTS of both hands), dysfunction cannot be conclusively determined. Moreover, although we conducted the FTS test for both the left and right hands, we did not determine the dominant and non-dominant hand in each subject; hence, these results should be interpreted cautiously.
In conclusion, in subjects with low-level mercury exposure, an increase in urine mercury level was associated with a decrease in the number of right-hand finger taps. However, as the blood and hair mercury levels were not correlated with neurobehavioral function and urine mercury level mainly reflects exposure to inorganic mercury rather than that to methylmercury, the effects of long-term exposure should be assessed. Given the limitations of this study, we cannot conclude that low-level mercury exposure has an effect on neurobehavioral function. Therefore, a long-term follow-up study is necessary to identify a clearer causative effect on neurobehavioral function.