| Home | E-Submission | Sitemap | Contact Us |  
top_img
Environ Anal Health Toxicol > Volume 34:2019 > Article
Ebere, Wirnkor, Ngozi, and Chukwuemeka: Macrodebris and microplastics pollution in Nigeria: first report on abundance, distribution and composition

Abstract

The abundance, distribution and composition of marine debris ( > 5 cm) and small microplastics (11 μm) from five rivers in South Eastern Nigeria was investigated. This study provided the first assessment of the type and quantity of marine litter and microplastics in Nigeria. A total of 3,487 macrodebris items/m2 were counted with the following distribution: plastics (59%), metal (10%), cloth (7%), paper/cardboard (7%), rubber (7%), glass/ceramics (5%), medical and agro-based waste (3%), and wood (2%). The cleanliness of the river assessed with clean coast index ranged from “very clean” to “extremely dirty”. Microplastics abundance ranged from 440 to 1,556 particles/L, with high accumulation at downstream. Fragment shape was most abundant while fiber and film followed. The distribution of plastic types was PET (29%), PE (22%), PVC (16%), PP (14%), and others (6%). Significant relationship was found between the total abundances of microplastics and different macrodebris groups suggesting that microplastics were abundant in areas where the macrodebris abundance was high. Our results provide baseline information for future assessments. Management actions should focus on input prevention including proper waste management, recycling of plastics, and strict penalties for illegal dumping of wastes.

Introduction

There is an increase in the global production of plastics due to its cheapness and versatility required for on-the-go lifestyle of people. Current worldwide production stood at 348 million metric tons in 2017 with an approximate increase of 9 % annually [1-2]. Majority of the plastic produced each year are nonbiodegradable, thereby accumulating in the marine environment. It was estimated that 10 % of plastic produced worldwide ended up as waste in the marine environment, due to poor recycling with only 3 % recycled in 2016 [2]. The environmental problems posed by the occurrence of plastics in the marine environment have been gaining increasing interest by scientists, governmental and non-governmental organization worldwide, becoming a global issue [4-5]. Macroplastics while in the environment undergo degradation (secondary) to form microplastics (< 5 mm), which is now ubiquitous in the global ecosystem [4,6-7]. However, another source of their presence is primarily from clothing, cosmetics, industrial processes via urban wastewater treatment and nurdles [2].
Microplastics are increasingly being observed in all components of most aquatic ecosystems of the world and posing varying toxicological threats to virtually all aquatic biota. The adverse effects of their presence in the marine environment which include particle toxicity, chemical toxicity and microbial toxin to marine organisms and sea animals have been demonstrated and discussed in many studies [1,4,6-16].
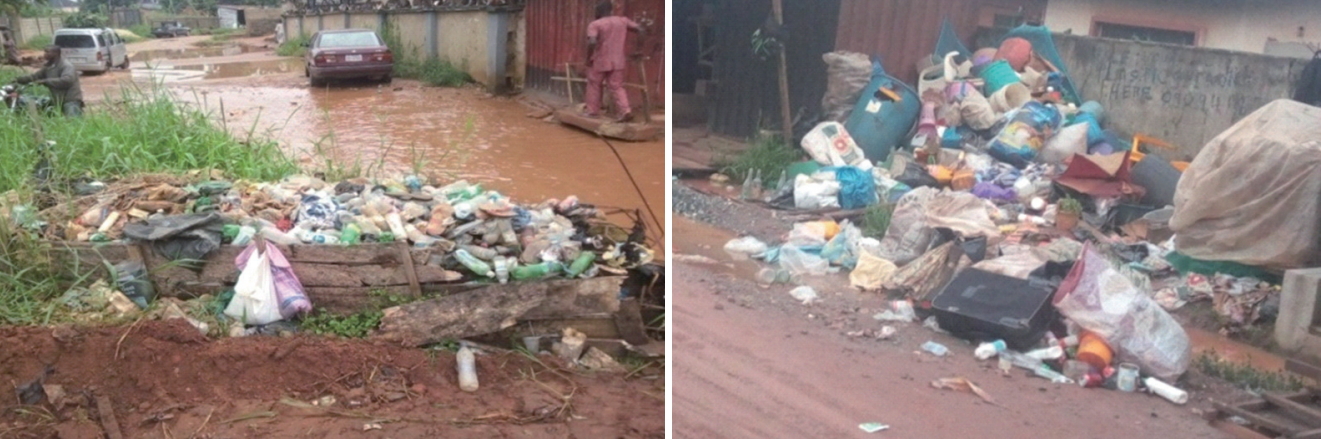
In Nigeria, plastic waste is poorly recycled, the majority ends up in landfill where it may take centuries for such material to breakdown and decompose (Figure 1). Despite plastics being an internationally recognized, pollutant with legislation in place aimed to curb the amount of plastic debris entering the marine environment [17-18], the problem still persists (Figure 1). The National Environmental Regulations Enforcement Agency (NESREA) prohibiting persons from dropping litter (polyethene bags inclusive) on roads, public space, drainages or other undesignated places, set in 2009, is poorly implemented/enforced. Plastic production and consumption are on the increase in annually with 10.3% and 6.5% respectively [7]. Production and consumption stood at 436 kilotons and 1,090 kilotons in 2018 respectively [5], causing increase in the abundance of plastics in the inland freshwater system. The inland freshwater system was estimated to be about 283,293.47 hectares, of which 70% has been degraded due to the pollution [19].
Many marine environment worldwide have been studied for the occurrence of microplastics such as in the South Pacific and North Atlantic [20-22] Kaliningrad region, Russia [23], Norderney [24], Indian coast [25], South Africa, Mozambique, and Ghana [26] while none is existent for inland fresh water system in Nigeria. However, two studies was found; the first focused on method development rather than quantifying the occurrence of microplastics in Elechi Creek, Rivers State, Nigeria [27], while the second study used gastropods collected from Osun River, Nigeria, as a bioindicator for microplastic pollution [28].
Macrodebris and marine litter pollution are particularly common where there are high anthropogenic pressures such harbours and marinas [1, 29-30]. According to United Nations Environment Program (UNEP) [31], marine litter is defined as ‘‘any persistent, manufactured or processed solid material discarded, disposed of or abandoned in the marine and coastal environment”. The issue has been highlighted for many years and was added in the 11 Descriptors set by Europe’s Marine Strategy Framework directive (2008/56/EC) (MSFD) [32]. However, in spite of growing interest and a mounting body of research, it is widely accepted that a major factor that limits our understanding of the ability to manage marine litter, is the lack of clearly identified objectives and inconsistencies in sampling design and litter classification systems between litter surveys [33]. Surveys of accumulated marine litter or debris are the most common means of estimating loads of litter in aquatic environment such as seas and rivers [33-36]. Such survey could inform on the quantity of microplastics particles presence in the environment as well as mitigation strategy. Data regarding the description of macrodebris in inland fresh water environment in Nigeria is very scarce. In an effort to counter this issue and address the paucity of data, the current study aim to assess the occurrence and distribution of the two main categories: macrodebris (size > 5 cm) and microplastics of inland rivers in Nigeria.
An estimated 6.4 million tonnes of litter enters the world oceans each year [31], of which Nigeria is one of the major contributors. Jambeck et. al. reported that Nigeria is the 9th largest emitters of oceanic plastic pollution worldwide, following China, Indonesia, Philippines, Vietnam, Sri Lanka, Thailand, Egypt and Malaysia, largely through the river Niger, which mostly receives the waste from inland waterbodies. Furthermore, Nigeria in conjunction with the following countries, viz., China, Indonesia, Philippines, Vietnam, Sri Lanka, Thailand, Egypt, Malaysia and Bangladesh, accounts for 90 % of all the plastic that reaches the world’s oceans [37-38]. Therefore, quantifying the abundance of microplastics and identifying their major sources in marine environments of Nigeria is important to understanding the potentially adverse impacts of microplastics to ecological systems. To achieve the aim of the study, the objectives in this study were (1) to count, classify and group the macrodebris found 10m transect from the shore of the river (2) to determine the proportion of different categories of litter on the total macrodebris (3) to count the number of microplastics presence and identify the shape (4) to calculate variation by rivers and stations (upstream, midstream and downstream) based on abundances and shape distribution. Our results may serve as a benchmark for future studies regarding occurrence of macrodebris and microplastics in inland freshwater systems in Nigeria and also used to generate an efficient policy to control microplastics and marine litters.

Materials and method

1. Study area

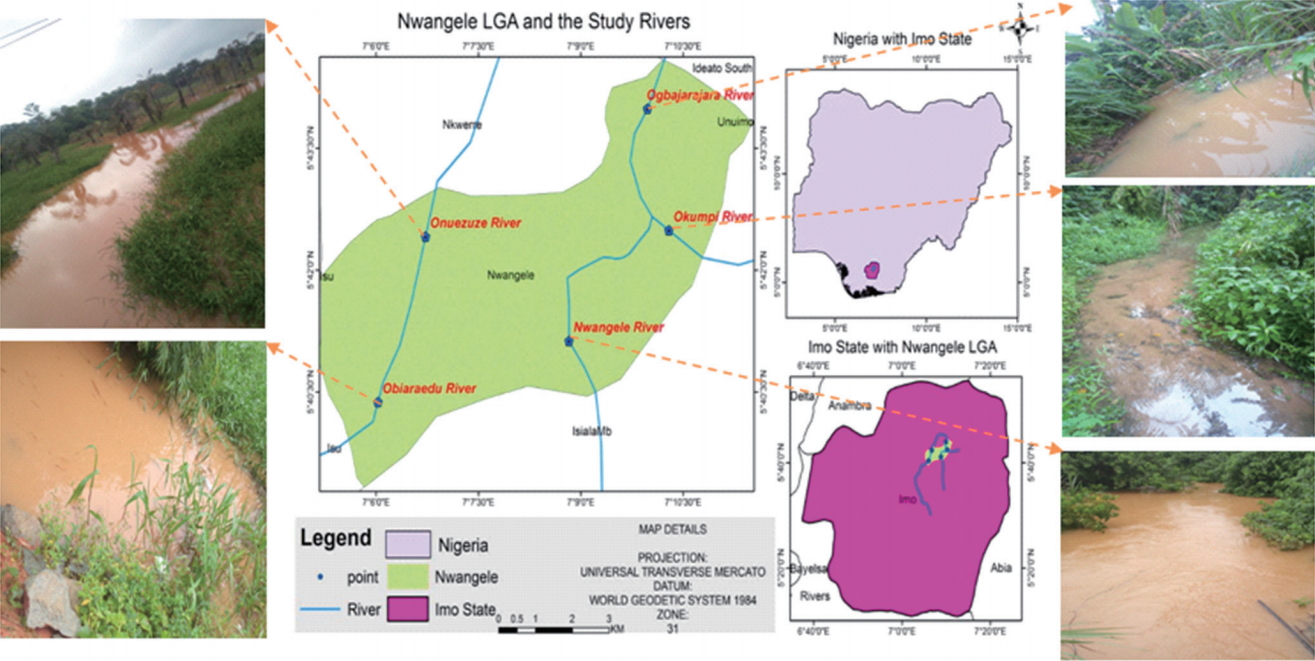
The five rivers in Nwangele local government area of Imo state, Nigeria are presented in Figure 2. The local government area is 63 km2 and its population is 128,472 as of the 2006 census. The rainy season follows similar tropical rainy season for the entire state, which begins in April and lasts until October, with annual rainfall varying from 1,500 mm to 2,200 mm. An average annual temperature above 20°C creates an annual relative humidity of 75% and reaching 90% in the rainy season. The soil has been degraded due to over farming. Overall, all the Five sampling location are affected by different anthropogenic activities which are summarized in Table 1.

2. Sampling

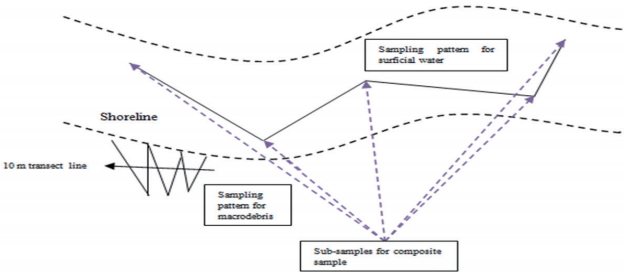
The overview of the sampling scheme for macrodebris and microplastics is presented in Figure 3. Sampling date were 15/06/2019 (for location IV and V) and 19/07/2019 (for location I-III) respectively. Sampling was done in the rainy period.

1) Macrodebris

The macrodebris sampling followed the operational guidelines as described by Cheshire et al. for UNEP/IOC Guidelines on Survey and Monitoring of Marine Litter with stringent modification [33]. The guideline was originally designed for beach assessment, but it was applied in this study for the rivers in which area from the shoreline are majorly filled with short grasses. Sample width was measured along the curve of the shoreline about 100 m while the length was measured 10 m transect parallel to the shore shown in Figure 2. Each sampling unit represents the entire area along each transect from the water’s edge as to the back of the river identified using coastal features such as the presence of high vegetation, dunes, cliff base, road, fence or other anthropogenic structures e.g. market. All debris > 5 cm in the area (100 by 10) was collected and counted in situ.

2) Microplastics

At particular sampling point, five sub-samples were collected using the grab sampling technique at the depth of collection of 0-3 cm following a “W” shaped design with an average area of 0.2 m2 (Figure 2). The surficial water sub-samples were collected against water current and were homogenized to form a sample (composite) for that point. This was done for all sampling points in the rivers. Overall, six composite surficial water samples were collected from each sampling site (total 30) using clean quart glass bottles (one liter). The bottles were capped tightly, shielded from light and stored at 4˚C to prevent evaporation and transported to the laboratory for analysis. The rationale for collecting surface water was the ability of microplastics accumulating in surface water microlayer due to their microsize dimension [1].

3. Analysis

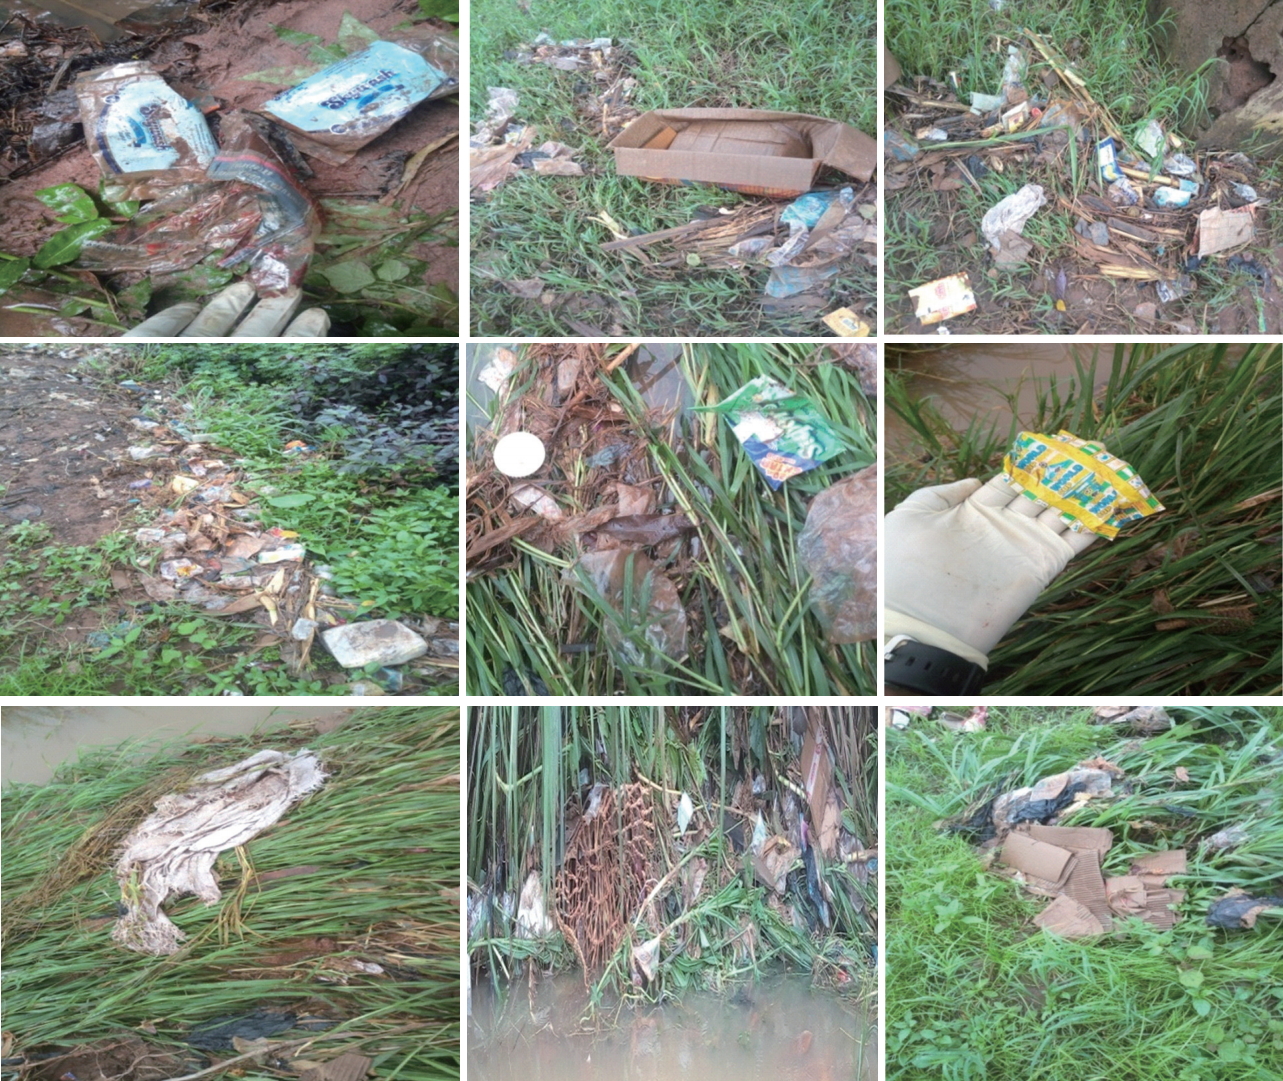
Macrodebris particles were classified according to the approach described by Cheshire et al., and Laglbauer et al. [33, 39]. Classification was in 59 categories and 8 major groups(Figure 4). The particles were counted, and expressed in items/m2. River cleanliness was assessed with the Clean Coast Index (CCI) [40]. The CCI was obtained by applying the equation (1).
(1)
CCI = (TPPTTAT)*K
where CCI is the number of plastic items/m2, TPPT is total plastic parts on transect, TAT is total area of transect (1000 m2; calculated as the product of the transect length, 10 m and width, 100 m) and K is a constant, 20. The rivers were classified from clean to extremely dirty according to the scale provided for the number of plastic particles on the coast (Table 2).
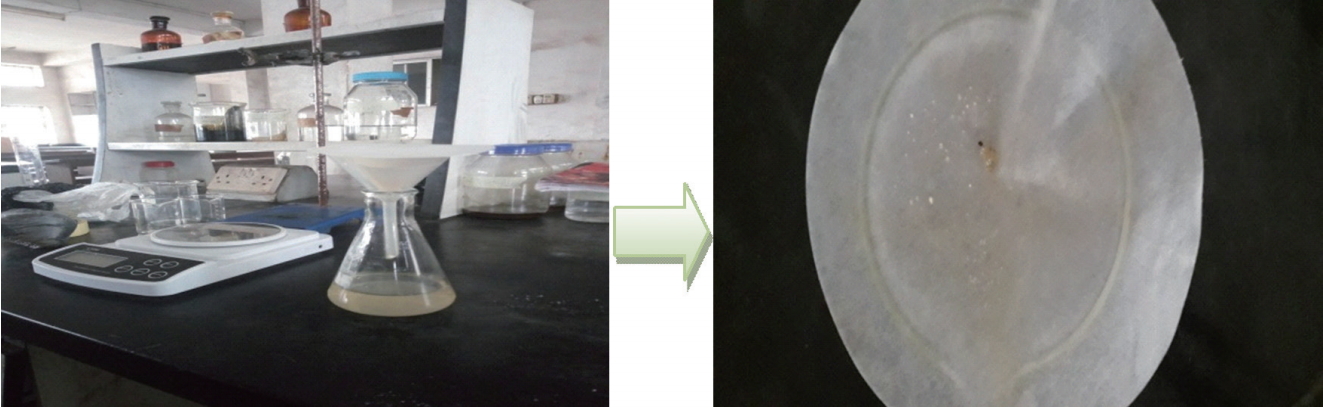
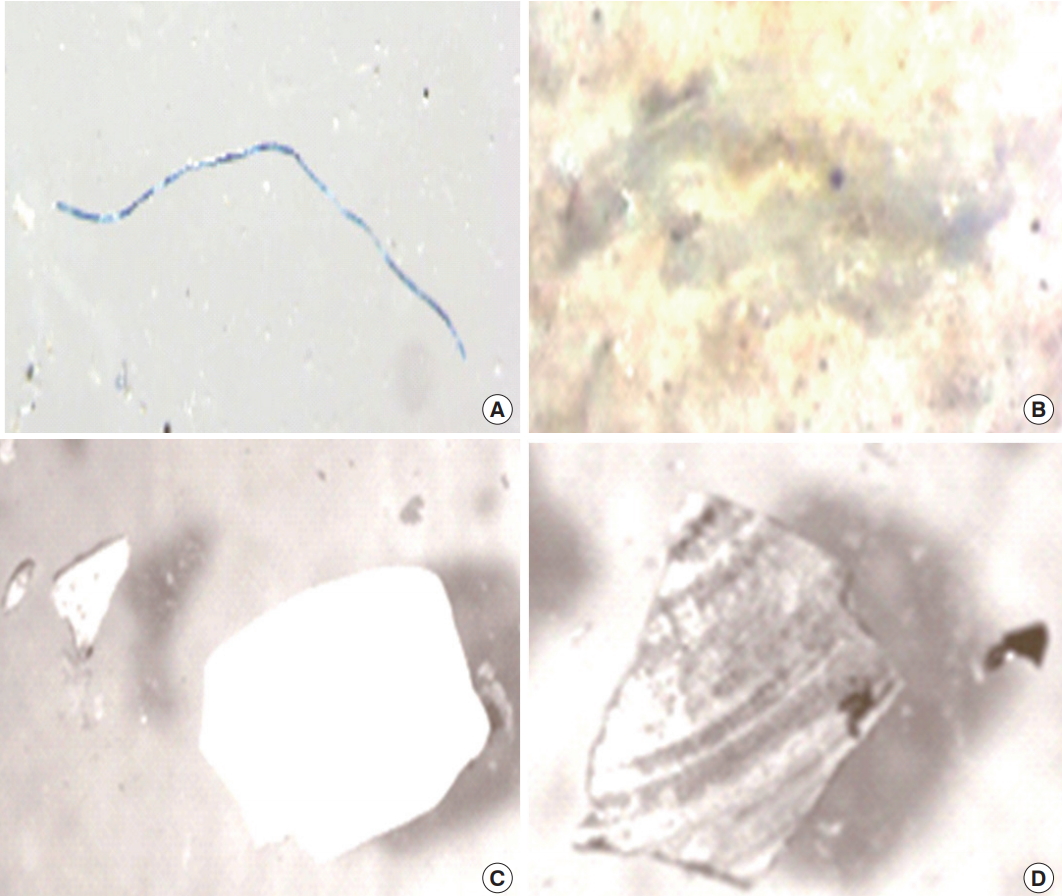
The water samples were filtered sequentially through a cellulose filter paper with a nominal pore size of 11 μm (Whatman No. 1, Catalog No. 1001 110, UK) with the aid of a glass funnel(Figure 5). The filter paper was placed in a desiccator, under room temperature away from light and stored in Petri dishes. To isolate and count microplastics, the dried filter papers were examined under a light microscope (AmScope M150C-PS25). The microplastics was isolated using the hot needle test as described by De Witte et al., [41] while the filter was read from left to right, then move down one row, and read from right to left to ensure pieces are not double counted. Pictures of the isolated microplastic particles were taken and classified into three dominant shapes; fiber, film, and fragment, and five types; polypropylene (PP), polyethylene (PE), polyvinyl chloride (PVC), polyethylene terephthalate (PET), and others, based on their physical characteristics (Table 3). Throughout the entire analysis, we ensured that filter papers were covered to prevent contamination from airborne fibers when they were not under microscope [4,7] and rubber gloves were used to minimize sample contamination plastic materials.

4. Statistical analyses

Statistical analyses of macrodebris and microplastics data were performed using Microsoft excel 2010. Macrodebris quality and quantity was compared between rivers within 59 categories across eight major groups. Microplastic quantity was also compared between rivers across four categories. Significant differences and variations between rivers for macrodebris and microplastic quantity were tested using one-way analysis of variance (ANOVA) at 5% level of significance and coefficient of variations (CV) [19, 29, 42]. Coefficient of variance was calculated as the ratio of the standard deviation (SDV) to the mean as presented in equation (2)
(2)
CV (%) = (SDVmean)*100
Variation was categorized as little variation (CV <20), moderate variation (CV=20-50) and high variation (CV >50) [29]. Relationships were also tested between marine litter groups and microplastics using linear regression analysis.

Results and discussion

1. Macrodebris

The macrodebris classification system was in 59 categories and 8 groups as recommended [43]. This classification system has low error rate and more consistency in data analysis and therefore allows easy identification of changes in debris composition, source, and usage of items [33, 39, 43]. The occurrence of litter on shore of surface waters in Nigeria is scarce. Considering poor knowledge on litter accumulation in inland surface waters, this survey is therefore of great value for obtaining information on litter quantity and distribution. In the present study, data we collected provides insight on the quantity and composition of litter across typical freshwater system in Nigeria.
A total of 3,487 macrodebris items were classified into 59 categories and 8 major groups. The total number of macrodebris items reported in this study was lower to the total number of macrodebris on Brasil [45], South Korea [46] and Japan [47] (Table 4). This is due to lesser influx of people, since period of study at those locations served as a tourist center for beachgoers. Between rivers, all group of litter was most abundant at location II (Nwangele river) which is due to high anthropogenic activities such as the Nkwo Mmiri market, less than 100 m away from the river.
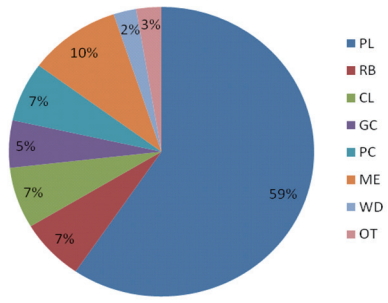
Compositional profiling revealed that the majority (59%) was made of plastic, a category generally dominant within the rivers (Figure 6). Similarly, a study by Babatunde and Arinze et al. [50] which studied some rivers in Akwa Ibom, Nigeria for suspended marine litter also reported the highest quantity of plastic group more than 5000 kg/m2. In comparison with international studies, the plastic group was also reported to be in high abundance in the marine environment and in seafloor [39, 44, 46-48, 51]. Metal was the second most abundant group at the rivers (10%), followed by rubber, cloth, paper and cardboards (all 7%), then glass and ceramics (5%), followed by other (mainly agricultural waste, 3%) while the least was wood (2%), as shown in Figure 6.
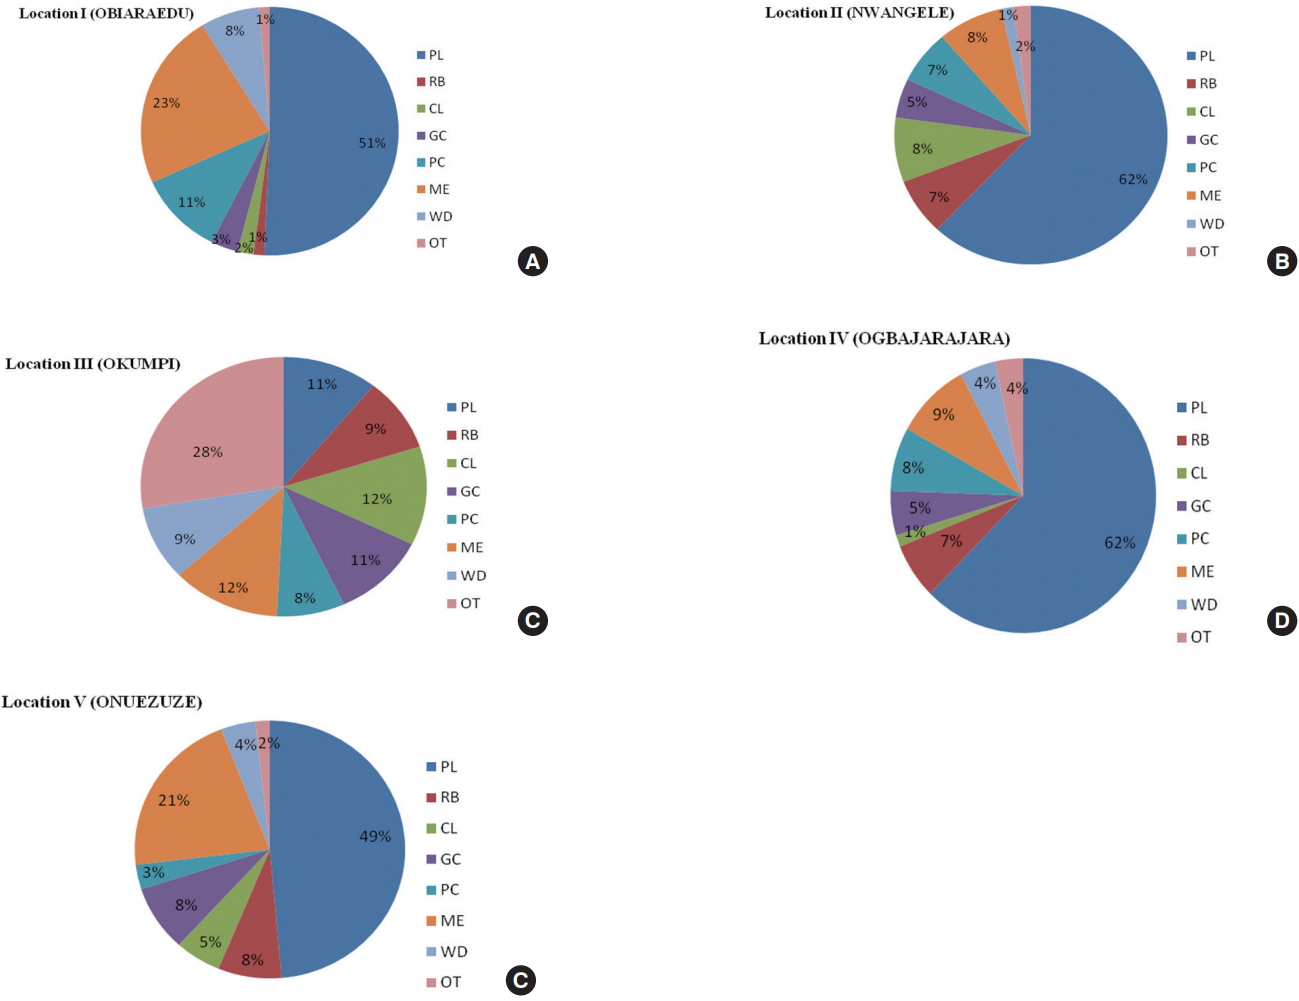
Compositional profile by location revealed the following the order of abundance: PL (51 %) > ME (23 %) > PC (11 %) > WD (8 %) > GC (3 %) > CL (2 %) > RB/OT (1 %) respectively for Location I (Figure 7a); PL (62 %) > ME/CL (8 %) > PC/RB (7 %) > GC (5 %) > OT (2 %) > WD (1 %) respectively for Location II (Figure 7b); OT (28 %) > ME/CL (12 %) > PL/GC (11 %) > RB/WD (9 %) respectively for Location III (Figure 7c); PL (62 %) > ME (9 %) > PC (8 %) > RB (7 %) > GC (5 %) > WD/OT (4 %) > CL (1 %) respectively for Location IV (Figure 7d); PL (49 %) > ME (21 %) > GC/RB (8 %) > CL (5 %) > WD (4%) > PC (3 %) > OT (2 %) respectively for Location V (Figure 7e).
In terms of category distribution in groups for the rivers, the order of litter abundance followed (Table 5): drink bottles (17 %) > packaging for soap (15 %) and cotton bud sticks (15 %) > caps and lids (12 %) > packaging for biscuit (4 %) and toys (4 %) > straws (3 %) and fishing ropes, string and cord (1 %) > others (0 %) respectively for plastic (PL) group; Balloons, balls, toys (47 %) > Shoes (25 %) and other pieces (25 %) > Gummies (8 %) for rubber group; ropes (59 %) > clothing, shoes, hats and towels (34 %) > other (7 %) respectively for cloth group; plates, pots (cups) (41 %) > Bottles, glasses (24 %) > Pieces (22 %) > construction material (13 %) for respectively glass/ceramics group; Paper (incl. magazines) (53 %) > Cardboard (pieces, boxes) (42 %) > Other (pieces) (5 %) respectively for paper/cardboard group; Drink cans (38 %) > Caps, can lids (26 %) > Pieces (12 %) > Construction (10 %) > Aluminium wrapping (7 %) > Other (4 %) > Wire, barbed wire (3 %) respectively for metal group; Matches, fireworks (61 %) > Other (24 %) > Ice lolly sticks (9 %) > Cork (6 %) respectively for wood group Agricultural waste (Maize) (83 %) > Medical waste (container) (17 %) respectively for other group.

2. River cleanliness assessment

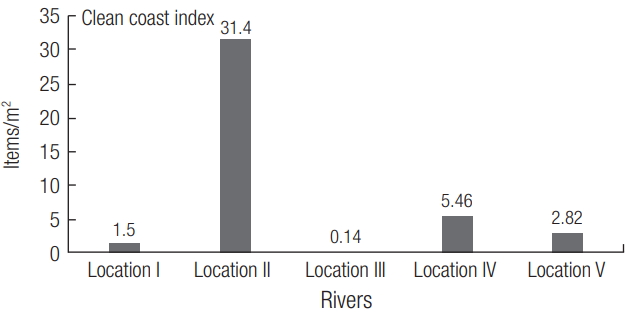
The river cleanliness assessment was done using the CCI as described in section 2.2.2.1 in the analysis of macrodebris. The computed result for the rivers is presented in Figure 8. Following the grading provided in Table 2, only location II was “extremely dirty” with CCI of 31.4 items/m2, two other rivers were “very clean” viz location I and location III with CCI of 1.5 items/m2 and 0.14 items/m2 respectively. The remaining two rivers ranged from “clean” with CCI of 2.82 items/m2 at location V to “moderate” with CCI of 5.46 items/m2 at location IV respectively. The order of decreasing macrodebris pollution followed: location II > IV > V > I > III. The high CCI grade for location II is mainly due to high anthropogenic activities experienced in the area which decreased with intensity of anthropogenic activities. The current study reported low CCI when compared to CCI reported for some beaches in Slovenia with a CCI ranged of 5.67 (moderate) to 49.29 (extremely dirty) [39] perhaps due differences regarding plastics consumption and local land-based sources.

3. Microplastics

The amount of microplastics counted in terms of shape in one liter of water sample collected upstream, midstream and downstream is presented in Table 6 and images of dominant microplastic shape are presented in Figure 9. Overall microplastics abundance ranged from 440 to 1556 particles/L. However significant microplastics concentrations were reported elsewhere. Chae et. al. [52] in their study on microplastics in surface seawaters of the Incheon/Kyeonggi Coastal Region of South Korea, reported particle concentration ranged from 1602 ± 1274 to 152,688 ± 92,384 particles/m3. They concluded that microplastic abundance was influenced by the method of sampling and spatiality. Similar conclusion was also reached in an earlier study in the Swedish west coast [53], which ranged from 167 to 102,550 particles/m3.

1) Distribution based on stations

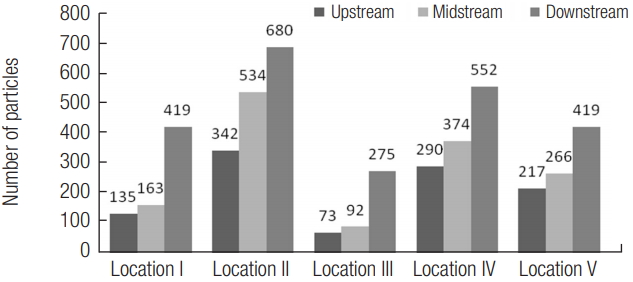
The distribution of total number of microplastics based on locations and stations is presented in Figure 10. The quantity of particles ranged from 73 particles/L at upstream of location III to 680 particles/L at downstream of location II. Location II had the highest count of microplastics for all stations while location III was the lowest.
In terms of stations, distribution showed significant differences (p < 0.05, ) with general high load of particles in downstream probably due to different flow pattern and topography. The order of mean count was downstream (469±153.33 particles/L) > midstream (285.8±174.94 particles/L) > upstream (211.4±109.84 particles/L). The variations ranged from “moderate” at downstream (32.69%) to “high” at midstream (61.21%) and upstream (51.96%). The variations followed the order downstream < upstream < midstream.

2) Distribution based on shape

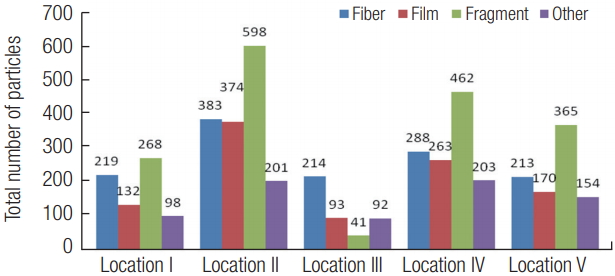
Generally, fragment was the most dominant shape except at location II which had high fiber (214 particles/L) (Figure 11). Similarly, Ryan et al. [54] also found fragment to be the most abundant microplastic shape in surface water from three South African coastal waters. The distribution order for shape abundance in the current study was fragments (346±210.02 Particles/L) > fiber (263.4±73.93 Particles/L) > film (206±112.93 Particles/L) > other (149±70.08 Particles/L) respectively. Furthermore, distribution by location followed the order: location II > IV > I > V > III respectively for fiber and film shape while fragments were location II > IV > V > I > III respectively. Shape variability analysis showed “moderate variation” for fiber (28.07%) and other (46.84%) while “high variations” for film (54.71%) and fragment (60.56%).

3) Distribution based on type

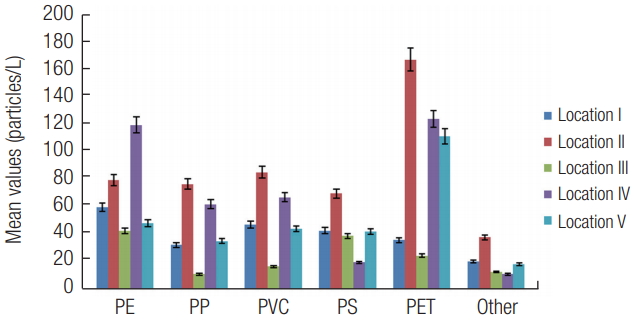
The distribution of plastic types by location is presented in Figure 12. PE was highest at location IV while lowest at location III. Similarly, Ryan et al. [54] also found high distribution of PE from three South African coastal waters. The current study also found PP, PVC, PS and other type was highest at location II and lowest at III. Similarly, PP (51%) was found to be the most abundant type of microplastics in surface seawaters of the Incheon/Kyeonggi Coastal Region of South Korea [52]. Furthermore, a study of the Bay of Brest in France reported abundance based on type in the order; PE > PP > PS [55]. However, PET was highest at location II, IV and V. PE, PP and PET are mostly used for packaging purposes. Major application of consumed plastic in Nigeria is by packaging (55%) [7] and could be responsible for the high distribution of PE and PP as described in the current study.
Distribution based on type showed significant differences (p < 0.05) but positive correlations. PVC with PET (r = 0.87) and other (r = 0.66), while others with PS (r = 0.94) and PET (r = 0.58) respectively showed significant and high correlations. The positive and high correlations indicated that the source of these plastics type are mainly from macrodebris and therefore from secondary sources through fragmentation of large plastics by sunlight. The distribution of plastic types was; PET (29%) > PE (22%) > PVC (16%) > PP (14%) > other (6%).
The CV values for plastic type for the different locations are presented in Table 7. Variability was high at location II and IV, low at III and moderate at I and V for PE; variability was high in all location except at IV (moderate) for PP; low variability at II, moderate III while remaining locations showed high variations for PVC; all moderate all except at III which was high for PS; low at I and moderate III while II, IV and V were high for PS.

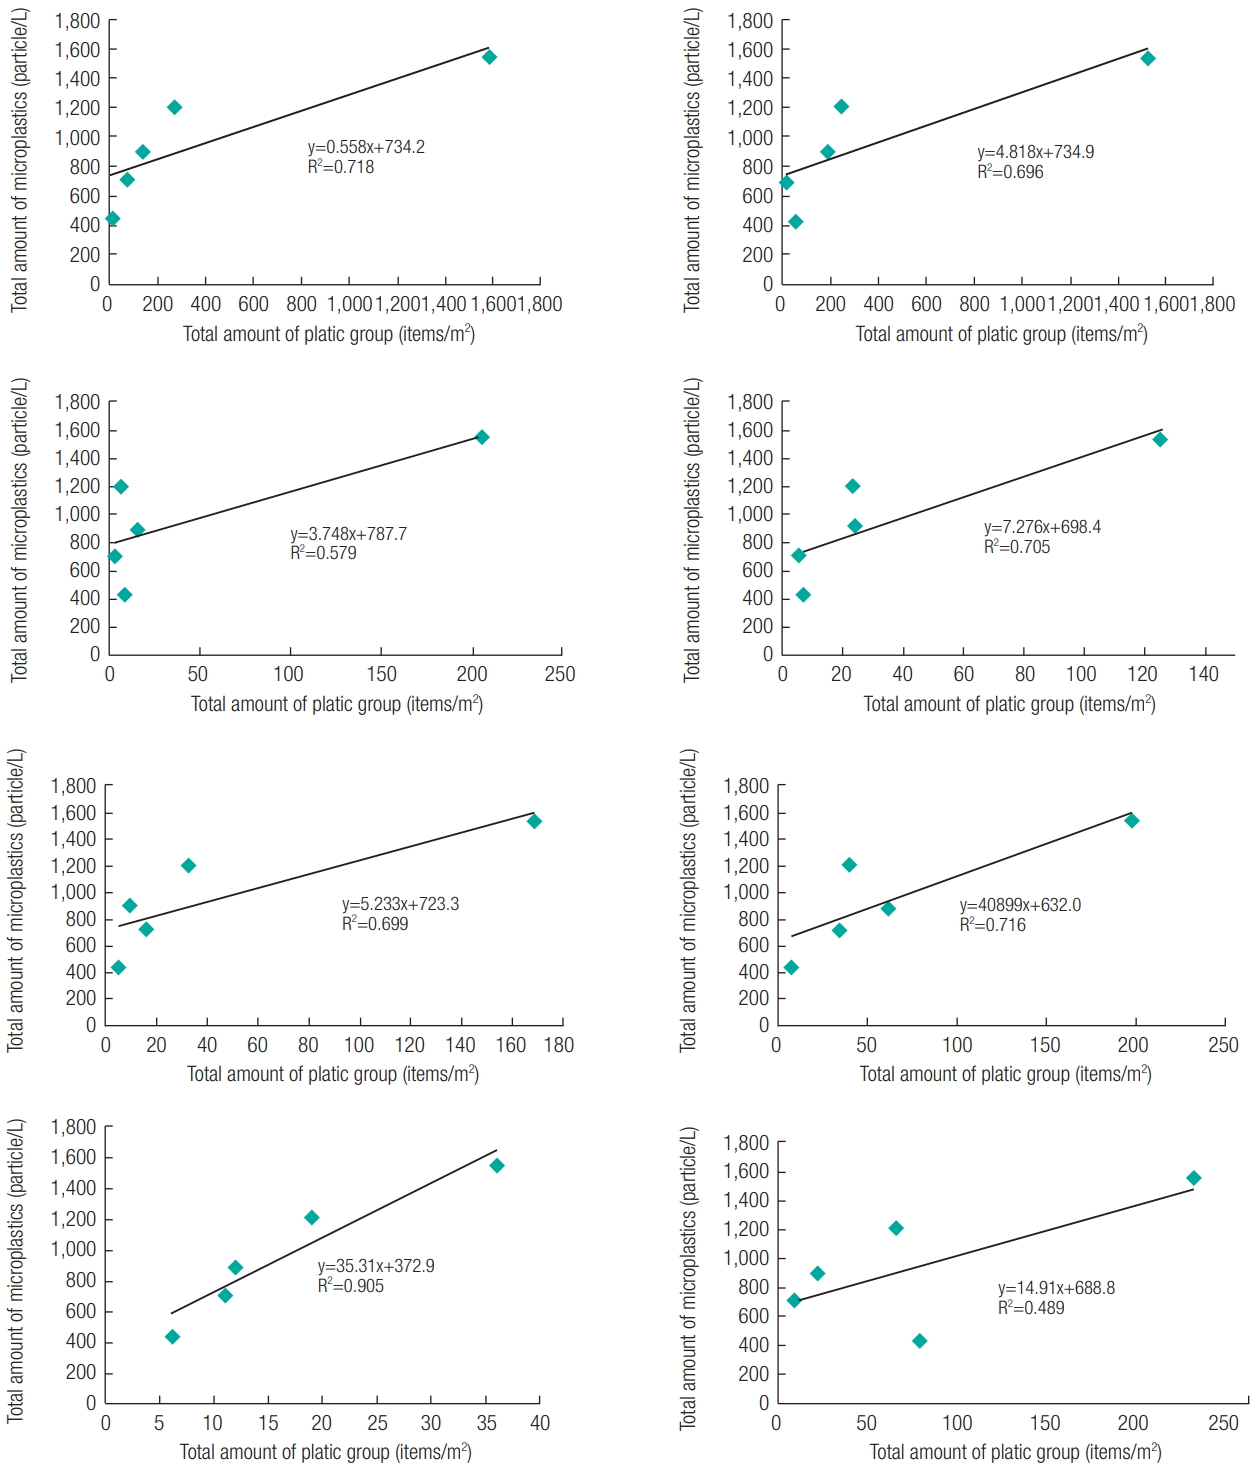
4. Macrodebris group vs microplastics: Regression analysis

The regression analysis between different macrodebris groups and microplastics are presented in Figure 13. Generally, a significant relationship was found between the total abundances of microplastics and different macrodebris group. The correlation analysis results suggest that microplastics were abundant in areas where the macrodebris abundance was high. The regression coefficient for the different groups of debris was in the order; wood > plastic > metal > paper/cardboard > glass/ceramic > rubber > cloth > other, respectively. Significance relationships have been observed for macrodebris and microplastics for beaches in South Korea [46].

Conclusion and recommendation

The majority of items found on the shore of the rivers were plastic, with moderate pollution (mean CCI of 8.26). This study found that location II was extremely polluted compared to the other rivers in this study. Major shape of microplastics found were fragment, fiber and film which may be secondary sources from the fragmentation of macroplastics through light, heat, chemical, or physical processes while downstream accumulated most microplastics compared to midstream and upstream. There was significant occurrence of microplastics in smaller size (11 μm), which could pose ecological problems, because at this size they are readily bioavailable and easily ingested by animals. The dominant type of plastic was PET probably from plastic water bottles. Finally, macrodebris (> 5 cm) surveys could serve as surrogates for small microplastics (0–25 μm) monitoring and also be used to identify hot spots of microplastic pollution in large geographical areas with limited resources. Due to limitations in this study, we recommend a follow-up study including large sample sizes, with better analytical method, such as a method for microplastics analysis reviewed by Verla et. al. [2], and time period covering both dry and rainy periods. However, more inland rivers in Nigeria should be assessed for macrodebris and microplastic pollution for more understanding of their distribution within the whole country. Strategies to reduce waste generation such as proper waste management, recycling of plastics, penalties for illegal dumping and a long-term monitoring are highly required.

Conflict of interest

The researchers declares no conflicts of interest regarding the publication of this manuscript

References

1. Verla AW, Enyoh CE, Verla EN, Nwarnorh KO. Microplastic-Toxic Chemical Interaction: a Review Study on Quantified Levels, Mechanism and Implications. SN Applied Sciences 2019;1: 1400.
crossref pdf
2. Verla AW, Enyoh CE, Verla EN. Microplastics, an emerging concern: A review of analytical techniques for detecting and quantifying microplatics. Anal Methods Environ Chem J 2019a;2(2):15-32.
crossref
3. Jambeck JR, Geyer R, Wilcox C, Siegler TR, Perryman M, Andrady A, et al. Plastic waste inputs from land into the ocean. Science 2015;347(6223):768-771.
crossref pmid
4. Enyoh CE, Verla AW, Verla EN, Ibe FC, Amaobi CE. Airborne Microplastics: a Review Study on Method for Analysis, Occurrence, Movement and Risks. Environ Monit Assess 2019a;191: 668.
crossref pdf
5. Verla AW, Enyoh CE, Verla EN. The importance of microplastics pollution studies in water and soil of Nigeria ecosystems. Anal Method Environ Chem J 2019c;2(3):89-96.

6. Enyoh C E, Verla AW, Verla EN. Uptake of Microplastics by Plant: a Reason to Worry or to be Happy. ? World Scientific News 2019;131: 256-267.

7. Enyoh CE, Verla AW. We are breathing Plastic; Don’t Just Look down, Look up. Presented at the 3rd IMSU World Environment Day International Conference; 2019.

8. Day RH, Wehle DHS, Coleman FC. 1985, p.Ingestion of plastic pollutants by marine birds. In: Shomura RS, Yoshida HO, editors. Proceedings of the Workshop on the Fate and Impact of Marine Debris. 344-386. Honolulu, Hawaii: U.S. Dep. Commer., NOAA Tech. Memo. NMFS.

9. Boerger CM, Lattin GL, Moore SL, Moore CJ. Plastic ingestion by planktivorous fishes in the North Pacific Central Gyre. Mar Pollut Bull 2010;60(12):2275-2278.
crossref pmid
10. Davison P Asch RG. Plastic ingestion by mesopelagic fishes in the North Pacific subtropical gyre. Marine Ecology Progress Series 2011;432: 173-180.
crossref pdf
11. Browne MA, Dissanayake A, Galloway TS, Lowe DM, Thompson RC. Ingested microscopic plastic translocates to the circulatory system of the mussel, Mytilus edulis (L). Environ Sci Technol 2008;42(13):5026-5031.
crossref pmid
12. Cole M, Lindeque P, Fileman E, Halsband C, Galloway TS. The impact of polystyrene microplastics on feeding, function and fecundity in the marine copepod Calanus helgolandicus. Environ. Sci. Technol 2015;49(2):1130-1137.
crossref
13. Murray F, Cowie PR. Plastic contamination in the decapod crustacean Nephrops norvegicus (Linnaeus, 1758). Marine Pollution Bulletin 2011;62(6):1207-1217.
crossref pmid
14. Ugolini A, Ungherese G, Ciofini M, Lapucci A, Camaiti M. Microplastic debris in sandhoppers. Estuarine, Coastal and Shelf. Science 2013;129: 19-22.

15. Foekema EM, Gruijter C, Mergia MT, Franeker JA, Murk AJ, Koelmans AA. Plastic in North Sea fish. Environ Sci Technol 2013;47(15):8818-8824.
crossref pmid
16. Hall NM, Berry KLE, Rintoul L, Hoogenboom MO. Microplastic ingestion by scleractinian corals. Mar Biol 2015;162(3):725-732.
crossref pdf
17. Gregory MR. Environmental implication of plastic debris in marine setting-Entanglement, ingestion, smothering, hangers-on, hitch-hiking and alien invasions. Philo Trans R Soc B Biol Sci 2009;364(1526):2013-2025.
crossref
18. Lozano RL, Mouat J. Marine Litter in the North-East Atlantic Region: Assessment and Priorities for Response. KIMO International; 2009.

19. Verla AW, Verla EN, Ajero CM, Lele KC, Stellamarris NO, Enyoh CE. Biomonitoring of Heavy Metals in Blood and Urine of African Children from Owerri Metropolis, Eastern Nigeria. J Chem Health Risk 2019b;9(1):11-26.

20. Law KL, Moret-Ferguson S, Maximenko NA, Proskurowski G, Peacock EE, Hafner J et al. Plastic accumulation in the North Atlantic subtropical gyre. Science 2010;329(5996):1185-1188.
crossref pmid
21. Eriksen M, Lebreton LCM, Carson HS, Thiel M, Moore CJ, Borerro JC et al. Plastic pollution in the World’s oceans: more than 5 trillion plastic pieces weighing over 250,000 tons afloat at sea. PLoS One 2019;9(12):111913.

22. Desforges JP, Galbraith M, Dangerfield N, Ross PS. Widespread distribution of microplastics in subsurface seawater in the NE Pacific Ocean. Mar Pollut Bull 2014;79(1-2):94-99.
crossref pmid
23. Elena E. Plastic pollution on the Baltic beaches of Kaliningrad region, Russia. Mar Pollut Bull 2017;114(2):1072-1080.
crossref pmid
24. Dekiff JH, Remy D, Klasmeier J, Fries E. Occurrence and spatial distribution of microplastics in sediments from Norderney. Environ. Pollut 2014;186: 248-256.
crossref pmid
25. Tiwaria M, Rathoda TD, Ajmala PY, Bhangarea RC, Sahua SK. Distribution and characterization of microplastics in beach sand from three different Indian coastal environments. Mar Pollut Bull 2019;140: 252-273.
crossref
26. Hirai H, Tkada H, Ogata Y, Yamashita R, Mizukawa K, Saha M, et al. Distribution and characterization of microplastics in beach sand from three different Indian coastal environments. Mar Pollut Bull 2019;140: 252-273.

27. Briggs E, de Moura EAB, Furusawa HA, Cotrim MEB, Oguzie EE, Lugao AB. Microplastics: A Novel Method for Surface Water Sampling and Sample Extraction in Elechi Creek, Rivers State, Nigeria. Characterization of minerals, metals and materials. The minerals, metals and materials society 2019;269: 281.

28. Akindele EO, Sonja ME, Jochen HEK. First empirical study of freshwater microplastics in West Africa using gastropods from Nigeria as bioindicators. Limnologica 2019;78: 125708.
crossref
29. Enyoh CE, Verla AW, Egejuru NJ. pH variations and chemometric assessment of borehole water in Orji, Owerri Imo State, Nigeria. J Environ Anal Chem 2018;5(2):1-9.

30. Verla AW, Verla EN, Amaobi CE, Enyoh CE. Water Pollution Scenario at River Uramurukwa Flowing Through Owerri Metropolis, Imo State, Nigeria. Int J Appl Sci Res 2018a;6(4):38-49.

31. UNEP. Marine Litter: A Global Challenge. Nairobi. 2009. p. 232.

32. Galgani F, Hanke G, Werner S, Vrees L. Marine litter within the European Marine Strategy Framework Directive. ICES J Mar Sci 2013;70: 1055-1064.
crossref
33. Anthony C, Adler E, Barbière J, Cohen Y, Evans S, Jarayabhand S et al. UNEP/IOC Guidelines on Survey and Monitoring of Marine Litter Regional Seas Reports and Studies No. 186, IOC Technical Series No. 83. 1-131.

34. Ribic CA, Dixon TR, Vining I. Marine Debris Survey Manual. NOAA Technical Report NMFS 108. 1992.

35. Kiessling I. Finding Solutions: Derelict Fishing Gear and Other Marine Debris in Northern Australia. A report for the National Oceans Office and Department of the Environment and Heritage. Key Centre for Tropical Wildlife Management, Charles Sturt University. 2003.

36. Stuart K. Literature of the Various Methodological Tools Utilised in Oceanic Litter Surveys. Prepared for the South Australian Research and Development Institute – Aquatic Sciences. 2003.

37. Schmidt C, Krauth T, Wagner S. Export of Plastic Debris by River into the Sea. Environ Sci Technol 2017;51(21):12246-12253.
crossref pmid
38. Franzen H. Almost all plastic in the ocean comes from just 10 rivers. Deutsche Welle. cited 2017 Nov 30. Available from: https://www.dw.com/en/almost-all-plastic-in-the-ocean-comes-from-just-10-rivers/a-41581484 Assessed 10/7/2019.

39. Laglbauer BJL, Franco-Santos RM, Andreu-Cazenave M, Brunelli L, Papadatou M, Palatinu A et al. Macrodebris and microplastics from beaches in Slovenia. Mar Pollut Bull 2014;89: 356-366.
crossref pmid
40. Alkalay R, Pasternak G, Zask A. Clean-coast index—a new approach for beach cleanliness assessment. Ocean Coast. Manage 2007;50(5):3522-362.

41. Witte BD, Devriese L, Bekaert K, Hoffman S, Vandermeersch G, Cooreman K, et al. (2014) Quality assessment of the blue mussel (Mytilus edulis): Comparison between commercial and wild types. Mar Pollut BulL 2014;85(1):146-155.
crossref pmid
42. Verla AW, Enyoh CE, Ngozi VE. Evaluation of Anthropogenic Carbon Dioxide (CO2) Concentrations along River Nworie, Imo State, Nigeria. Environ Pollut Climate Change 2018b;2: 159.

43. Galgani F, Fleet D, Franeker JV, Katsanevakis S, Maes T, Mouat J, et al. Marine Strategy Framework Directive: Task Group 10 Report Marine Litter. Publications of the European Communities. 2010.

44. Widmer WM, Hennemann MC. Marine debris in the Island of Santa Catarina, South Brazil: spatial patterns, composition, and biological aspects. J Coast Res 2010;26(6):993-1000.
crossref
45. Oigman-Pszczol SS, Creed JS. Quantification and Classification of Marine Litter on Beaches along Armação dos Búzios, Rio de Janeiro, Brazil. J Costal Res 2007;23(2):421-428.
crossref
46. Lee J, Hong S, Song YK, Hong SH, Jang YC, Jang M, et al. Relationships among the abundances of plastic debris in different size classes on beaches in South Korea. Mar Pollut Bull 2013;77(1):349-354.
crossref pmid
47. Kusui T, Noda M. International survey on the distribution of stranded and buried litter on beaches along the Sea of Japan. Mar. Pollut. Bull 2003;47(1-6):175-179.

48. Zhou P, Huang C, Fang H, Cai W, Li D, Li X, et al. The abundance, composition and sources of marine debris in coastal seawaters or beaches around the northern South China Sea (China). Mar Pollut Bull 2011;62(9):1998-2007.
crossref pmid
49. Kuo FJ, Huang HW. Strategy for mitigation of marine debris: Analysis of sources and composition of marine debris in northern Taiwan. Mar Pollut Bull 2014;83(1):70-78.
crossref pmid
50. Babatunde BB and Arinze OU. Suspended Marine Litter in Akwa Ibom State, Nigeria: A Case Study of Cross River, QUA Iboe River and Jaja Creek. JGEESI 2019;18(2):1-13.
crossref pdf
51. Santos IR, Friedrich AC, Sul JAI. Marine debris contamination along undeveloped tropical beaches from northeast Brazil. Environ Monit Assess 2009;148(1-4):455-462.
crossref pmid pdf
52. Chae DH, Kim IS, Kim SK, Song YK, Shim WJ. Abundance and Distribution Characteristics of Microplastics in Surface Seawaters of the Incheon/Kyeonggi Coastal Region. Arch Environ Contam Toxicol 2015;69(3):269-278.
crossref pmid pdf
53. Noren F. Small plastic particles in coastal Swedish waters. KIMO Sweden. www.n-research.se 2017. Accessed 26/8/ 2019.

54. Ryan PG, Bouwman H, Moloney CL, Yuyama M, Takada H. Longterm decreases in persistent organic pollutants in South African coastal waters detected from beached polyethylene pellets. Mar Pollut Bull 2012;64(12):2756-2760.
crossref pmid
55. Frere L, Paul-Pont I, Emmanuel R, Sebastien P, Jaffre J, Isabell B, et al. Influence of environmental and anthropogenic factors on the composition, concentration and spatial distribution of microplastics: A case study of the Bay of Brest (Brittany, France). Environ Pollut 2017;225: 211-222.
crossref pmid

Figure 1.
Indiscriminate dumping of plastics in Nigeria due to ignorance and poor implementation of the environmental law. Plastics dropped on streets normally end up in rivers when they were carried by erosion during the rainfall
eaht-34-4-e2019012f1.jpg
Figure 2.
Map of study locations and the pictures of the rivers
eaht-34-4-e2019012f2.jpg
Figure 3.
Macrodebris and microplastics sampling scheme
eaht-34-4-e2019012f3.jpg
Figure 4.
Macro litters at the shore comprised mainly of plastics (59%), metal (10%), cloth (7%), paper/cardboard (7%), rubber (7%), glass/ceramics (5%), medical and agro-based waste (3%) and wood (2%).
eaht-34-4-e2019012f4.jpg
Figure 5.
Surficial water filtration and microplastics recovered on cellulose filter paper
eaht-34-4-e2019012f5.jpg
Figure 6.
Proportion (%) of macrodebris in the entire area of study *PL: Plastic, RB: Rubber, CL: Cloth, GC: Glass/Ceramics, PC: Paper/Cardboard, ME: Metal, WD: Wood, OT: others
eaht-34-4-e2019012f6.jpg
Figure 7.
Proportion (in % of number of items/m2) of macrodebris of each of eight major groups at each river. *PL: Plastic, RB: Rubber, CL: Cloth, GC: Glass/Ceramics, PC: Paper/Cardboard, ME: Metal, WD: Wood, OT: others
eaht-34-4-e2019012f7.jpg
Figure 8.
Clean coast index (CCI) for the rivers in this study.
eaht-34-4-e2019012f8.jpg
Figure 9.
Images obtained under a microscope of the three major shape of microplastics encountered in the surficial water from the rivers; (a) fiber, (b) film, (c, d) and fragment.
eaht-34-4-e2019012f9.jpg
Figure 10.
Quantity of microplastics based on stations of the rivers (in particles/L)
eaht-34-4-e2019012f10.jpg
Figure 11.
Distribution of microplastics based on shape
eaht-34-4-e2019012f11.jpg
Figure 12.
Distribution of microplastics based on type. Error bars revealed 5 % standard error.
*PP-Polypropylene; PE-Polyethylene; PVC- Polyvinyl chloride; PS- Polystyrene; PET- Polyethylene terephthalate.
eaht-34-4-e2019012f12.jpg
Figure 13.
Regression analysis between macrodebris groups and microplastics by each group
eaht-34-4-e2019012f13.jpg
Table 1.
River name, elevation, close land use and comments
Location Name of River (community) Elevation (m) Close land use Comment
I OBIARAEDU (Abajah) 198 Farm lands, Laundry activities Mild anthropogenic input, major wastes received generally include debris from laundry activities etc., with little marine litter.
II NWANGELE (Abba) 153 Market (Nkwo mmiri), Car wash, Major road, Hospital High anthropogenic input, receives loads of wastes (mixed) from market < 100 m away during heavy rainfall. Wastes received generally include agro-waste, debris from automobile cars, detergents, spent oils, etc.
III OKUMPI (Umuozu) 165 Farm lands, Laundry activities Mild anthropogenic input, most of the river has been lost vegetation and not accessible at the time of the study. However, little marine litter such as degrading laundry soap pack was found. Major input is from runoff from farm lands.
IV OGBAJARAJARA (Isu) 210 Farm lands, Laundry activities, Car wash Mild anthropogenic input, major wastes received generally include debris from laundry activities etc., with moderate marine litter.
V ONUEZUZE (Amaigbo) 159 Road construction Mild anthropogenic input, major wastes received generally include debris from automobile cars, detergents, spent oils, etc., with little marine litter.
Table 2.
Clean Coast Index (CCI) ranking
CCI Grade Visual assessment
0–2 Very clean Very little debris is seen
2–5 Clean little debris is seen over a large area
5–10 Moderate A few pieces of debris can be detected
10–20 Dirty A lot of debris on the shore
20+ Extremely dirty Most of the shore is covered with plastic
Table 3.
Microplastics shape, type and their physical characteristics
Microplastics shape and type Physical characteristics
Shape
 Film Flexible and thin
 Fiber Very thin, long and can also be short
 Fragment Irregular shape, thick, sharp crooked edge
Type
 Polypropylene (PP) Slippery and elastic
 Polyethylene (PE) Slightly rigid, hard and of low strength
 Polyvinyl chloride (PVC) Rigid, very hard and very dense
 Polystyrene (PS) Rigid, transparent and looks like glass
 Polyethylene terephthalate (PET) Transparent, strong, lightweight and shatterproof
Table 4.
Comparison of total number of macrodebris with selected studies
Location Total number (items/m2) Season Reference
Nigeria 3,487 Rainy Present study
Slovenia 5,840 Dry [39]
Brazil 15,832 Dry [45]
South Korea 27,606 Rainy [46]
South Korea 8,205 Dry [46]
South China Sea 37,500 Not specified [48]
Northern Taiwan 9,319 Rainy [49]
Japan 32,212 Dry [47]
Table 5.
The amount and percentatge of macrodebris in the rivers by categories and groups
Categories Location I (%a) Location II (%a) Location III (%a) Location IV (%a) Location V (%a) Total amount of item (%b)
Groups
Plastics (PL)
Caps and lids 9 (9.6) 57 (61.29) N.D. 16 (17.2) 11 (11.83) 93 (12)
Lolly sticks, cutlery, cups 4 (5.9) 54 (80.59) 2 (2.99) 7 (10.14) N.D. 67 (0)
Drink bottles 13 (9) 98 (69) 2 (1) 21 (15) 8 (6) 142 (17)
Straws 2 (1) 103 (59) 3 (2) 62 (36) 3 (2) 173 (3)
Packaging for food 2 (3) 29 (42) 6 (9) 12 (18) 19 (28) 68 (3)
Bags+ nylon (including sachet water nylon) + sacs 4 (1) 321 (82) 13 (3) 41 (11) 9 (2) 388(5)
Toys 3 (6) 46 (92) N.D. 1 (2) N.D. 50 (4)
Cigarette lighter N.D. 19 (100) N.D. N.D. N.D. 19 (0)
Cigarette filter N.D. 8 (80) 1 (10) N.D. 1 (10) 10 (0)
Syringes N.D. 29 (91) N.D. 2 (6) 1 (3) 32 (0)
Mussel bags + pieces 4 (29) 6 (43) 2 (14) N.D. 2 (14) 14 (5)
Cotton bud sticks 11 (5) 168 (72) 2 (1) 37 (16) 14 (6) 232 (15)
Fishing ropes, string, cord 1 (4) 12 (43) 6 (21) 2 (7) 79 (25) 28 (1)
Cosmetics packaging N.D. 23 (85) N.D. 4 (15) N.D. 28 (0)
Fishing net floats N.D. 2 (66.67) N.D. 1 (33.33) N.D. 3 (0)
Foam (pieces) 3 (7) 19 (45) 17 (41) 1 (2) 2 (5) 40 (4)
Plastic pieces (unrecognizable) N.D. 94 (85) 11 (10) 6 (5) N.D. 111 (0)
Jerry cans N.D. 7 (100) N.D. N.D. N.D. 7 (0)
Masking tape N.D. 14 (78) N.D. 3 (17) 1 (5) 18 (0)
Condoms + packaging N.D. 9 (100) N.D. N.D. N.D. 9 (0)
Packaging for biscuits 5 (1) 179 (85) N.D. 18 (9) 8 (4) 210 (7)
Packaging for soap 11 (50) 164 (76) 5 (2) 27 (13) 9 (5) 216 (15)
Panty liners + packaging N.D. 28 (85) N.D. 5 (15) N.D. 33 (0)
Construction waste N.D. 12 (30) N.D. N.D. 28 (70) 40 (0)
Cigarette box 1 (5) 5 (24) 1 (5) 2 (9) 12 (57) 21 (0)
Buckets, flower pots N.D. 10 (67) 2(20) 3 (17) N.D. 15 (0)
Pens 2 (4) 39 (78) 1 (2) 2 (4) 6 (12) 50 (0)
Other N.D. 24 (83) 3 (10) N.D. 2 (7) 29 (0)
Total 75 1579 7 273 141 -
Rubber (RB)
Balloons, balls, toys N.D. 101 (89) 1 (1) 8 (7) 3 (3) 113 (47)
Shoes N.D. 32 (53) 1 (2) 21 (35) 6 (10) 60 (25)
Gummies N.D. 3 (37) 1 (13) N.D. 4 (50) 8 (3)
Other pieces 2 (4) 45 (76) 3 (5) N.D. 9 (15) 59 (25)
Total 2 181 6 29 22 -
Cloth (CL)
Clothing, shoes, hats, towels 1 (1) 67 (84) 2 (2) 4 (5) 6 (8) 80 (34)
Ropes 2 (2) 127 (90) 1 (1) 2 (1) 9 (6) 139 (59)
Other N.D. 11 5 N.D. 1 17 (7)
Total 3 205 8 6 16 -
Glass/ceramics (GC)
Pieces 2 (5) 23 (57) N.D. 4 (10) 11 (28) 40 (22)
Bottles, glasses 3 (7) 36 (80) 6 (13) N.D. 45 (24)
Plates, pots (cups) N.D. 52 (69) 1 (1) 19 (25) 4 (5) 76 (41)
Construction material N.D. 14 (61) N.D. N.D. 9 (31) 24 (13)
Total 5 125 7 23 24 -
Paper/cardboard (PC)
Cardboard (pieces, boxes) 5 (5) 72 (74) 4 (4) 13 (14) 3 (3) 97 (42)
Paper (incl. magazines) 9 (7) 92 (75) 1 (1) 17 (14) 4 (3) 123 (53)
Other (pieces) 2 (17) 5 (41) N.D. 3 (25) 2 (17) 12 (5)
Total 16 169 5 33 9 -
Metal (ME)
Caps, can lids 6 (7) 57 (63) N.D. 14 (16) 13 (14) 90 (26)
Drink cans 21 (16) 82 (64) 2 (2) 9 (7) 14 (11) 128 (38)
Aluminium wrapping 2 (8) 21 (88) N.D. N.D. 1 (4) 24 (7)
Pieces N.D. 16 (41) 4 (10) 11 (28) 8 (21) 39 (12)
Wire, barbed wire N.D. 3 (30) N.D. N.D. 7 (70) 10 (3)
Construction N.D. 16 (46) N.D. 5 (14) 14 (40) 35 (10)
Other 5 (33) 3 (20) 2 (13) 1 (7) 4 (27) 15 (4)
Total 34 198 8 40 61 -
Wood (WD)
Cork 2 (40) 2 (40) N.D. 1 (20) N.D. 5 (6)
Ice lolly sticks N.D. 4 (50) 1 (12.5) 2 (25) 1 (12.5) 8 (9)
Matches, fireworks 4 (8) 27 (53) 2 (4) 14 (27) 4 (8) 51 (61)
Other 5 (25) 3 (15) 3 (15) 2 (10) 7 (35) 20 (24)
Total 11 36 6 19 12 -
Other (OT)
Medical waste (container) N.D. 12(75) N.D. 4 (25) N.D. 16 (17)
Agricultural waste (Maize) 2 (3) 41 (53) 18 (23) 11 (14) 5 (7) 77 (83)
Total 2 53 18 15 5 -

* N.D.: Not detected

a: percentage in the total amount of items in the category

b: percentage of each category in the group

Table 6.
Quantity of microplatics in surficial water (in particles/L)
Shape Sampling points Location I Location II Location III Location IV Location V
Fiber U1 24 44 19 31 27
U2 19 28 14 19 21
M1 27 67 27 50 30
M2 26 88 20 31 29
D1 34 95 71 65 42
D2 89 61 63 92 64
Total 219 383 214 288 213
Film U1 9 12 2 33 31
U2 7 29 14 19 9
M1 19 68 5 27 22
M2 15 72 8 22 28
D1 39 91 23 69 41
D2 43 102 41 93 39
Total 132 374 93 263 170
Fragment U1 23 66 8 51 17
U2 14 86 2 57 45
M1 27 95 5 62 49
M2 20 102 9 97 60
D1 91 120 11 101 96
D2 93 129 6 94 98
Total 268 598 41 462 365
Other U1 26 34 9 35 31
U2 13 43 5 45 36
M1 18 14 7 49 19
M2 11 28 11 36 29
D1 9 47 21 17 11
D2 21 35 39 21 28
Total 98 201 92 203 154
Total 717 1556 440 1216 902
Mean 179.25 389 110 304 225.5
SDV 78.08 162.57 73.46 111.21 96.28
CV (%) 43.56 41.79 66.78 36.58 42.7

*U-Upstream; M-Midstream; D-Downstream; SDV- Standard deviation; CV-Coefficient of variations; Other may include granules, foam, etc.

Table 7.
Quantity of microplastics based on plastic types (in particles/L)
Sampling points Location I Location II Location III Location IV Location V
PE Upstream 41 78 14 90 37
Midstream 56 92 7 74 66
Downstream 83 70 107 197 42
Mean 60 80 42.67 120.33 48.33
SDV 17.38 11.14 55.82 66.88 15.5
CV (%) 28.97 13.93 130.82 55.58 32.07
PP Upstream 6 14 3 45 27
Midstream 17 48 11 69 13
Downstream 74 169 19 73 66
Mean 32.33 77 11 62.33 35.33
SDV 29.8 81.47 8 15.14 27.47
CV (%) 92.17 105.81 72.73 24.29 77.75
PVC Upstream 26 79 3 72 23
Midstream 47 104 18 89 38
Downstream 69 74 29 41 72
Mean 47.33 85.67 16.67 67.33 44.33
SDV 17.56 16.07 13.05 24.34 25.11
CV (%) 37.1 18.76 78.28 36.15 56.64
PS Upstream 23 69 39 27 41
Midstream 39 85 10 11 24
Downstream 67 56 68 21 62
Mean 43 70 39 19.67 42.33
SDV 18.18 14.53 29 8.08 19.04
CV (%) 42.28 20.75 74.36 41.08 44.98
PET Upstream 34 98 11 46 80
Midstream 4 143 40 127 113
Downstream 70 263 23 201 143
Mean 36 168 24.67 124.67 112
SDV 26.98 85.29 14.57 77.53 31.51
CV (%) 74.94 50.77 59.06 62.19 28.13
Other Upstream 5 4 3 10 9
Midstream 0 62 6 4 12
Downstream 56 48 29 19 34
Mean 20.33 38 12.67 11 18.33
SDV 25.3 30.27 14.22 7.55 13.65
CV (%) 124.45 79.66 112.23 68.64 74.47

*PP-Polypropylene; PE-Polyethylene; PVC- Polyvinyl chloride; PS- Polystyrene; PET- Polyethylene terephthalate; Other- Not identifiable; SDV- Standard deviation; CV-Coefficient of variations;

TOOLS
PDF Links  PDF Links
PubReader  PubReader
ePub Link  ePub Link
XML Download  XML Download
Full text via DOI  Full text via DOI
Download Citation  Download Citation
  Print
Share:      
METRICS
30
Crossref
0
Scopus
7,265
View
169
Download
Editorial Office
Division of Environmental Science and Ecological Engineering, Korea University
145 Anam-ro, Seongbuk-gu, Seoul 02841, Korea
Tel : +82-32-560-7520   E-mail: envitoxic@gmail.com
About |  Browse Articles |  Current Issue |  For Authors and Reviewers
Copyright © 2024 by The Korean Society of Environmental Health and Toxicology & Korea Society for Environmental Analysis.     Developed in M2PI