


Introduction
On average, global electrical and electronic equipment consumption increases by 2.5 million metric tons (Mt) annually [1]. As the quantity of electronic production is accelerated, consequently, it also increases the amount of damping obsolete, broken, or irreparable electronic equipment [2,3]. Such end-of-life electronic devices that can no longer be used for their intended purpose are called e-waste or waste electrical and electronic equipment (WEEE). However, electronic equipment, which is not broken or not reaches to-end-of-life, though discarded by its owners, is also considered e-waste [4]. Nevertheless, this definition is relative, as an electronic product that is considered waste in one country, may be considered a resource in another [5]. E-waste is classified into six categories; temperature exchange equipment (e.g., refrigerators, freezers, air conditioners, heat pumps), Screens and monitors (e.g., televisions, laptops, notebooks, tablets, and computer monitors), Lamps (e.g., fluorescent lamps, high-intensity discharge/HID lamps, and light-emitting diodes/LED lamps), Large equipment (e.g., washing machines, clothes dryers, electric stoves, large printing machines, copying equipment, and photovoltaic panels), small equipment (e.g., vacuum cleaners, microwaves, ventilation equipment, toasters, electric kettles, electric shavers, scales, calculators, radio sets, video cameras, electrical and electronic toys, small electrical and electronic tools, small medical devices, small monitoring and control instruments), and small IT and telecommunication equipment (e.g., mobile phones, GPS, pocket calculators, routers, personal computers, printers, telephones) [6].
Today, e-waste has become the fastest-growing waste stream in the world, which is almost three times greater than the growth rate of other municipal solid waste, thus it's been dubbed a "tsunami of e-waste" by the United Nations [7-9]. Since 2014, the global production of e-waste has increased by 9.2 Mt with a 3-5% annual growth rate, this has led to speculation that the e-waste generation could double within merely 16 years [1,7]. In 2019, 53.6 Mt of electronic waste was generated worldwide, of which only 17.4% was officially collected and recycled properly and the rest 82.6% (44.3 Mt) is uncertain [1]. Now-a-days, informal e-waste dismantling activities and the disposal of waste into the open soil/land or water bodies is becoming a burning issue world-wide, which poses great risks to human health, environment and the ecosystem owing to the release of toxic components [10,11]. About 8% of e-waste is thrown into garbage cans and then landfilled or incinerated [1]. The disposal of e-waste is strictly regulated in developed countries and when it comes to developing countries, the issue is in the worst position due to the lack of laws or regulations and public awareness for proper e-waste disposal [5,10].
Despite the enormous generation, e-waste has been banned from landfills in many developed countries since the 1980s. In 1990s, European Union (EU), Japan, United States (US) and several other industrialized countries began to strict their regulation on e-waste; simultaneously prioritized e-waste retrieval and recycling systems and consequently started to export their majority of e-waste to developing countries [12]. Nevertheless, in 1992, the Basel Convention on the Control of Transboundary Movements of Hazardous Wastes and their Disposal was established in an attempt to limit hazardous waste importation. However, the Basel Convention exempts secondhand items and some e-waste scrap from regulation, allowing developed countries to continue transporting e-waste to underdeveloped countries [13]. This has exacerbated the problem in developing countries as 50-80% of the e-waste generated by developed countries is exported to developing countries, including China, India, Pakistan, Vietnam, Philippines, Ghana, Nigeria, and a number of other African countries, even illegally [14-16]. Over the past decade, e-waste generation in Asia becomes signifying and turn out to be the top-ranked region. Particularly, South-Asia has shown one of the most dumping venues for e-waste, while India, Pakistan, Bangladesh, and Sri Lanka are the most famous destinations [17]. Moreover, for the last two decades, many studies have been conducted worldwide, though not far for South-Asia, also no significant impact was given to managing e-waste and its negative effects [18].
In the light of reported works in the field of e-waste, it is conceivable that yet there has not been given enough attention considering South-Asia as well, even booming the issue. Accordingly, a systematic review approach was used in this paper to explore how far the e-waste issue mounted in the region, along with identifying research gaps, and issues that arose relevant to the environmental and health challenges. The latter part of the paper discussed the possible strategies to improve the e-waste management system in South-Asia.
Data sources, collection and analysis
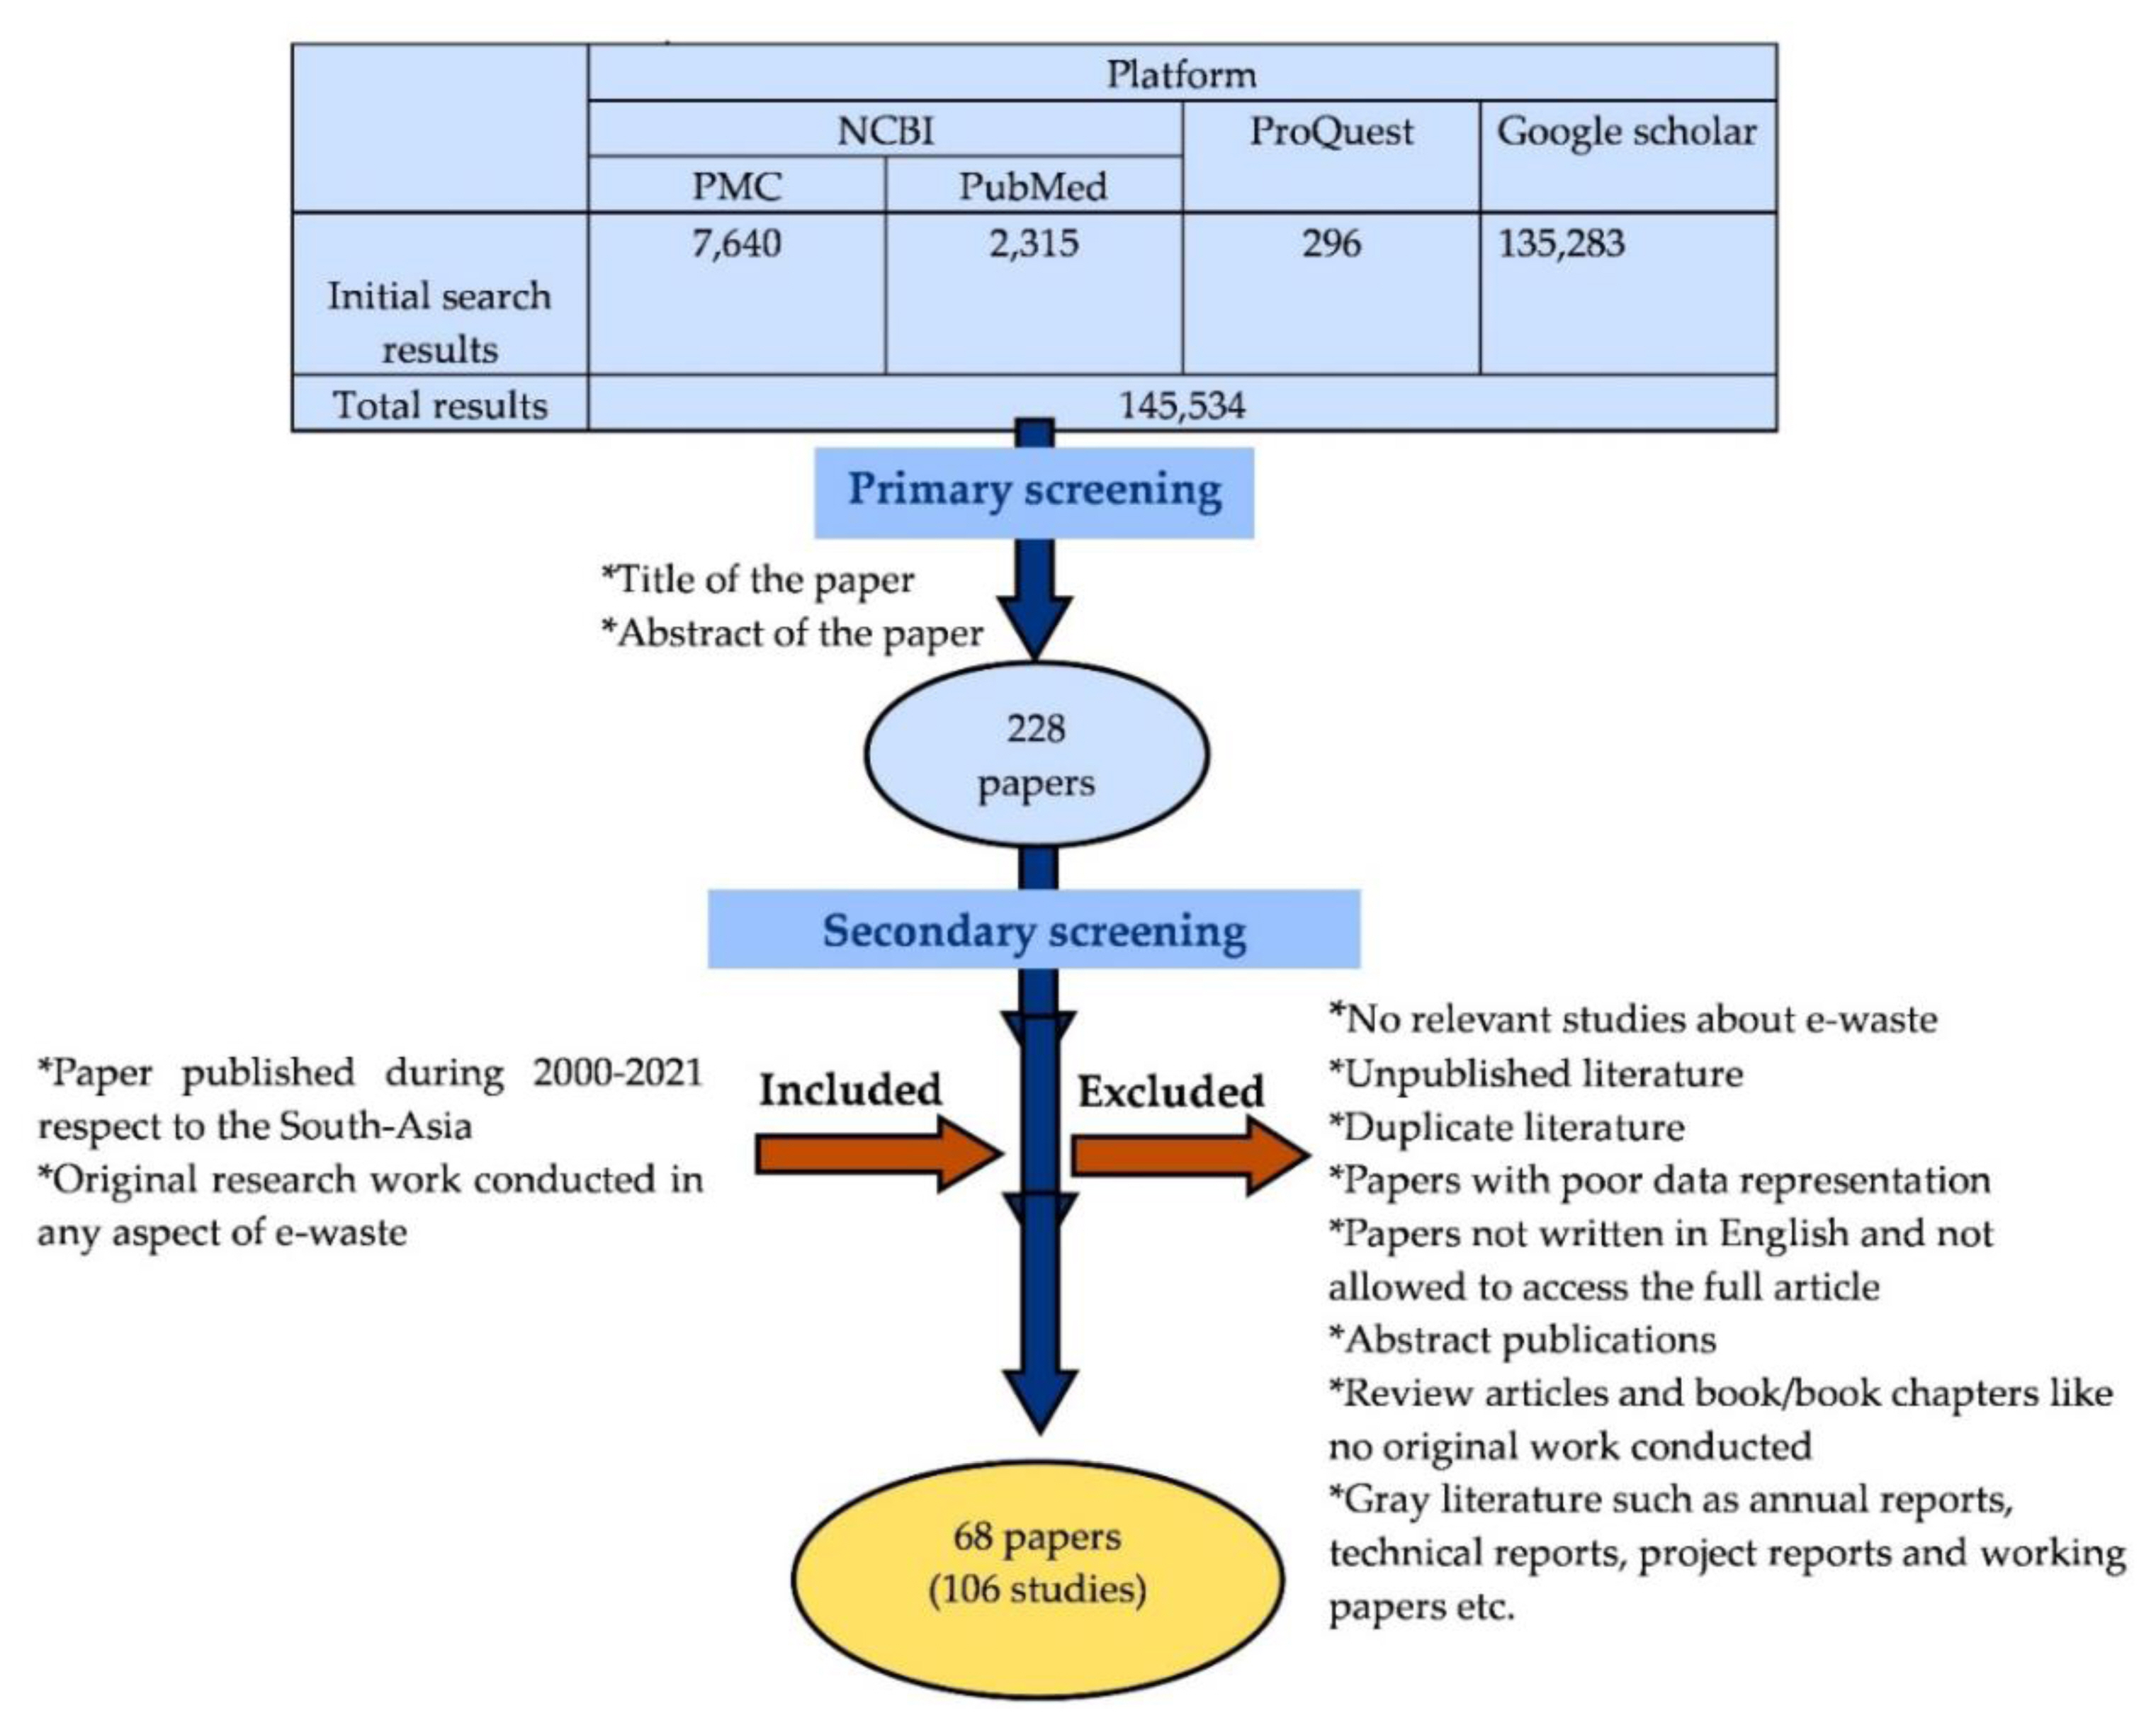
A structured term search was done to acquire information related to e-waste, using web-based databases such as National Center for Biotechnology Information (NCBI), ProQuest and Google Scholar database. The research articles were selected during the past two decades. The searched terms are country + “e-waste” and country + “waste electrical and electronic equipment”. 145,534 results were found in this initial search. The primary literature search results are presented in Table 1.
However, the majority of them were eliminated during primary screening because they were irrelevant to our scope and 68 papers were chosen from secondary screening. Therefore, the final analysis was done based on 106 studies published in the aforementioned 68 papers. Furthermore, supportive information such as e-waste statistics was collected via Google general. The summary of the literature selection procedure shows in Figure 1.
Composition of e-waste
The composition of e-waste is quite complex, heterogeneous and contains more than 1000 different substances [13]. In a broad sense, it includes ferrous and non-ferrous metals, plastics, glass, wood and plywood, printed circuit boards, concrete and ceramics, rubber, and so on. It is noteworthy that the type and amount of waste also vary dramatically among product categories. For example, printed circuit board scrap is made up of roughly 40% metals, 30% plastics, and 30% ceramics [19]. Some of the substances released from the e-waste are said to be non-hazardous, while others heavy metals such as; antimony (Sb), arsenic (As), bismuth (Bi), cadmium (Cd), cobalt (Co), copper (Cu), indium (In), iron (Fe), lead (Pb), lithium (Li), mercury (Hg), molybdenum (MO), nickel (Ni), palladium (Pd), silver (Ag), tin (Sn), titanium (Ti), and vanadium (V), also many more organic chemicals are considered toxic, nevertheless, based on the amount and the forms of contamination [20-22]. Table 2 shows such major types of components of e-waste concerning electrical and electronic equipment.
Present state of global e-waste generation
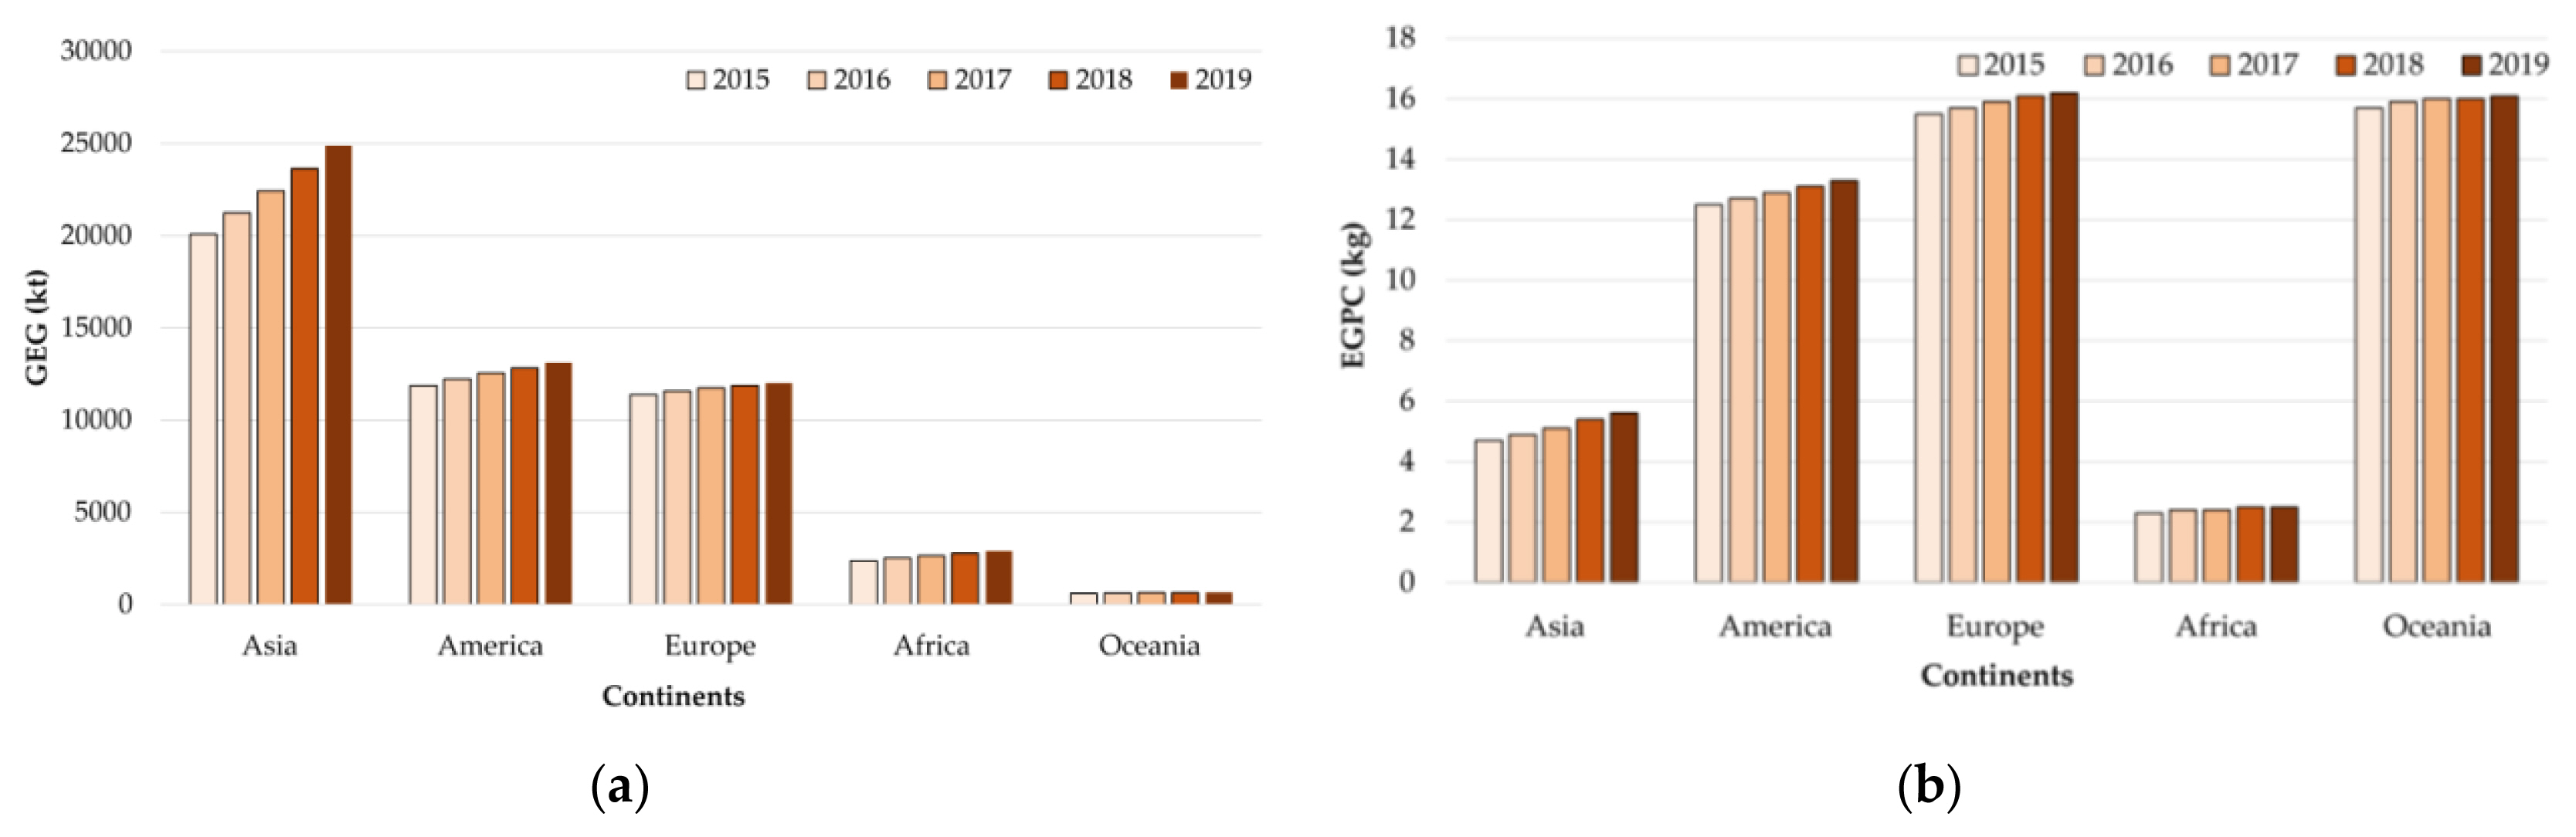
In 2014, the amount of e-waste generated was estimated to be around 44.4 Mt (6.4 kg per capita), there is no overall data collected for the year 2020 due to the COVID 19 pandemic, though it was assumed that gross e-waste generated (GEG) in 2020 could be about 55.5 Mt and EGPC 7.3 kg by neglecting the effect of the pandemic. However, if considering the effect of the pandemic there could be a slight drop in e-waste generation in 2020 and 2021. The statistics show that the overall annual e-waste generation rate during the several past years was almost 2 Mt. It was projected that the amount will be increased to 74.7 Mt (9 kg per capita) by 2030. The statistics show that Asia produced the greatest volume (24.9 Mt) of e-waste in 2019, followed by the Americas (13.1 Mt), Europe (12 Mt), Africa (2.9 Mt), and Oceania (0.7 Mt). There are no available data for e-waste generation in Antarctica as per the researchers’ knowledge, however, Europe produced the greatest e-waste generated per capita (16.2 kg), followed by Oceania (16.1Kg), America (13.3 kg), Asia (5.6kg) and Africa (2.5 kg). Following Figure 2 illustrates the amount of e-waste generated over the last five years. Considering the type of waste, small equipment makes up the majority of worldwide e-waste (17.4 Mt) generated in 2019, followed by large equipment (13.1 Mt), and temperature exchange equipment (10.8 Mt). In addition, screens and monitors, small IT and telecommunication equipment, and lamps share the small portion as 6.7 Mt, 4.7 Mt, and 0.9 Mt respectively. Temperature exchange equipment has grown at the fastest rate during the last six years, with an average annual growth rate of 7% (based on total weight), following large equipment (5%), lamps and small equipment (4%). Smaller IT and telecommunications equipment, on the other hand, has grown at a slower rate. In contrast, due to the replacement of large products with lighter flat panel displays, the volume of screens and monitors has decreased by 1%, however, the number of units has continued to expand [1].
South-Asia as a hub of e-waste
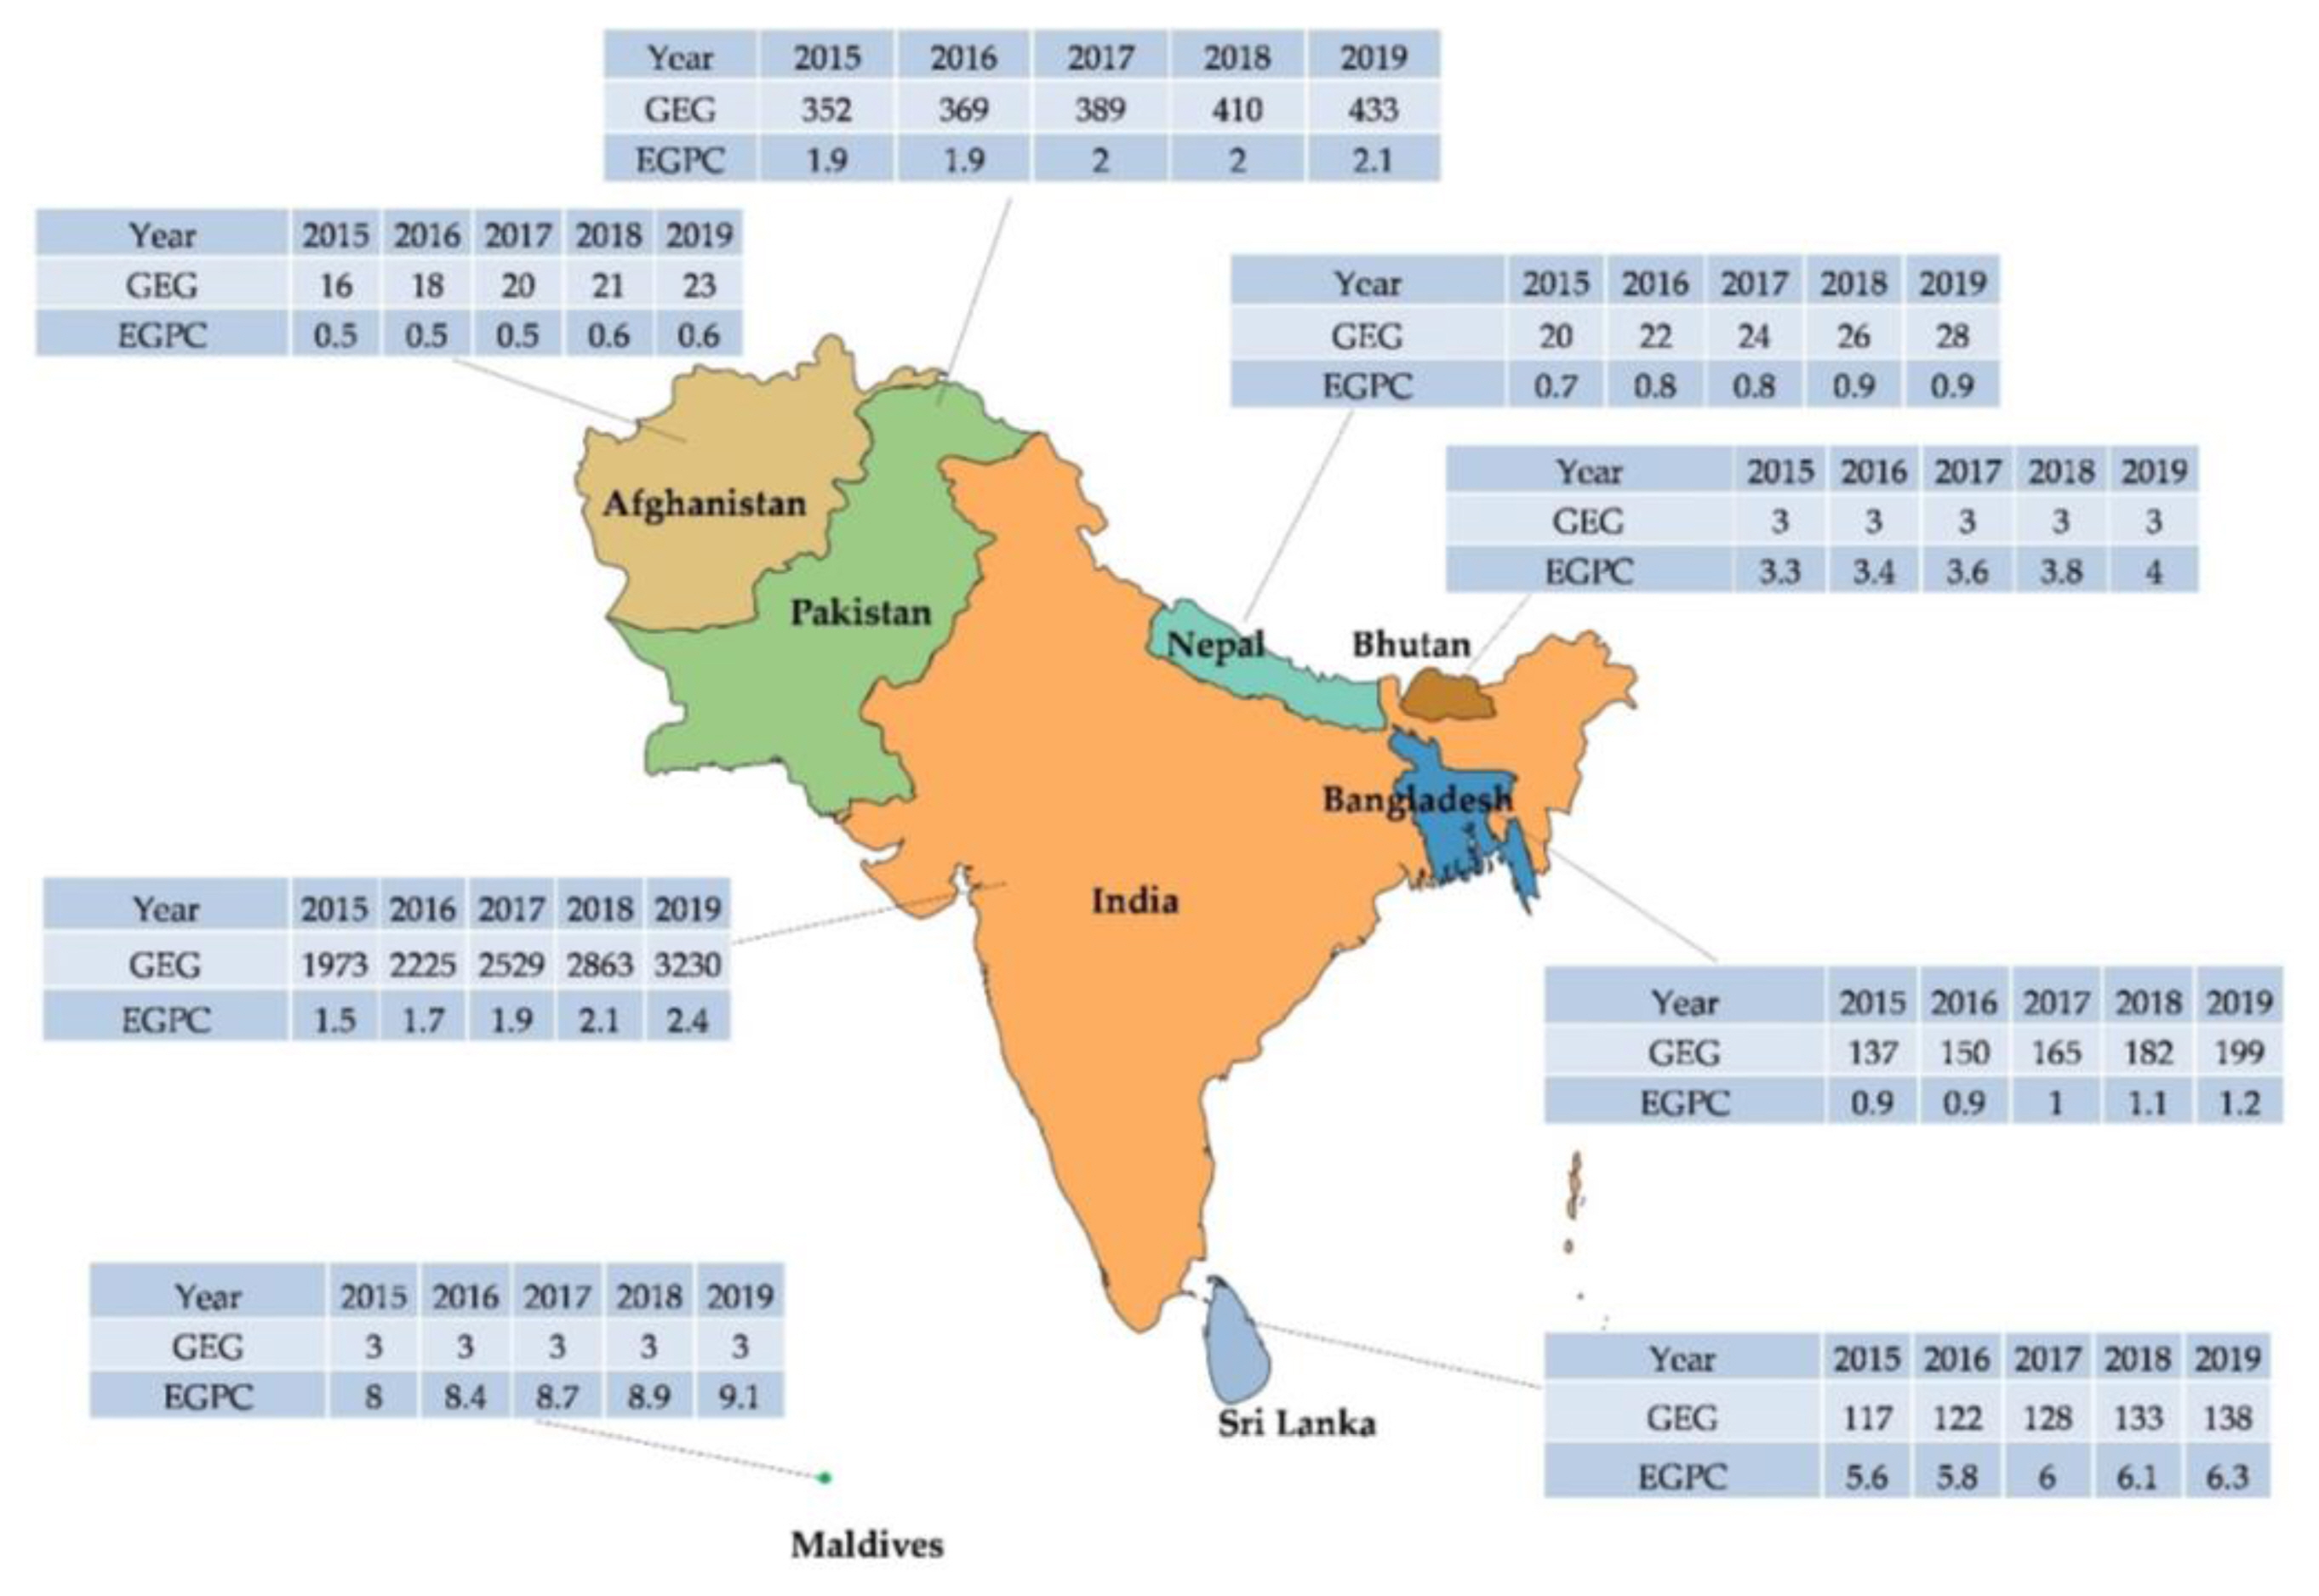
In comparison to the rest of Asia, the e-waste scenario in South-Asia is becoming quite worse than before. South-Asia produced 2,621 kt of e-waste in 2015, and production has steadily increased each year with production totaling 2,912 kt, 3,261 kt, 3,641 kt, and 4,057 kt in 2016, 2017, 2018, and 2019 respectively. In 2015, e-waste generation was 13% when comparing the whole of Asia and 1% increases annually and it was about 16% in 2019. Based on those statistics, it is clear that with comparison to the rest of the Asian regions e-waste generation appears to be enormous in South-Asia. India is the leading country producing the highest amount of e-waste in South-Asia, in 2019, India produced 433 kt of e-waste, accounting for 79.6% of all waste generated [26]. This is not a surprise as India owns one of the largest electronic markets (particularly IT and telecommunication) in the world [27], simultaneously generating a tremendous amount of e-waste become the 5th world's largest e-waste producing nation [28]. Pakistan has become the next highest e-waste (10.6%) generator in the region, followed by Bangladesh (4.9%), Sri Lanka (3.4%), and the rest of 1.5% shared by the other countries [26]. Figure 3 shows the scenarios explained. Note that in the region, the majority (80%) of e-waste comes from India, which comprises of old computers, laptops, cell phones, cameras, air conditioners, televisions, and LED lamps [29,30].
Most of the e-waste that arrives in South Asian countries comes from the US, UK, and the European Union. No exact figures were found through the literature survey, though it is clear that a considerable amount of waste is received annually with or without the proper approval. It was estimated that around 95.4 kt of unlicensed e-waste is annually received in Pakistan [6]. Furthermore, 70-80% of imports are coming to Pakistan from the US and 10-15% are from the UK. The rest are coming from Canada, UAE, Singapore, Australia, Spain, China, and Korea [32]. In Bangladesh, more than 2.7 million tons of electronic waste are generated every year, the ship-breaking yard occupying the highest position with 2.5 million tons. Due to the widespread use of unbranded short-end-of-life products, television sets rank second with 0.182 million tons of annual electronic garbage products [10,12]. As well, over the last two decades, it has produced 10,504 tons of toxic e-waste due to broken cell phones [32]. However, according to the consumption-based evaluation computers and their accessories, printers, televisions, mobile phones, refrigerators, air-conditioners, photocopying machines, washing machines, and batteries are the top ten e-waste generated in the country during the past several years [33]. Unfortunately, the statistics are extremely lacking in the other countries.
Current research trends and gaps in South-Asia
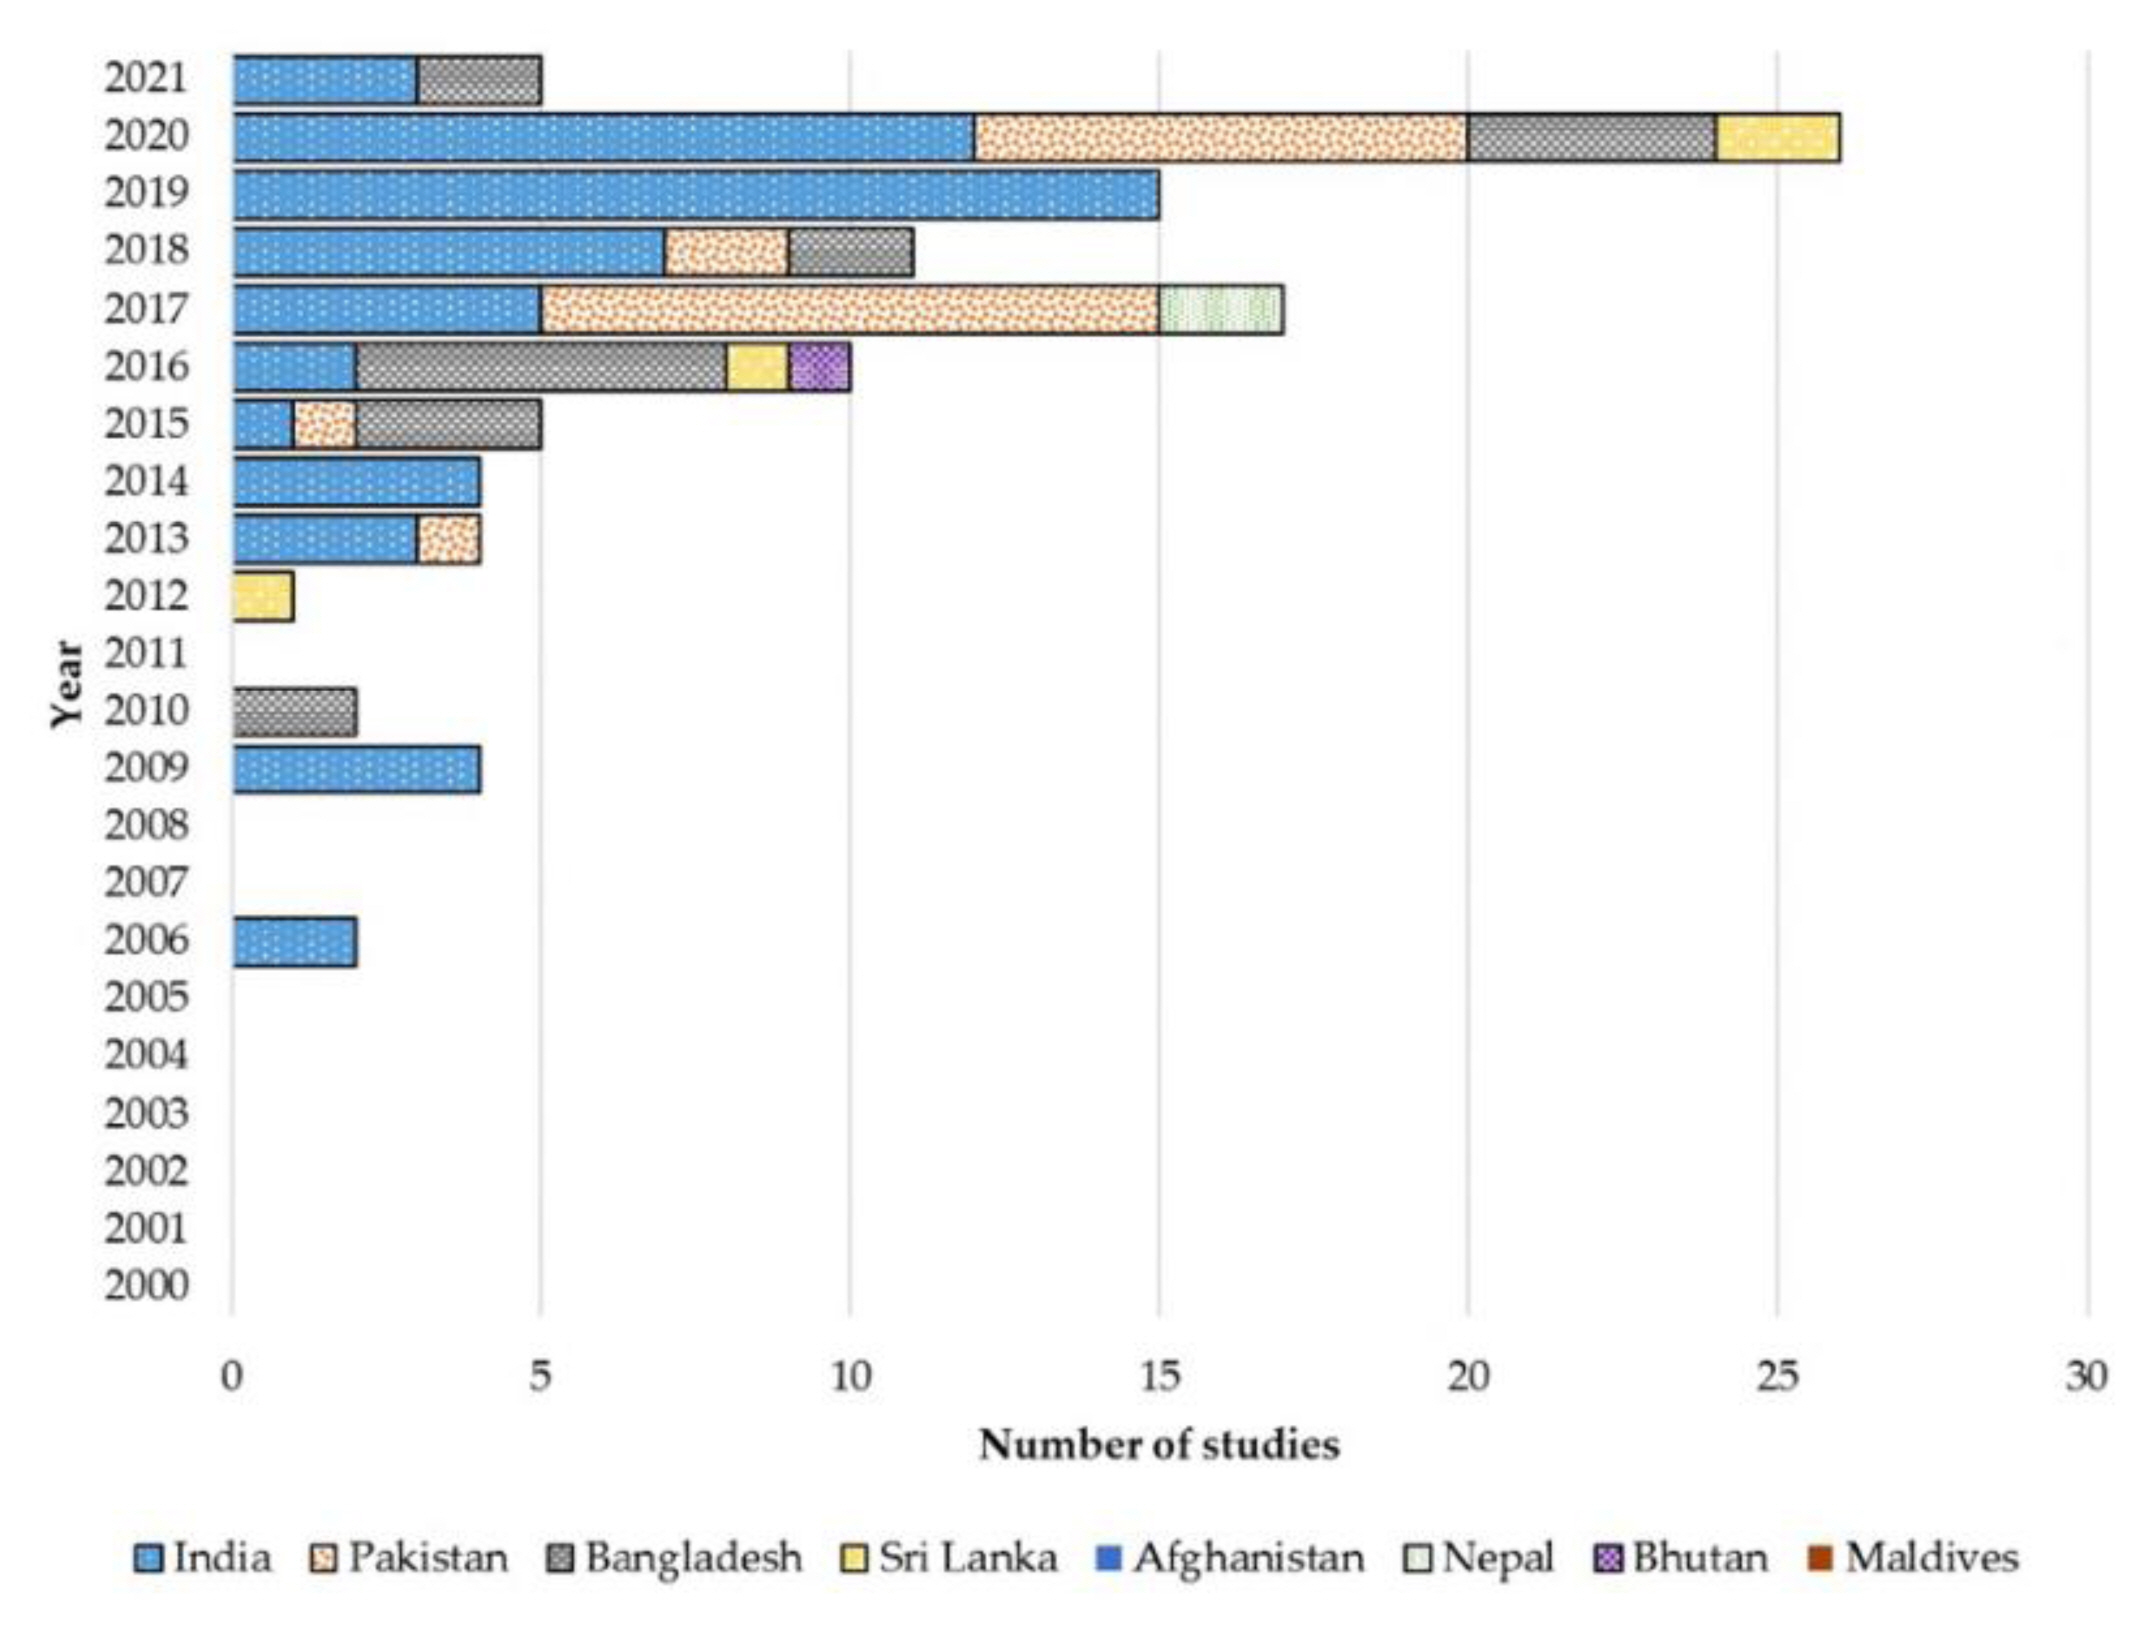
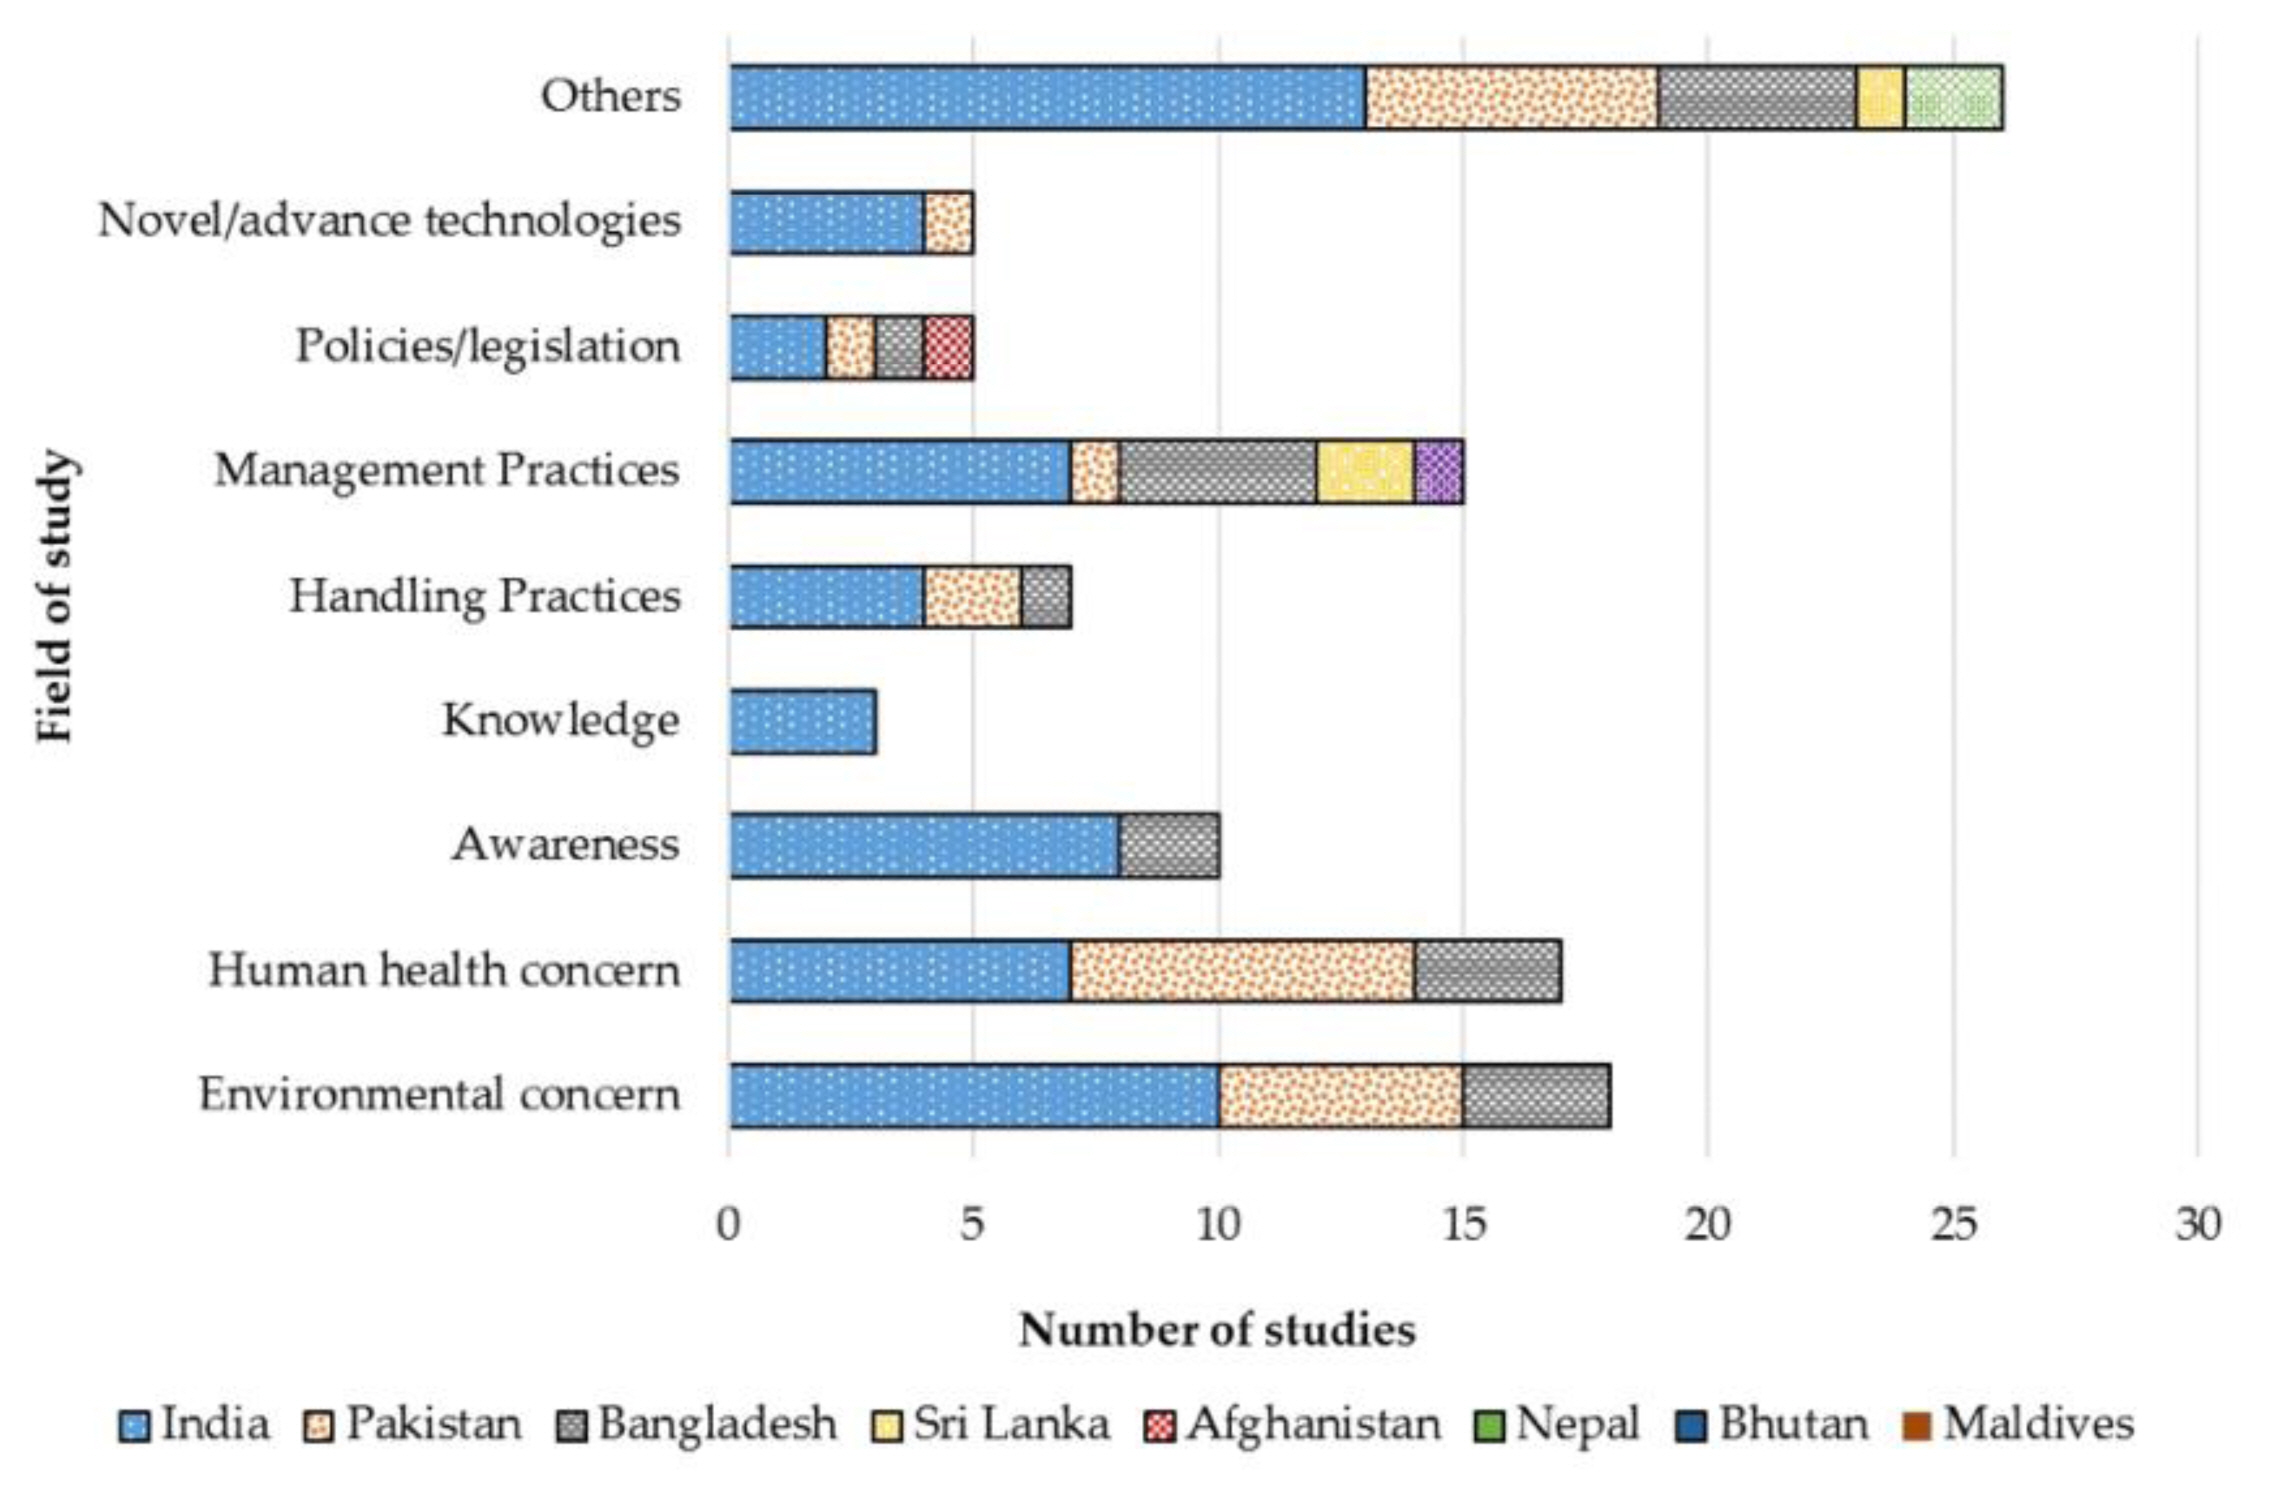
Despite the fact that e-waste is increasing at an alarming rate, few studies are being conducted in South Asian countries to respond. Over the 20 years of the literature survey, only 106 studies have been conducted in South-Asia, the majority of which (26) were conducted in 2020. As well, about 85% of studies were conducted after 2013. Most of the studies have been conducted in India (54%), followed by Bangladesh (23%), Pakistan (16%), Sri Lanka (4%), Nepal (2%), and Bhutan (1%). Unfortunately, there are no studies carried out in Afghanistan and Maldives. Figure 4 summarizes the literature survey findings. As shows in Figure 5, most of the studies have been conducted by looking at environmental and human health concerns (30%), management strategies (13%), public/participant awareness (10%), and handling practices (8%) on e-waste. As well, several studies focused on legal implementation and novel/advanced strategies. In addition, few studies have been conducted in different aspects such as social impact, cost-benefit, characterization of waste etc.
Catastrophic nature of e-waste, risks to the environment and human health in South-Asia
As e-waste became an excellent business, many warehouses emerged especially in developing countries, particularly to extract valuable materials such as gold and silver and revenue more than 20 billion dollars annually only by recapturing 15% of materials [4,30]. Nevertheless, most of the warehouses in developing countries are not properly functioning, and unsafe informal e-waste recycling using low-cost primitive techniques (e.g., open burn) has become prevalent due to the higher cost of formal recycling facilities [34].
The lack of rules or policies, as well as the failure to enforce the rules that had been developed, exacerbated the problem [35]. As a result, there has been a higher level of pollutants contaminated in the air, water, and sediments associated with the recycling/e-waste processing factories [16]. As well, threats and the degree of the hazardous is depending upon the type of e-waste and manner that the individuals involved and the nature of operations [36-39]. The environmental and health effects of e-waste management in India are well documented in the scientific literature among other Asian countries.
Environmental concern
It is consumable that few studies have been conducted in south-Asia even considering the impact of e-waste on the environment, though it was evidence that informal dumping of such waste could cause a number of detrimental effects on the environment. Discharge of chemical stripping (e.g., nitric and hydrochloric acid) of e-waste can cause adverse effects on the surrounding environment such as the alternation of native microbial communities, soil physio-chemical properties, carbon cycle, plant productivity etc. [19,40]. Jiang et al. [41] have reported that hazardous chemicals emitted from e-waste alter soil characteristics such as pH, total organic carbon, total nitrogen, and ultimately deplete soil microbial diversity.
Furthermore, Jiang et al. [41] found that the unpolluted studied sites are dominated by several phyla, namely, Proteobacteria, Actinobacteria, Firmicutes, Chloroflexi, Acidobacteria, and Planctomycetes. Moreover, the authors have recognized that polluted soils were dominated by Bacillus spp. due to their capability to tolerate the heavy metals and degrading organic pollutants released from the e-waste. Meanwhile, the researchers have recorded that the presence of a higher amount of Zn (effect on microbial enzymatic activities and kill) accumulation in soil, therefore the extreme microbial diversity could further decrease. In contrast, Kumar et al. [42] have found the dominant group of Pseudomonas spp. in e-waste recycling sites, as they tolerate the toxic environment, particularly heavy metal— gold (Au) and silver (Ag).
Ha et al. [43] conducted a comprehensive study regarding environmental contamination at a number of e-waste recycling sites in Bangalore and Chennai in India. In the study, Ha et al. [43] have analyzed the soil samples in Bangalore recycling sites and found higher concentrations of heavy metals in the order: Cu, Mn, Zn, Pb, Sn, Cr, V, Ag, Sb, Co, Cd, Hg, Mo, In, Bi, and Ti higher to lower. Further, Cu, Sb, Hg, and Pb in some soils were found over the recommended level set by US Environmental Protection Agency (EPA). Moreover, atmospheric contamination of Zn, MO, Mn, Cr, Cu, V, Ag, and Co in Bangalore recycling areas is higher than compared to Chennai city. Ha et al. [43] also have found the highest-level atmospheric contamination of Zn followed by Cu, Sn, and Mo, recycling sites in Bangalore. While comparing both areas, Cr, Mn, and Cu are higher in Bangalore than Chennai, while other elements are higher in Chennai. A similar study conducted by Pradhan and Kumar [44] in Delhi (India), have found high levels as (17.08 mg/kg), Cd (1.29 mg/kg), Cu (115.50 mg/kg), Pb (2,645.31 mg/kg), Se (12.67 mg/kg) and Zn (776.84 mg/kg) in surface soils of open burning sites of Mandoli, the e-waste recycling area in Delhi, India. The results also indicated that the level of contamination is well over the EPA recommendations. Furthermore, Pradhan and Kumar [44] analyzed the grass samples (Cynodon dactylon) grown in those recycle areas and found a higher level of accumulation of Ag, Cd, Co, Cu, Fe, Ni, Pb, and Zn. Nevertheless, the researchers also found that contamination levels varied significantly among the samples, with Fe (109.06-84.72 mg/kg), Zn (80.23-65.30 mg/kg), and Cu (23.90-11.65 mg/kg) being the three major elements found in higher concentrations, while other elements were found in concentrations well below 3 mg/kg in all samples. Interestingly, no evidence of accumulation of As, Cr, Hg, and Se in plant samples was recorded. In addition, Pradhan and Kumar [44] have collected tube well samples from residential houses near the e-waste recycling area and found that heavy metal contamination is below the county and WHO maximum permissible level. In contrast, water sample collect within the recycling area found to be the exceeded level of Al (3.67±0.005 mg/L), As (0.04±0.01 mg/L), Cr (0.60±0.01 mg/L), Pb (0.04±0.002 mg/L), and Cd (0.05±0.02 mg/L), which is above the both country/WHO standard; 0.20, 0.01, 0.05, 0.01 and 0.003 mg/L, respectively.
On the other hand, a similar study conducted by Iqbal et al. [31] found that Dechlorane Plus (DP) and “novel” brominated flame retardants (NBFRs) were often detected in high concentrations in soil samples collected from e-waste recycling areas, Karachi city in Pakistan. Further, Iqbal et al. [31] have detected that decabromodiphenyl ether (726 ng/g), decabromodiphenyl ethane (551 ng/g), 1,2-bis (2,4,6-tribromophenoxy), ethane (362 ng/g), and triphenyl-phosphate (296 ng/g) was found to be prevalent in soils. Furthermore, Iqbal et al. [31] have reported that phosphorus-based organic flame-retardants (5903–24986 ng/m3) were prevalent in the air, where e-waste recycling areas, Karachi city.
Human health concern
In the literature, health impacts due to e-waste have been extensively investigated, despite the South-Asia. Unprotected informal processing such as low-tech manual dismantling, open burning, and acid leaching brings tremendous occupational risks, thus many studies have been conducted at this point [45-47]. An unprotected manual gathering of e-waste also gives a threat to the informal collectors [48], due to accidental contact with toxic materials, via inhalation or ingestion of contaminated water, air, and food supplies [31]. Today, millions of young children, adolescents, and women of childbearing age coming from financially stressed families in Africa, Latin America, and Asia are found employment opportunities in the e-waste dumps or warehouses [49]. In India, about a million underprivileged people work in manual recycling operations [20]. In addition, according to the reports, a considerable number of workers in Bangalore recycling slum site, recycling facility-waste/disposal site in Perungudi Tamil Nadu, and Chennai are suffering from multiple health issues [35]. Hundreds of labourers including teenage kids are working for a very low wage in e-waste warehouses at Rawalpindi in Pakistan and owing to the lack of safety measurements such as safety glows, goggles and protective clothes, the workers are exposed to dangerous chemicals and are suffering from various health issues [46,49]. In Bangladesh, heavy metals such as lead, mercury, cadmium, zinc and chromium, PCB, dioxin, and furan expose more than 30 million workers. About 50,000 child workers are involved in the non-formal e-waste collection and recycling process. Unfortunately, every year, more than 15% of child workers die because of unsafe working conditions and more than 83% are exposed to harmful compounds, becoming sick and living with long-term illnesses [32]. Further, a mixture of such contaminants could elevate the problem also by giving various toxic symptoms [50], where once contacted and some of the possible human health risks due to toxic contamination shows in Table 3.
Pascale et al. [48] and Decharat and Kiddee [47] comprehensively studied the heavy metal effect on child labourers and adults respectively. A study by Pascale et al. [48] have assessed the Pb contamination of children and adolescents due to informal recycling and the researchers have found that the burning of cables is the main reason for such exposure. According to Pascale et al. [48] findings, out of 69 children and adolescents, 28.9% of child labourers are directly exposed to heavy metals, unfortunately, 7.3% of children become patients due to Pb exposure. In a study, Decharat and Kiddee [47] have found that out of 71 informal e-waste recycling workers 19 (26.8%) of them are suffering from blurred vision due to exposure to heavy metals; Pb, Cd, and Mn. The study further revealed that another 26.8% of workers are suffering from elicit allergies and dermatitides such as rashes or itching, while 25.4% exhibited the neurological symptoms—hand-and-feet numbness. In addition, about one-quarter of the respondents also suffer from headaches. Skin irritation, burning of the eyes, and breathing difficulties are some of the common symptoms among the labourers who are engaged in the informal e-waste recycling practices in Musheerabad, Hyderabad [53]. Ha et al. [43] have analyzed the heavy metal accumulation in labours using hair samples, who are working in e-waste recycling sites in Bangalore and Chennai. Furthermore, Ha et al. [43] have recognized that the heavy metal accumulations in workers are at a threatening level. According to the results, Zn was the highest accumulated in the common e-waste recyclers, followed by Cu, Pb, and Mn. In addition, the report has revealed that the concentrations of heavy metals are site-specific as correlated with the recycling method. Further, a remarkably high level of Ag (61 μg/g dry weight) was found associated with the people who are working in the Ag extraction process. Moreover, they have discovered that the workers had an accumulation of Mo and Cd at a threatened level. For instance, Ha et al. [43] have reported the contamination of Sb and Bi as well, though not common among the people.
Iqbal et al. [31] warn the labourers who are working long term under the contaminated environment, without following any safety measurements as they are prone to higher risks. Iqbal et al. [31] have also revealed that the labourers who are working in recycling areas, Karachi city daily exposure to the contaminated air as they breathe, become contaminants. Furthermore, according to the Iqbal et al. [31] findings daily exposure for ingestion of organic flame retardants was 3.94 ng/kg, where anti-dechlorane plus (1.9 ng/kg), decabromodiphenyl ether (0.5 ng/kg), decabromodiphenyl ethane (0.38 ng/kg), and 1, 2-bis (2,4,6-tribromophenoxy) ethane (0.25 ng/kg) also at the higher level.
Strategies to enhance e-waste management in South-Asia
Increase the awareness and responsible act
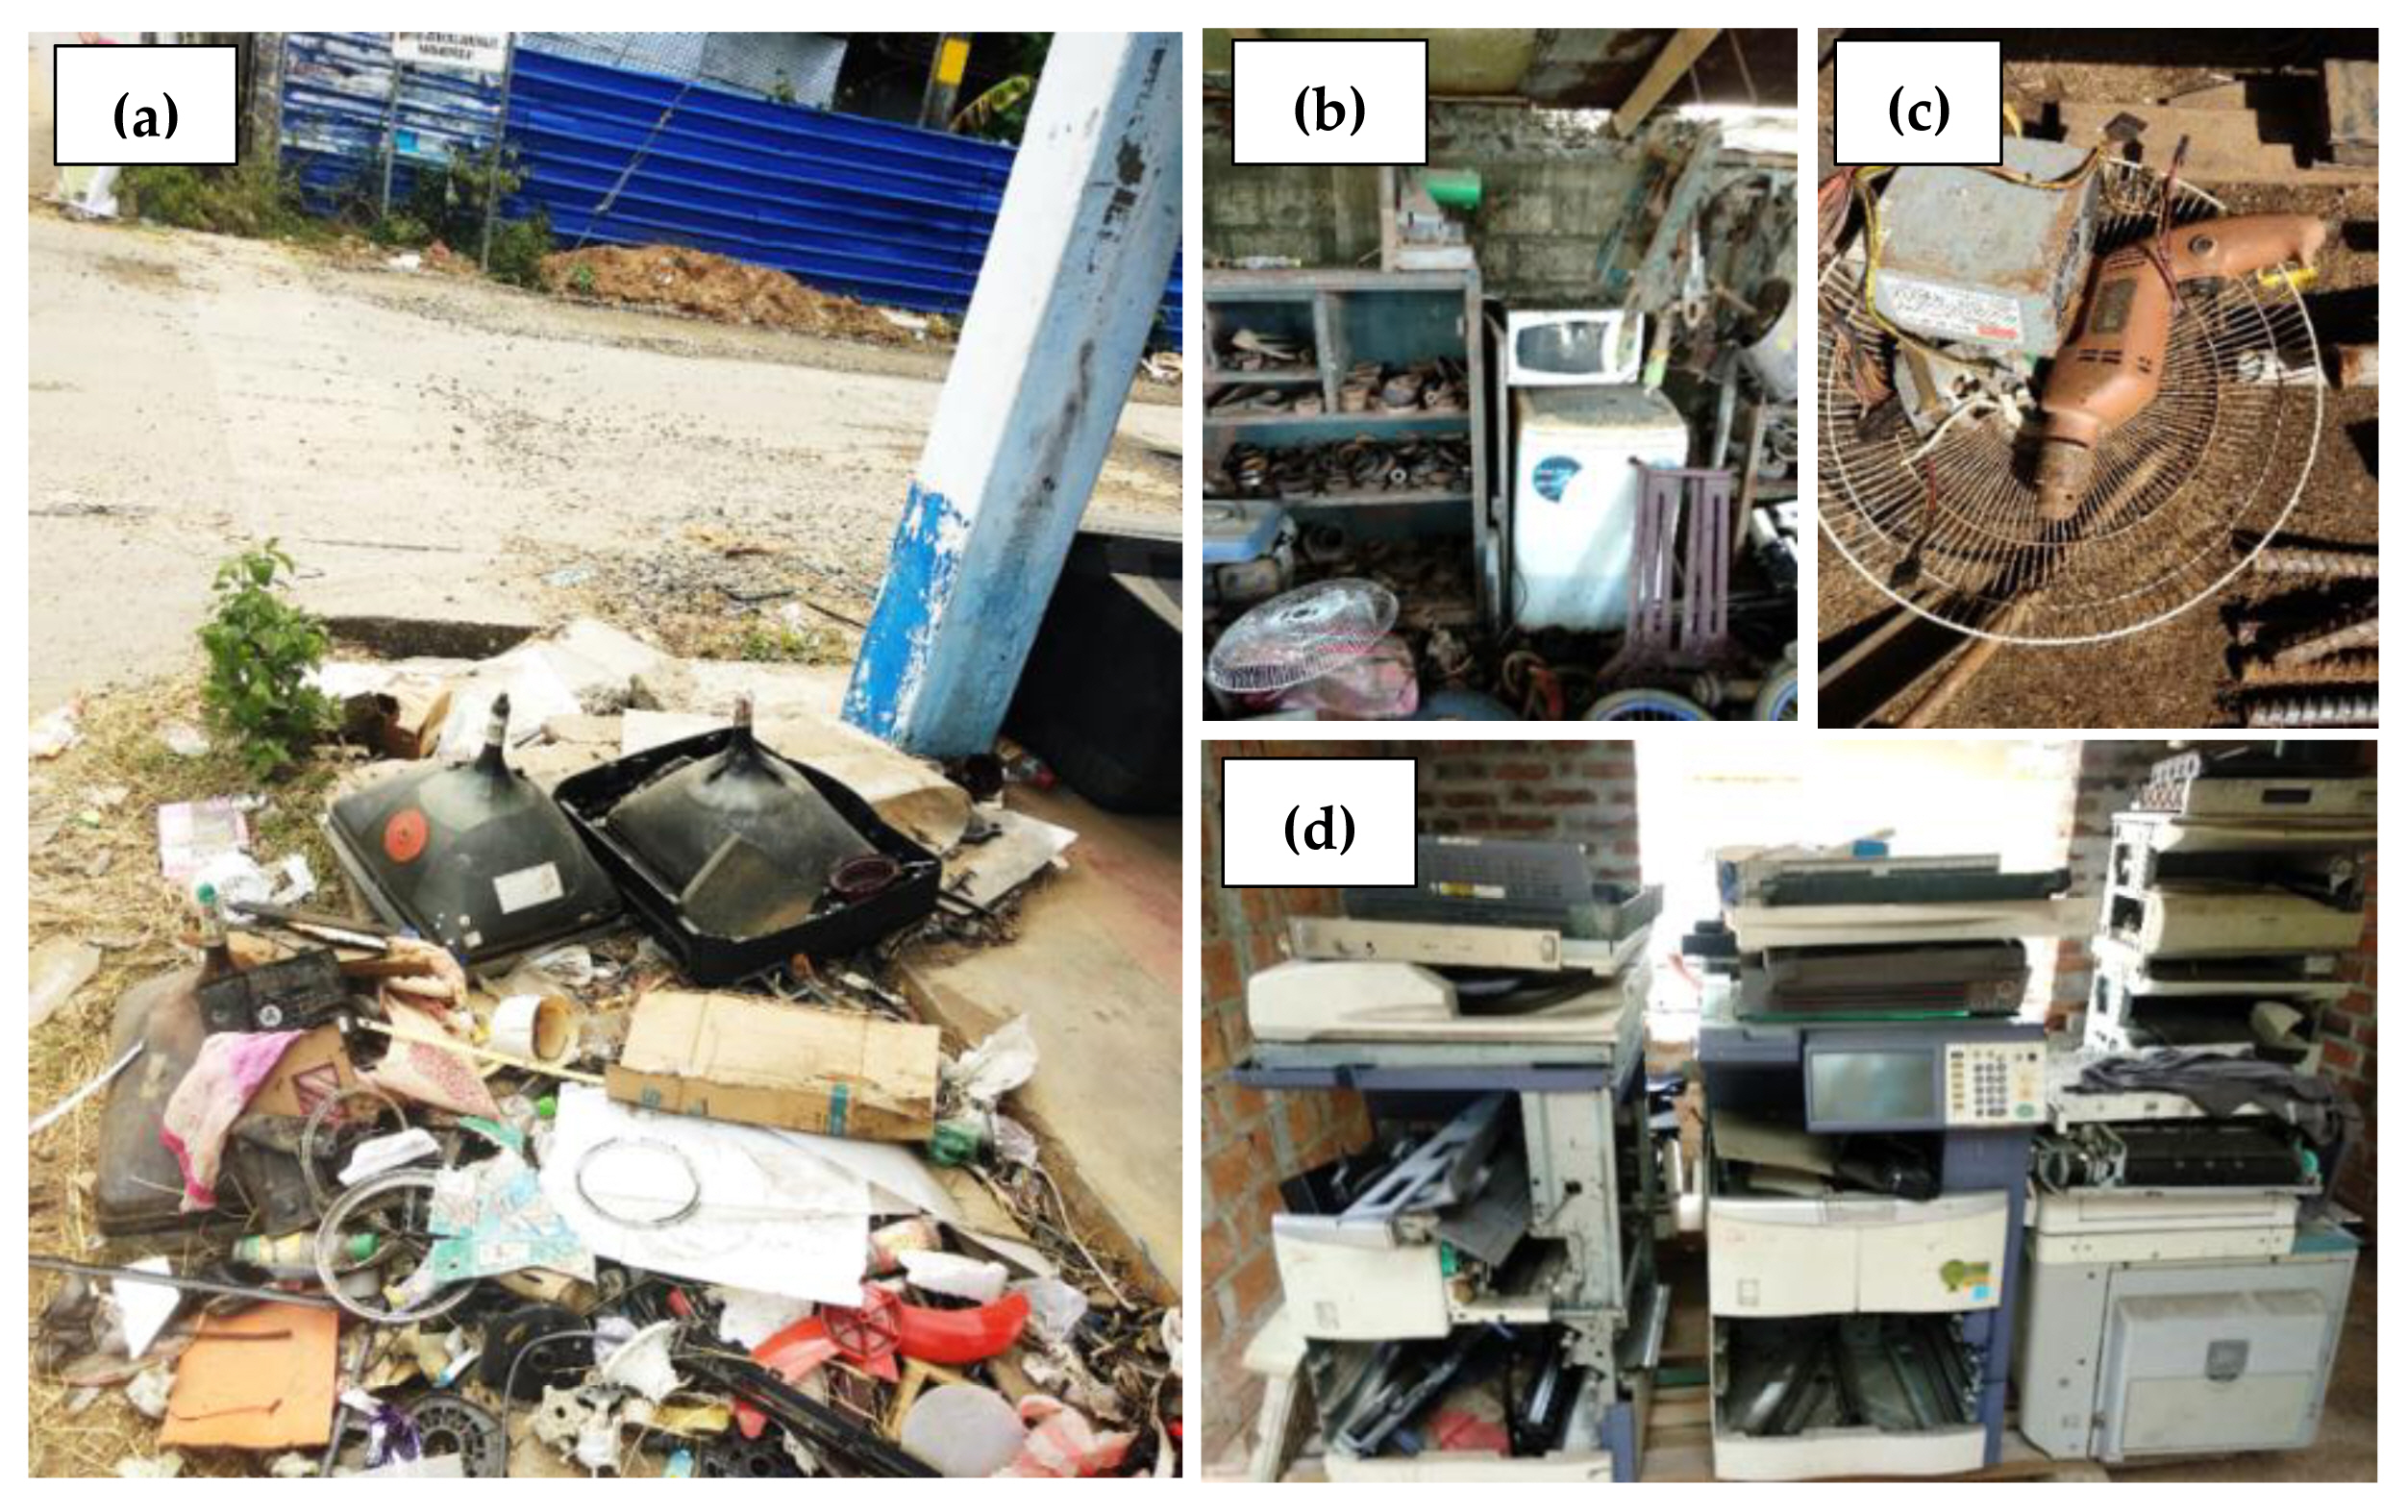
The consumer behaviour and collection mechanism of generated e-waste are critical factors for its management [54]. Lack of public awareness of the hazardous nature of e-waste and proper disposing/handling mechanisms are the few other reasons for irresponsible behaviour [13,27,55]. The public is considering e-waste as regular solid waste and mix with other household waste, throw away in unoccupied areas, burning, and burying are some of the major practices, which eventually contribute to environmental and human hazards rather than informal urban mining [56]. The challenges were compounded by handing over residential, business, and institutional e-waste to informal collectors. Some informal disposal and handling practices of e-waste show in Figure 6.
Recent studies also indicated that the workers who engaged in informal recycling had limited knowledge and awareness [53,57,58]. This exhibit as they work without using any safety dresses, or even not practising personal sanitation measures such as not washing hands before meals and not wearing clean clothes every day [47]. In another case, making understandable the fact to them is also challenging, which could be due to the poverty line and poor literacy [59]. In contrast, even if people are aware of the harmful nature of e-waste and the required disposal method, they do not act accordingly, particularly city dwellers who spend a complicated lifestyle and never think to dispose of it in the proper place [60].
To educate the public, there should be a significant national commitment, most importantly the public-private partnership to implement the relevancies effectively. Nonetheless, such measures have lately been invoked in India and Sri Lanka. Since 2015, the Ministry of Electronics and Information Technology (MeitY) has collaborated with industry associations to launch an e-waste awareness program as part of Digital India to raise public awareness about the dangers of unorganized sector e-waste recycling and to educate people about other options for e-waste disposal in an environmentally friendly manner [29]. Accordingly, the authors have noticed that, during recent years, the government and the private sector in Sri Lanka launched several programs. The local government of Eastern Province in Sri Lanka has launched a program to collect e-waste, particularly generated by household consumers. As well, joining, several private sectors launched an e-waste collection week to collect household waste; however, to a limited focused group. Limited buy-back offers are another e-waste collection system followed by the Sri Lankan reputed electronic sellers, to promote their business; however, e-waste eventually leads to formal recyclers.
Strengthen formal collectors and recyclers
As aforementioned, the majority of e-waste finally finds its way to scrap traders and dealers, the complex nature of the flow of e-waste becomes a challenge to its proper management. In a recent study, the authors have found that weak formal e-waste collection is one of the main lapses in Sri Lanka. Accordingly, the formal sectors do not have the capacity to collect e-waste across the island, whereas the informal sector does. The informal sector is likely to be more organized and vigorous, where the informal sector practices doorstep purchasing of e-waste, though the formal sector does not follow such a mechanism. Weak collection mechanism eventually reduces the input for the formal recyclers. In India, even though 178 registered e-waste recyclers are there, 95% of e-waste generated by the country is recycled in the informal sector and in a crude manner [29]. On the other hand, the lack of proper dismantling facilities in informal sectors is also a factor to consider. Being the capital city of Bangladesh, Dhaka, 475 tons of e-waste are daily sent to the formal recycling centers. However, from them, only 20 to 35% are recycled and due to the lack of facilities rest ultimately dumped informally [32]. Owing to the lack of advanced technologies and economical non-feasibility, Sri Lanka started to export the formally collected e-waste. For example, during 2019-2020 Sri Lanka exported 200 Mt of crushed fluorescent lamps and powder to Japan, 200 Mt of electronic scraps (excluding CFL bulbs, Fluorescent bulbs, and CRT monitors) to Korea, also 1000 Mt of telecommunication battery scrap [61].
Improve legal and regulatory regime
Despite India and Sri Lanka, other South-Asian countries have yet to enact dedicated national e-waste legislation [1]. In this regard, sufficient rules and regulations must be implemented that cover all particulars, including trade-offs, disposal, and management, as well as the illegal import of e-waste [12]. In addition, there are some supportive policies to control the e-waste heterogenized policies among the countries also noted from country to country. The national policies that allow, prohibit, or ignore e-waste export/import procedures differ from one country to the next. For example, Pakistan banned the import of e-waste, though India has yet to ratify this issue [62]. In 2010, India implemented the e-waste management and handling rules and introduced notification on e-waste legislation. Thereafter, e-waste management and handling rules-2011 commencement of e-waste legislation with ‘extended producer responsibility (EPR)’ guidelines and incorporated the suggestions made in the 2010 rules [28]. Later on, in 2016 India implemented the E-waste Management Rules to regulate the management and handling of e-waste at every stage; manufacturing, producer, collection centres, dealers, refurbish, consumer, dismantler, recycler etc. [63]. In Sri Lanka, policies for e-waste management have been developed to some extent; however, most of the policies are still in draft form. For example, e-waste management is considered in the National Waste Management Policy, however, it has yet to be adopted and implemented. The Ministry of Environment and Renewable Energy and Central Environmental Authority (CEA) are the key sectors to implement the policies on e-waste. Hazardous Waste (Scheduled Waste) Management Rules were first announced in Sri Lanka in 2008, as part of the National Environmental Act. According to the act, every e-waste generator, collector, storer, transporter, recover, recycler, and disposer must get a license from the CEA [64]. As well, today CEA has issued the license for about six e-waste management institutions [61]. As aforementioned, though there is no dedicated national legislation in other South Asian countries, there were some barriers created by the existing policies to some extent. In Pakistan, the environmental protection Act (1997) and trade Policy (2006-2007) prohibited the importation of hazardous waste [65].
In Bangladesh, Medical Waste Management Rules-2008 [12] was implemented to overcome the waste management issues in the medical sector also including e-waste [32]. Bhutan manages the e-waste under the Waste Prevention and Management Regulation of 2012, which includes detailed provisions for every producer, importer, exporter, transporter, and consumer for handling e-waste. It also formulated some legal impediments to the disposal of selected e-waste items; batteries, electronic circuits, and electronic devices through municipal law [66].
Novel/advanced technologies
Recycling approach
The main driven problem in managing e-waste in South-Asia is the lack of advanced recycling technologies, which help to minimize the hazardous nature of e-waste. In a study, Habib et al. [67] have found dry separation technology using a vertical vibration separator to detach the metallic and non-metallic fractions from the printed circuit board. Furthermore, Habib et al. [67] have recommended that this method could be helpful to eliminate the utilization of poor particle separation technologies, as particle separation grades are as high as 95%. In another study, Jadhao et al. [68] have demonstrated an eco-friendly technology for the metallic fraction recovery and the production of valuable gases from e-waste. The researchers have firstly crushed the chosen e-waste-printed circuit boards into fine partials (about 1mm in size) and subjected them to pyrolysis in order to the decomposition of material under an elevated temperature (200-600 °C) in an inert atmosphere. Finally, the novel ultrasonication process was used to separate metallic fractions. Furthermore, Jadhao et al. [68] have further found that using ultrasonication completely transfers precious metals (Au, Ag, Pd, and Pt) to the metallic fraction. As well, released gases such as H2, CH4, CO, and CO2 from pyrolysis can be used to run the plant.
Removal of the e-waste environmental contaminations
Phytoremediation is one of the promising technologies to overcome the effect of e-waste pollutants, particularly heavy metals. Yet, the technique is restricted to a few regions, especially the developed countries to remove any source of pollutants. No studies conducted on the feasibility to apply this technology to remediate the e-waste pollutants in South-Asia. In this technique, plants are used to restore polluted environments. In here, generally, plants are growing over the contaminated sites to stop further off-site contamination. There are three processes in Phytoremediation namely, phytostabilization, phytoextraction, and phytovolatilization. In phytostabilization pollutants accumulated by roots or immobilization within the rhizosphere and stop the further spread of pollutants. While in phytoextraction pollutants are absorbed via roots, transport, and concentrate contaminants into the aboveground shoots. In phytostabilization, pollutants are absorbed by the root (and can be transported to aerial parts) and within the plant, the pollutants could be converted into less toxic compounds and released into the atmosphere in a gaseous state [69].
In a study, Luo et al. [70] have demonstrated the phytoremediation approach to purify metals contaminated soil from e-waste recycling sites. In this regard, Luo et al. [70] have successfully used hyperaccumulator-Eucalyptus globulus (Tasmanian blue gum) along with chelating agent- Ethylenediaminetetraacetic acid/EDTA, plant hormone foliar application to decontaminate the excess Cd, Pb, and Cu and the plants also show fewer toxicity responses [71]. The ability of Eucalyptus sp. to grow up in wide environmental conditions shows the great capability to apply this plant-based technology in South-Asian reagents [72,73]. Chen et al. [74] have attempted to phytoremediation of aged polychlorinated biphenyl (PCB)-contaminated soil from an e-waste recycling site using; Medicago sativa L.(alfalfa), Lolium perenne L.(ryegrass), Festuca arundinacea (tall fescue) and Oryza sativa (rice plant) along with enhancements namely, glucose, biphenyl and three surfactants (TritonX-100, randomly methylated-b-cyclodextrins and b-cyclodextrin). They have recorded the removal of PCB by all the selected plants and the most effective combination shows L. perenne with b-cyclodextrin. Nevertheless, the researchers have observed that improving the soil microorganism surrounding the plant roots (the rhizosphere), could be the most significant factor for such detoxification as plant roots stimulate the catalytic activities of this rich microflora.
Alternatively, a similar approach has been adopted by researchers applying microorganisms to degrade contaminants has recently received a lot of attention [75,76]. Taştan et al. [77]; Achal et al. [78] and Dong et al. [79] demonstrated the degradation of Ni (II), As (III), Cr (III), using Aspergillus versicolor, Sporosarcina ginsengisoli CR5, and Bacillus cereus XMCr-6 respectively. Wu et al. [80] have isolated a Stenotrophomonas sp. (strain WZN-1) from the e-waste recycling area, which has the ability to degrade the Polybrominated diphenyl ethers (decabro-modiphenyl ether). They have found that under the optimum condition the bacteria can able to degrade 55.15% of the pollutant (65 μg/L), within 30 days.
Conclusions
Along with the technological invasion, readily available with a higher purchasing rate of cheap and low-quality electronic products, significant amounts of e-waste become dumped, collected, and recycled informally in South-Asia. India, Pakistan, Bangladesh, and Sri Lanka could be recognized as the most awkward predicament for e-waste as they are responsible for generating considerable amounts of e-waste in the region. Numerous studies show that informal handling and management practices of e-waste give an immense effect on the environment and also on human health due to the presence of hazardous compounds, particularly heavy metals. Due to the irresponsible act, dumping of e-waste into the open lands and waterways speeds up the spread of hazards impact. Poor formal waste management system, administration, legal implementation, local government participation, research and development accelerate the e-waste generation and informal practices whereas South-Asia under the pressure of becoming an e-waste hotspot in the world. In order to address these issues, a number of collective attempts should be made. One of them is to increase public awareness of e-waste. To do this, it could launch continuous awareness programs and campaigns. Also, can display relevant information in public places. Further, mass media can also be used effectively to reach the public. Edifying the grassroots on all aspects of e-waste is another great movement to follow by the government and private-owned education centers. Apart from those, a proper e-waste collection system needs to be developed by empowering the formal collectors. The integration of the informal and formal sectors could also be very beneficial, handing over both the governmental and private sectors along with stronger ties to the legal regime. South-Asia should also be well-armed with effective novel/advanced recycling technologies, however, better to be more economical. There is no doubt that all the countries in the region should increase their number of formal recyclers as well. Inventory studies are not in the row and should be developed to support the policymakers to make their decisions. E-wastes are also received to the region as second-hand goods, though not properly understood and no adequate legal implementation to restrict it. In this fact, each country in South-Asia looked to deal with the threat in their own way and the lack of corporate policies among the countries aggregated the issue. Thus, one country may restrict the landing of e-waste, while another may welcome it and support the movement of e-waste within the region. Therefore, cooperative policies for the region are urgently needed. Moreover, the commitment of each government would be the next challenge for these movements to be successful in this diverse region. Short and long-term action plans are required to be implemented significantly by all the countries accounting for aforesaid suggestions. By addressing those shortcomings, South-Asia could be in a safe zone in the near future.